

New paradigm for auditory paired pulse suppression
- PMID: 28542290
- PMCID: PMC5436751
- DOI: 10.1371/journal.pone.0177747
New paradigm for auditory paired pulse suppression
Abstract
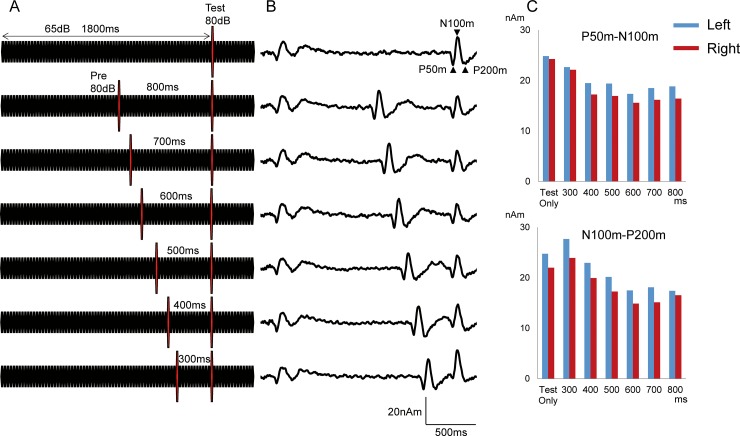
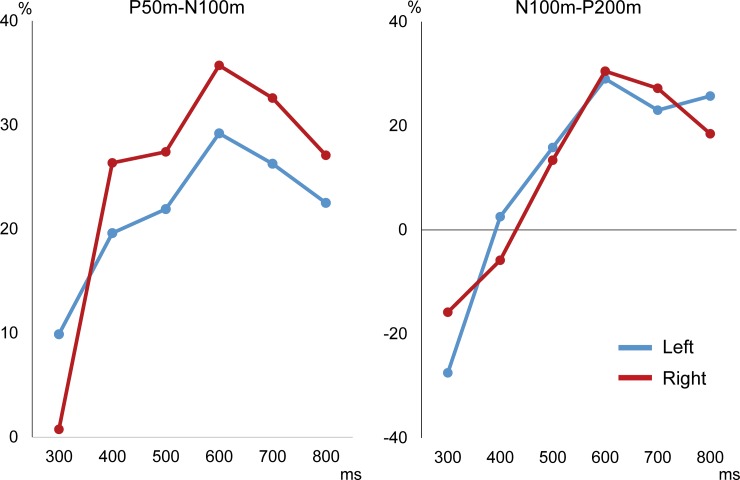
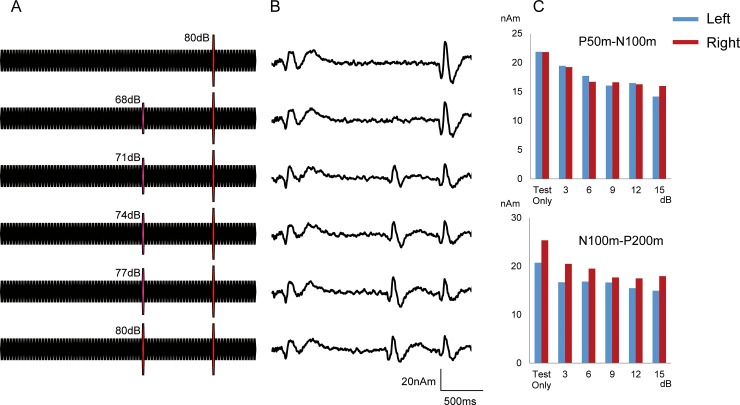
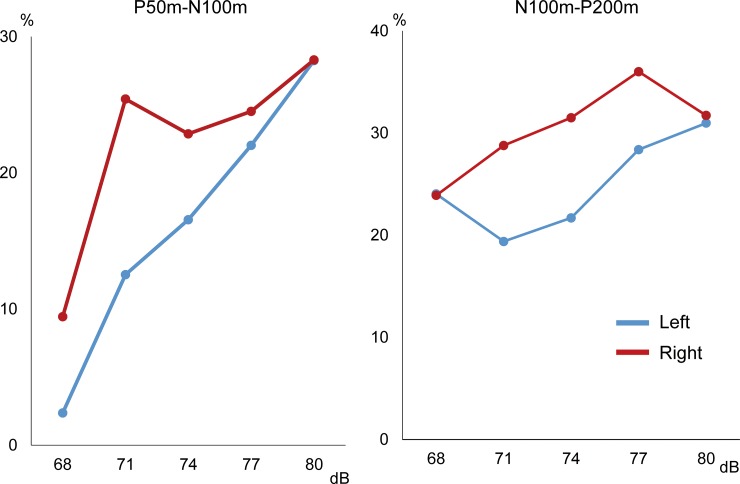
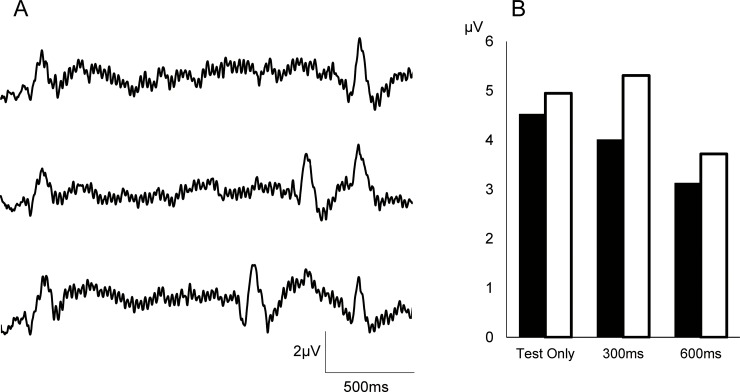
Sensory gating is a mechanism of sensory processing used to prevent an overflow of irrelevant information, with some indexes, such as prepulse inhibition (PPI) and P50 suppression, often utilized for its evaluation. In addition, those are clinically important for diseases such as schizophrenia. In the present study, we investigated long-latency paired-pulse suppression of change-related cortical responses using magnetoencephalography. The test change-related response was evoked by an abrupt increase in sound pressure by 15 dB in a continuous sound composed of a train of 25-ms pure tones at 65 dB. By inserting a leading change stimulus (prepulse), we observed suppression of the test response. In Experiment 1, we examined the effects of conditioning-test intervals (CTI) using a 25-ms pure tone at 80 dB as both the test and prepulse. Our results showed clear suppression of the test response peaking at a CTI of 600 ms, while maximum inhibition was approximately 30%. In Experiment 2, the effects of sound pressure on prepulse were examined by inserting prepulses 600 ms prior to the test stimulus. We found that a paired-pulse suppression greater than 25% was obtained by prepulses larger than 77 dB, i.e., 12 dB louder than the background, suggesting that long latency suppression requires a relatively strong prepulse to obtain adequate suppression, different than short-latency paired-pulse suppression reported in previous studies. In Experiment 3, we confirmed similar levels of suppression using electroencephalography. These results suggested that two identical change stimuli spaced by 600 ms were appropriate for observing the long-latency inhibition. The present method requires only a short inspection time and is non-invasive.
Conflict of interest statement
Figures
Similar articles
-
Long-latency suppression of auditory and somatosensory change-related cortical responses.PLoS One. 2018 Jun 26;13(6):e0199614. doi: 10.1371/journal.pone.0199614. eCollection 2018. PLoS One. 2018. PMID: 29944700 Free PMC article.
-
Mechanisms of Short- and Long-Latency Sensory Suppression: Magnetoencephalography Study.Neuroscience. 2023 Mar 15;514:92-99. doi: 10.1016/j.neuroscience.2022.11.016. Epub 2022 Nov 23. Neuroscience. 2023. PMID: 36435478
-
Effects of acute nicotine on prepulse inhibition of auditory change-related cortical responses.Behav Brain Res. 2013 Nov 1;256:27-35. doi: 10.1016/j.bbr.2013.07.045. Epub 2013 Aug 6. Behav Brain Res. 2013. PMID: 23933145
-
Inhibition in the Human Auditory Cortex.PLoS One. 2016 May 24;11(5):e0155972. doi: 10.1371/journal.pone.0155972. eCollection 2016. PLoS One. 2016. PMID: 27219470 Free PMC article.
-
Auditory gating processes and binaural inhibition in the inferior colliculus.Hear Res. 2002 Jun;168(1-2):98-109. doi: 10.1016/s0378-5955(02)00356-8. Hear Res. 2002. PMID: 12117513 Review.
Cited by
-
Long-latency suppression of auditory and somatosensory change-related cortical responses.PLoS One. 2018 Jun 26;13(6):e0199614. doi: 10.1371/journal.pone.0199614. eCollection 2018. PLoS One. 2018. PMID: 29944700 Free PMC article.
-
Assessment of haptic memory using somatosensory change-related cortical responses.Hum Brain Mapp. 2020 Dec;41(17):4892-4900. doi: 10.1002/hbm.25165. Epub 2020 Aug 26. Hum Brain Mapp. 2020. PMID: 32845051 Free PMC article.
-
Mechanisms of Long-Latency Paired Pulse Suppression: MEG Study.Brain Topogr. 2022 Mar;35(2):241-250. doi: 10.1007/s10548-021-00878-6. Epub 2021 Nov 8. Brain Topogr. 2022. PMID: 34748108
-
Auditory Sensory Gating: Effects of Noise.Biology (Basel). 2024 Jun 18;13(6):443. doi: 10.3390/biology13060443. Biology (Basel). 2024. PMID: 38927323 Free PMC article.
-
Change-Related Acceleration Effects on Auditory Steady State Response.Front Syst Neurosci. 2019 Oct 15;13:53. doi: 10.3389/fnsys.2019.00053. eCollection 2019. Front Syst Neurosci. 2019. PMID: 31680884 Free PMC article.
References
-
- Bramon E, Rabe-Hesketh S, Sham P, Murray RM, Frangou S. Meta-analysis of the P300 and P50 waveforms in schizophrenia. Schizophr Res. 2004; 70: 315–329. doi: 10.1016/j.schres.2004.01.004 - DOI - PubMed
-
- Greenwood TA, Light GA, Swerdlow NR, Calkins ME, Green MF, Gur RE et al. Gating deficit heritability and correlation with increased clinical severity in schizophrenia patients with positive family history. Am J Psychiatry. 2016;173:385–391. doi: 10.1176/appi.ajp.2015.15050605 - DOI - PMC - PubMed
-
- Turetsky BI, Calkins ME, Light GA, Olincy A, Radant AD, Swerdlow NR. Neurophysiological endophenotypes of schizophrenia: the viability of selected candidate measures. Schizophr Bull. 2007;33:69–94. doi: 10.1093/schbul/sbl060 - DOI - PMC - PubMed
-
- Potter D, Summerfelt A, Gold J, Buchanan RW. Review of clinical correlates of P50 sensory gating abnormalities in patients with schizophrenia. Schizophr Bull. 2006;32:692–700. doi: 10.1093/schbul/sbj050 - DOI - PMC - PubMed
-
- Javitt DC, Freedman R. Sensory processing dysfunction in the personal experience and neuronal machinery of schizophrenia. Am J Psychiatry. 2015;172:17–31. doi: 10.1176/appi.ajp.2014.13121691 - DOI - PMC - PubMed
MeSH terms
LinkOut - more resources
Full Text Sources
Other Literature Sources
Research Materials
Miscellaneous
