. 2017 May 23;12(5):e0177726.
doi: 10.1371/journal.pone.0177726. eCollection 2017.

Development of machine learning models for diagnosis of glaucoma

Affiliations

Development of machine learning models for diagnosis of glaucoma

Seong Jae Kim et al. PLoS One. .

Abstract

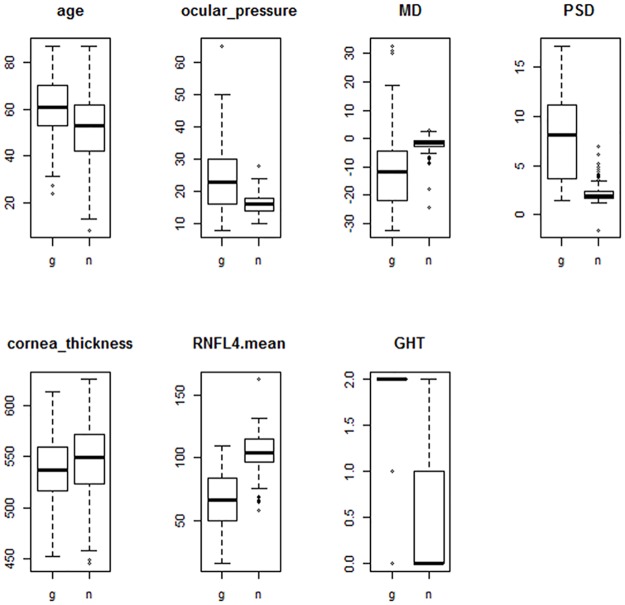
The study aimed to develop machine learning models that have strong prediction power and interpretability for diagnosis of glaucoma based on retinal nerve fiber layer (RNFL) thickness and visual field (VF). We collected various candidate features from the examination of retinal nerve fiber layer (RNFL) thickness and visual field (VF). We also developed synthesized features from original features. We then selected the best features proper for classification (diagnosis) through feature evaluation. We used 100 cases of data as a test dataset and 399 cases of data as a training and validation dataset. To develop the glaucoma prediction model, we considered four machine learning algorithms: C5.0, random forest (RF), support vector machine (SVM), and k-nearest neighbor (KNN). We repeatedly composed a learning model using the training dataset and evaluated it by using the validation dataset. Finally, we got the best learning model that produces the highest validation accuracy. We analyzed quality of the models using several measures. The random forest model shows best performance and C5.0, SVM, and KNN models show similar accuracy. In the random forest model, the classification accuracy is 0.98, sensitivity is 0.983, specificity is 0.975, and AUC is 0.979. The developed prediction models show high accuracy, sensitivity, specificity, and AUC in classifying among glaucoma and healthy eyes. It will be used for predicting glaucoma against unknown examination records. Clinicians may reference the prediction results and be able to make better decisions. We may combine multiple learning models to increase prediction accuracy. The C5.0 model includes decision rules for prediction. It can be used to explain the reasons for specific predictions.


Conflict of interest statement

Competing Interests: The authors have declared that no competing interests exist.

Figures

Fig 1
Fig 1. Box plots for selected features (g: Glaucoma, h: Health control).
All features show a large difference of median values between glaucoma and healthy controls.
Fig 2
Fig 2. PCA plot for prepared dataset.
Each point means a case in the dataset. Generally, the glaucoma cases are well separated from the healthy control cases. Some cases are located in the border area or opposite area. Right plot shows relationship between distribution of cases and features. In the glaucoma group, PSD, GHT, ocular_presure, and age have high values whereas MD and RNFL4_mean have low values.
Fig 3
Fig 3. Classification test procedure using learning models.
Fig 4
Fig 4. ROC curve and AUC for four models.
AUC expresses global quality of prediction models and RF and C5.0 models show 0.979, SVM is over 0.967, and KNN is 0.971. All models show very high values near 1.0.
Fig 5
Fig 5. Decision tree for diagnosis of glaucoma from C5.0 algorithm.
It contains 19 rules and the training error of the model is 0.016.
Fig 6
Fig 6. Case 6, color-fundus and red-free fundus photography (A), peripapillary RNFL thickness measured by SD-OCT (B), and automated 30–2 visual field test (C).
The presence of a tigroid fundus and peripapillary atrophy was observed, and there was a decrease in the RNFL thickness on the peripapillary RNFL thickness scan. In the visual field test, the abnormalities were judged to be of no clinical significance.
Fig 7
Fig 7. Case 81, color-fundus and red-free fundus photography (A), peripapillary RNFL thickness measured by SD-OCT (B), and automated 30–2 visual field test (C).
Fundus photographs show an increased cup-to-disc ratio and RNFL defects in the both eyes. SD-OCT shows decrease in peripapillary thickness of inferotemporal quadrant for both eyes. Visual field defects are apparent in both eyes.
Fig 8
Fig 8. Case 161, color-fundus and red-free fundus photography (A), peripapillary RNFL thickness measured by SD-OCT (B), and automated 30–2 visual field test (C).
Fundus photographs show an increased cup-to-disc ratio in both eyes and a RNFL defect in the left eye. SD-OCT shows a decrease in the peripapillary thickness of the infratemporal quadrant of the left eye. The visual field test demonstrates field defect in the left eye.

References

    1. Weinreb RN, Aung T, Medeiros FA. The pathophysiology and treatment of glaucoma: a review. Jama 2014;311(18):1901–11. 10.1001/jama.2014.3192 - DOI - PMC - PubMed
    1. Tay E, Seah SK, Chan SP, Lim ATH, Chew SJ, Foster PJ. Optic disk ovality as an index of tilt and its relationship to myopia and perimetry. Am J Ophthalmol 2005;139(2):247–52. 10.1016/j.ajo.2004.08.076 - DOI - PubMed
    1. Özdek SC, Önol M, Gürelik G, Hasanreisoglu B. Scanning laser polarimetry in normal subjects and patients with myopia. Br J Ophthalmol 2000;84(3):264–7. 10.1136/bjo.84.3.264 - DOI - PMC - PubMed
    1. Chan K, Lee TW, Sample PA, Goldbaum MH, Weinreb RN, Sejnowski TJ. Comparison of machine learning and traditional classifiers in glaucoma diagnosis. IEEE T Bio-med Eng 2002;49(9):963–74 - PubMed
    1. Goldbaum MH, Sample PA, Chan K, Williams J, Lee TW, Blumenthal E, et al. Comparing machine learning classifiers for diagnosing glaucoma from standard automated perimetry. Invest Ophth Vis Sci 2002;43(1):162–9. - PubMed