

Human plasma metabolomics in age-related macular degeneration (AMD) using nuclear magnetic resonance spectroscopy
- PMID: 28542375
- PMCID: PMC5436712
- DOI: 10.1371/journal.pone.0177749
Human plasma metabolomics in age-related macular degeneration (AMD) using nuclear magnetic resonance spectroscopy
Abstract
Purpose: To differentiate the plasma metabolomic profile of patients with age related macular degeneration (AMD) from that of controls, by Nuclear Magnetic Resonance (NMR) spectroscopy.
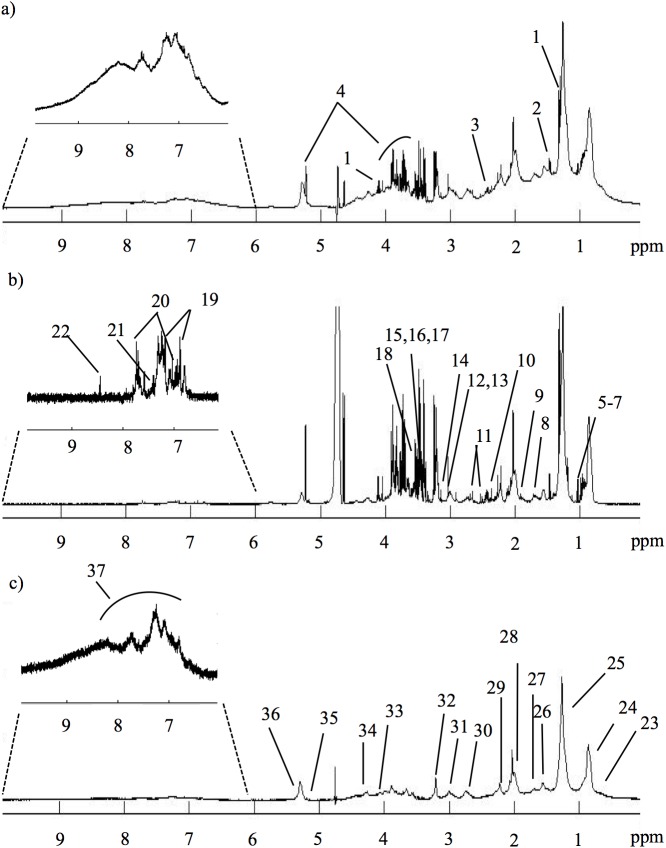
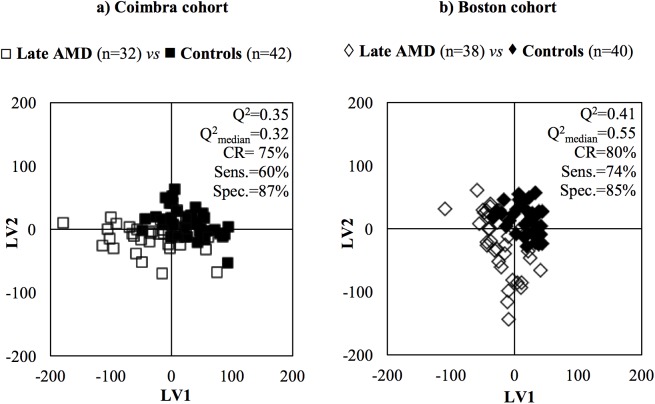
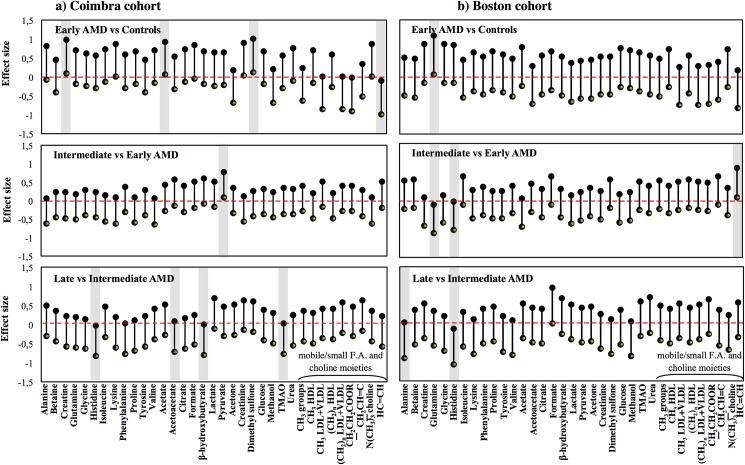
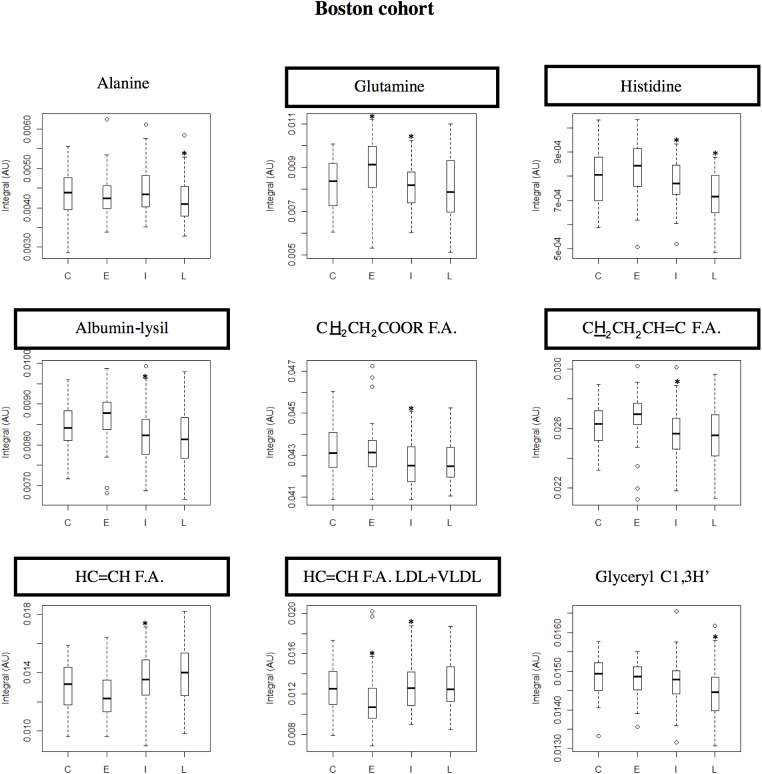
Methods: Two cohorts (total of 396 subjects) representative of central Portugal and Boston, USA phenotypes were studied. For each cohort, subjects were grouped according to AMD stage (early, intermediate and late). Multivariate analysis of plasma NMR spectra was performed, followed by signal integration and univariate analysis.
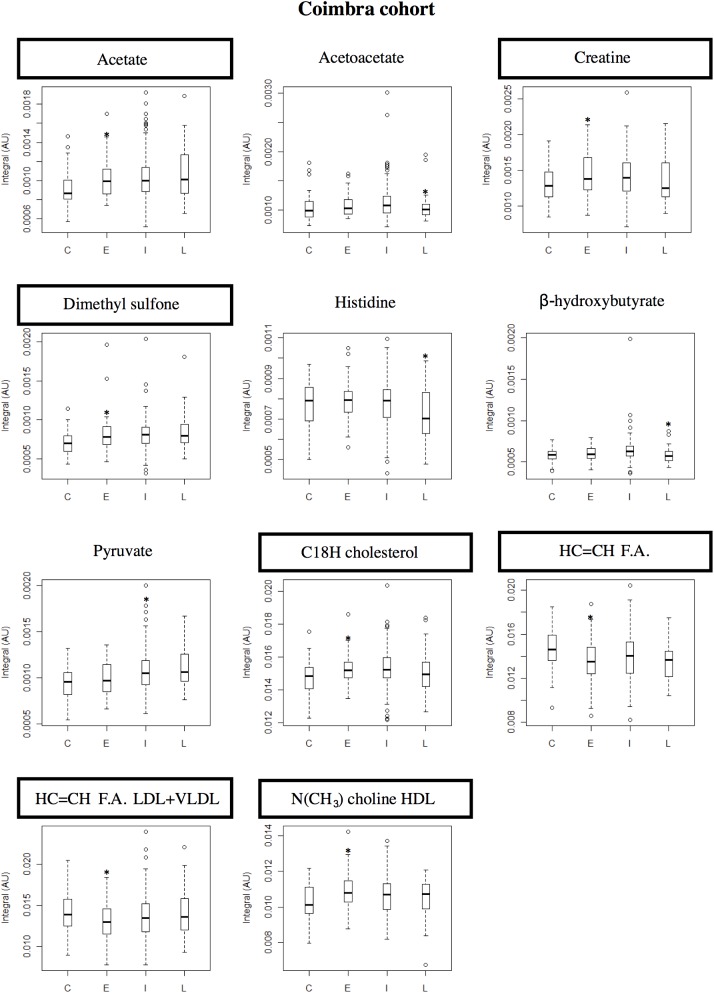
Results: Small changes were detected in the levels of some amino acids, organic acids, dimethyl sulfone and specific lipid moieties, thus providing some biochemical information on the disease. The possible confounding effects of gender, smoking history and age were assessed in each cohort and found to be minimal when compared to that of the disease. A similar observation was noted in relation to age-related comorbidities. Furthermore, partially distinct putative AMD metabolite fingerprints were noted for the two cohorts studied, reflecting the importance of nutritional and other lifestyle habits in determining AMD metabolic response and potential biomarker fingerprints. Notably, some of the metabolite changes detected were noted as potentially differentiating controls from patients diagnosed with early AMD.
Conclusion: For the first time, this study showed metabolite changes in the plasma of patients with AMD as compared to controls, using NMR. Geographical origins were seen to affect AMD patients´ metabolic profile and some metabolites were found to be valuable in potentially differentiating controls from early stage AMD patients. Metabolomics has the potential of identifying biomarkers for AMD, and further work in this area is warranted.
Conflict of interest statement
Figures
References
-
- Wong WL, Su X, Li X, Cheung CMG, Klein R, Cheng C-Y, et al. Global prevalence of age-related macular degeneration and disease burden projection for 2020 and 2040: a systematic review and meta-analysis. Lancet Glob Heal. 2014;2: e106–16. - PubMed
-
- Yonekawa Y, Miller JW, Kim IK. Age-Related Macular Degeneration: Advances in Management and Diagnosis. J Clin Med. 2015;4: 343–59. doi: 10.3390/jcm4020343 - DOI - PMC - PubMed
-
- Handa JT. How does the macula protect itself from oxidative stress? Mol Aspects Med. 2012;33: 418–35. doi: 10.1016/j.mam.2012.03.006 - DOI - PMC - PubMed
-
- Mitta VP, Christen WG, Glynn RJ, Semba RD, Ridker PM, Rimm EB, et al. C-reactive protein and the incidence of macular degeneration: pooled analysis of 5 cohorts. JAMA Ophthalmol. 2013;131: 507–13. doi: 10.1001/jamaophthalmol.2013.2303 - DOI - PMC - PubMed
MeSH terms
Grants and funding
LinkOut - more resources
Full Text Sources
Other Literature Sources
Medical
