. 2017 May 19;12(5):e0177921.
doi: 10.1371/journal.pone.0177921. eCollection 2017.

Evidence for pleural epithelial-mesenchymal transition in murine compensatory lung growth

Affiliations

Evidence for pleural epithelial-mesenchymal transition in murine compensatory lung growth

Alexandra B Ysasi et al. PLoS One. .

Abstract

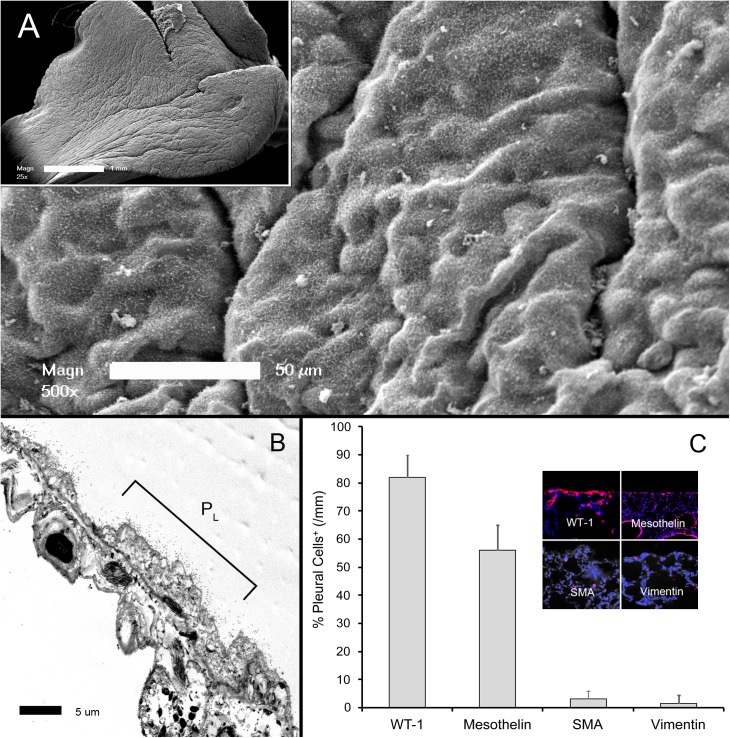
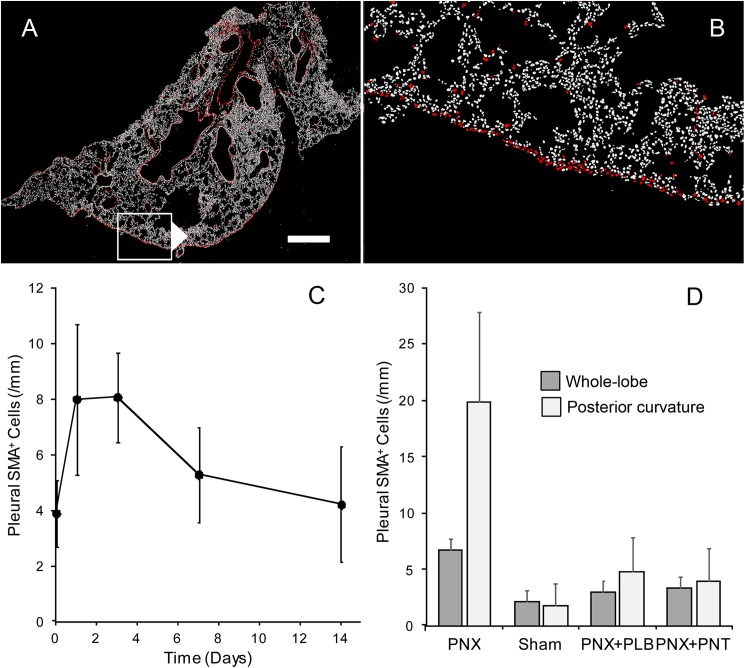
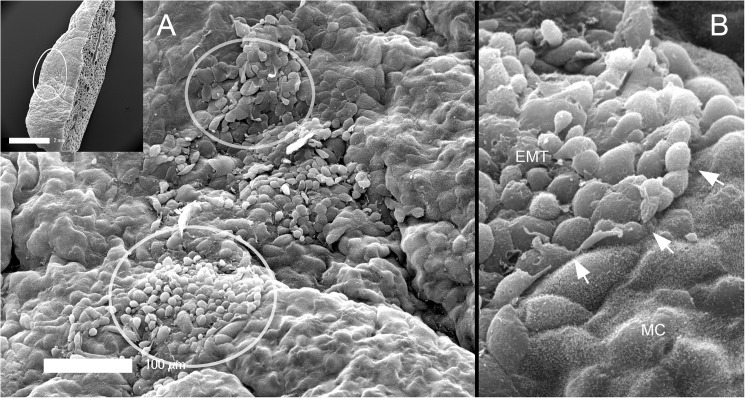
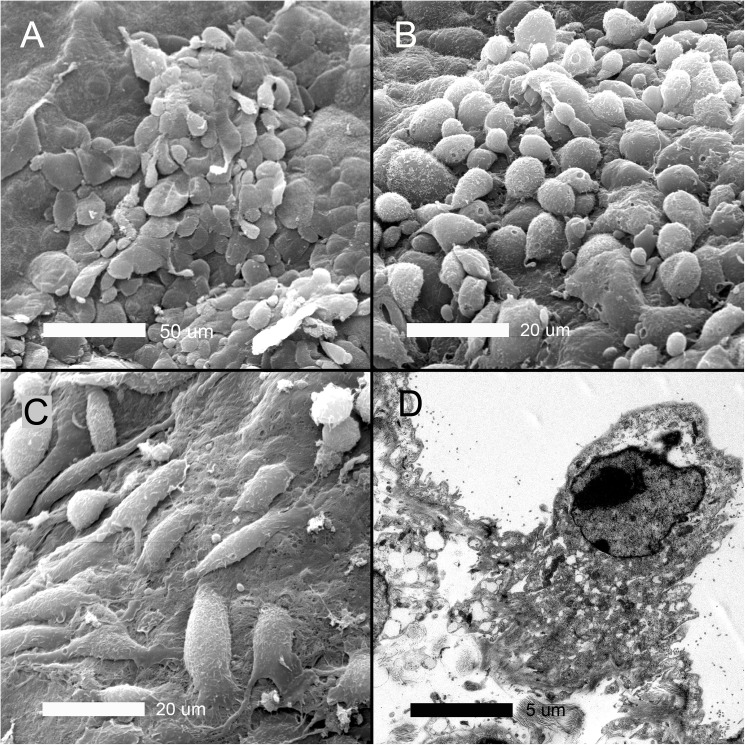
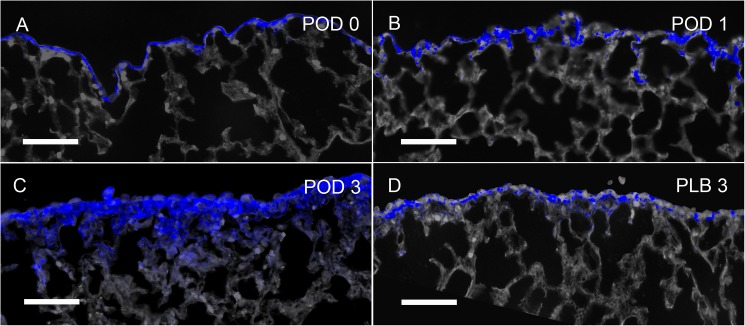
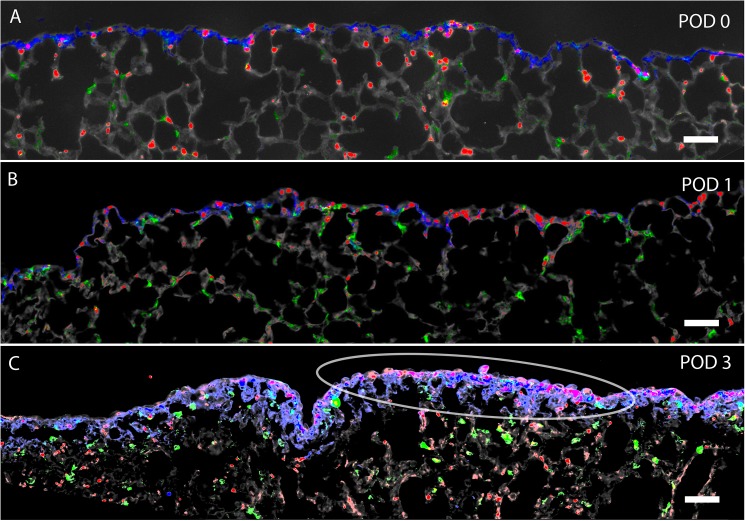
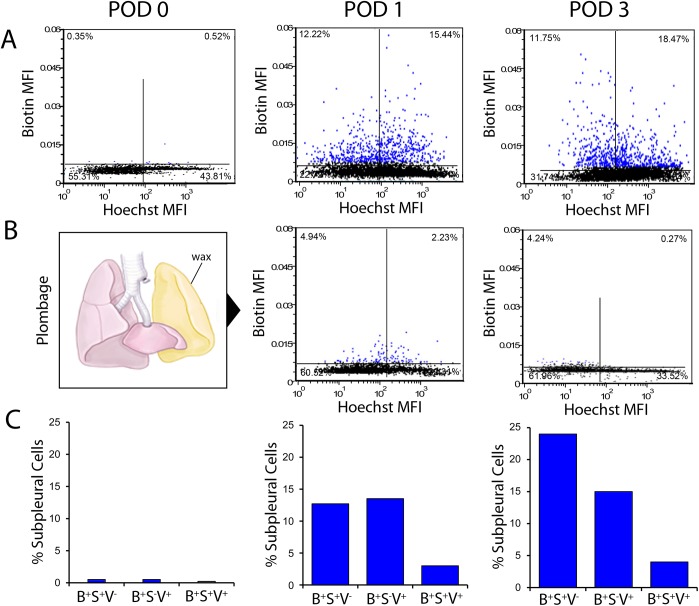
In many mammals, including rodents and humans, removal of one lung results in the compensatory growth of the remaining lung; however, the mechanism of compensatory lung growth is unknown. Here, we investigated the changes in morphology and phenotype of pleural cells after pneumonectomy. Between days 1 and 3 after pneumonectomy, cells expressing α-smooth muscle actin (SMA), a cytoplasmic marker of myofibroblasts, were significantly increased in the pleura compared to surgical controls (p < .01). Scanning electron microscopy of the pleural surface 3 days post-pneumonectomy demonstrated regions of the pleura with morphologic features consistent with epithelial-mesenchymal transition (EMT); namely, cells with disrupted intercellular junctions and an acquired mesenchymal (rounded and fusiform) morphotype. To detect the migration of the transitional pleural cells into the lung, a biotin tracer was used to label the pleural mesothelial cells at the time of surgery. By post-operative day 3, image cytometry of post-pneumonectomy subpleural alveoli demonstrated a 40-fold increase in biotin+ cells relative to pneumonectomy-plus-plombage controls (p < .01). Suggesting a similar origin in space and time, the distribution of cells expressing biotin, SMA, or vimentin demonstrated a strong spatial autocorrelation in the subpleural lung (p < .001). We conclude that post-pneumonectomy compensatory lung growth involves EMT with the migration of transitional mesothelial cells into subpleural alveoli.


Conflict of interest statement

Competing Interests: The authors have declared that no competing interests exist.

Figures

Fig 1
Fig 1. Morphology of the visceral pleural mesothelium.
A) Scanning electron microscopy (SEM) of the cardiac lobe 3 days after sham thoracotomy. The pleural surface demonstrated the characteristic "bumpy" appearance of the mesothelium covered by microvilli (inset, whole lobe). B) The thin mesothelial monolayer and microvilli were apparent on transmission electron microscopy (TEM)(PL = free pleural surface). C) The control mesothelium expressed WT-1 and mesothelin; only rare cells expressed the cytoskeletal proteins SMA and vimentin (inset, immunofluorescence staining). Immunostaining reflects the percentage of positive pleural cells per mm of cardiac lobe pleura.
Fig 2
Fig 2. Whole-lobe multiwavelength cell scoring of the remaining cardiac lobe after left pneumonectomy.
A, B) The positively curved posterior pleural surface stained for α-smooth muscle actin (SMA)(SMA = red, bar = 200um). C) Extending previous observations of SMA expression in the first 3 days after pneumonectomy [11], the most reproducible expression was on a postoperative day 3 (POD 3). D) SMA expression after pneumonectomy (PNX) was compared to conditions controlling for pleural deformation: sham thoracotomy (Sham), pneumonectomy and plombage (PNX+PLB), pneumonectomy and phrenic nerve transection (PNX+PNT)(N = 3 each condition). SMA expression after pneumonectomy mice significantly higher than in the three control conditions (p < .01). The difference was greater when the analysis was restricted to the posterior curvature of the cardiac lobe (p < .01). There was no difference between the control conditions (p>.05).
Fig 3
Fig 3. Scanning electron microscopy (SEM) of the post-operative pleural mesothelium.
SEM of the cardiac lobe is shown 3 days after pneumonectomy (inset). A) Distinct morphologic forms of epithelial-to-mesenchymal transition (EMT) was seen (circles). B) There were clear demarcations between transitional zones and normal mesothelial cells (MC) with intact microvilli (arrows).
Fig 4
Fig 4. Electron microscopy of the cardiac lobe pleural mesothelium 3 days after pneumonectomy.
A) Cells apparently in the early stages of transition—with disruption of intercellular junctions and loss of microvilli—retained the typical “flagstone” mesothelial morphology. B) Cells apparently in the later stages of transition demonstrating few intercellular junctions and rounded morphology. C) Spindle cell or fusiform morphotypes were found in some regions associated with exposed basement membrane. D) Transmission electron microscopy demonstrated mesothelial cells with Golgi and mitochondrial ultrastructure suggesting significantly enhanced metabolic activity. In some cells, TEM demonstrated chromatin condensation suggesting apoptosis in a subset of pleural cells (not shown).
Fig 5
Fig 5. Expression of biotin in the cardiac lobe visceral pleura after pneumonectomy.
The pleura was labeled with sulfo-NHS-biotin at the time of surgery. The biotin tracer was subsequently detected in tissue sections using near-infrared Quantum Dots (blue). Within 4 hours of pneumonectomy (POD 0), the biotin tracer was still largely restricted to the pleura. Hoechst 33342 nuclear stain and septal microarchitecture are pseudocolored gray. B) Within 24 hours of pneumonectomy (POD1), cells expressing biotin (blue) were detected in the pleura and contiguous alveolar septa. C) Within 3 days of pneumonectomy (POD 3), broader staining of the biotin tracer was noted extending into the subpleural septa. D) In contrast, mice 3 days after pneumonectomy and plombage (PLB) demonstrated discontinuous biotin tracer largely restricted to the pleura. Representative images shown; bar = 200 μm.
Fig 6
Fig 6. Expression of biotin, SMA, and vimentin in the cardiac lobe after pneumonectomy.
The pleura was labeled with sulfo-NHS-biotin at the time of surgery. The biotin tracer was subsequently detected in tissue sections using near-infrared Quantum Dots (blue). A) Within 4 hours of pneumonectomy (POD 0), the biotin tracer was largely restricted to the pleura. Counterstaining with anti-SMA (red) and anti-vimentin (green) demonstrated scattered actin and intermediate filament staining in the pleura and subpleural alveoli. Hoechst 33342 nuclear stain and septal microarchitecture are pseudocolored gray. B) Within 24 hours of pneumonectomy (POD1), cells expressing biotin (blue), SMA (red) and vimentin (green) were detected in the pleura and contiguous alveolar septa. C) Within 3 days of pneumonectomy (POD 3), broader staining of the biotin tracer was noted. Biotin, SMA and vimentin labeling was noted deeper in subpleural alveoli. Representative images shown; pseudocolors chosen for contrast enhancement. Bar = 100 μm.
Fig 7
Fig 7. Image cytometry of the cardiac lobe after pneumonectomy.
The remaining lung was labeled with sulfo-NHS-biotin intraoperatively. Columns represent whole-lobe fluorescence histochemistry and image cytometry of the cardiac lobe 4 hours (postoperative day 0, POD 0), 24 hours (POD 1) and 3 days (POD 3) after pneumonectomy. Biotin was detected with IR-avidin. Hoechst 3342 was used as a cell identifier in multiwavelength cell scoring [11] and as a semi-quantitative measure of DNA content [18]. In dual parameter dot plots, subpleural cells are colored blue. A) Dual parameter histograms reflect the relative mean fluorescence intensity (MFI) of the IR-avidin/biotin and Hoechst 3342 for individual cells in the subpleural lung detected by image cytometry. Aggregate data for the cardiac lobe in N = 3 animals is shown in each histogram. B) Plombage involved placing inert wax (volume equal to the measured lung volume change after pneumonectomy) into the empty hemithorax immediately after pneumonectomy. A comparison of subpleural cells expressing IR-avidin/biotin after pneumonectomy (A) and pneumonectomy plus plombage (B) on POD 1 and POD 3 was highly significantly (p < .01). C) Image cytometry of all subpleural cells (greater than 104 cells per mouse; N = 3 mice) demonstrated that few cells expressed either SMA (3.4%) or vimentin (3.6%); however, gating on subpleural biotin+ cells demonstrated 29.2% of POD 1 and 38.1% of POD 3 cells expressed SMA, vimentin or SMA/vimentin. With spatial gating on subpleural lung, the cytometry results for cells expressing biotin (B+), SMA (S+) and vimentin (V+) are shown. Variance between mice was less than 5%.

References

    1. Hsia CCW, Berberich MA, Driscoll B, Laubach VE, Lillehei CW, Massaro C, et al. (2004) Mechanisms and limits of induced postnatal lung growth. Am J Respir Crit Care Med 170: 319–343. doi: 10.1164/rccm.200209-1062ST - DOI - PubMed
    1. Butler J, Loring SH, Patz S, Tsuda A, Yablonskiy DA, Mentzer SJ. (2012) Evidence for adult lung growth in humans. N Engl J Med 367: 244–247. doi: 10.1056/NEJMoa1203983 - DOI - PMC - PubMed
    1. Konerding MA, Gibney BC, Houdek J, Chamoto K, Ackermann M, Lee G, et al. (2012) Spatial dependence of alveolar angiogenesis in post-pneumonectomy lung growth. Angiogenesis 15: 23–32. doi: 10.1007/s10456-011-9236-y - DOI - PMC - PubMed
    1. Lin M, Chamoto K, Gibney B, Lee GS, Collings-Simpson D, Houdek J, et al. (2011) Angiogenesis gene expression in murine endothelial cells during post-pneumonectomy lung growth. Resp Res 12:98. - PMC - PubMed
    1. Fehrenbach H, Voswinickel R, Michl V, Mehling T, Fehrenbach A, Seeger W, et al. (2008) Neoalveolarisation contributes to compensatory lung growth following pneumonectomy in mice. Eur Respir J 31: 515–522. doi: 10.1183/09031936.00109407 - DOI - PubMed

LinkOut - more resources