. 2017 May 24;12(5):e0178087.
doi: 10.1371/journal.pone.0178087. eCollection 2017.

Genome-scale investigation of olfactory system spatial heterogeneity

Affiliations

Genome-scale investigation of olfactory system spatial heterogeneity

Torben Noto et al. PLoS One. .

Abstract

The early olfactory system is organized in parallel, with numerous, specialized subsystems established by the modular and topographic projections of sensory inputs. While these anatomical sub-systems are in many cases demarcated by well-known marker genes, we stand to learn considerably more about their possible functional specializations from comprehensive, genome-scale descriptions of their molecular anatomy. Here, we leverage the resources of the Allen Brain Atlas (ABA)-a spatially registered compendium of gene expression for the mouse brain-to investigate the early olfactory system's genomic anatomy. We cluster thousands of genes across thousands of voxels in the ABA to derive several novel parcellations of the olfactory system, and concomitantly discover novel sets of enriched, subregion-specific genes that can serve as a starting point for future inquiry.


Conflict of interest statement

Competing Interests: The authors have declared that no competing interests exist.

Figures

Fig 1
Fig 1. Workflow.
A) The principal data set was a genes x voxels matrix [3,21] cataloging brain-wide expression. Columns corresponding to known olfactory areas were selected, and the dimensionality of the resultant sub-matrix was reduced using non-negative matrix factorization (NMF). The cartoon shows an example of reducing the original data from m-dimensional to s-dimensional, where m>>s. B) NMF yields a new basis set (column vectors) as well as weights of voxels in the new basis (row vectors). Voxels are readily clustered by selecting the largest weight, and registration of clustered voxels to the anatomical atlas reveals the spatial patterning of clusters. Note that the clustering itself is blind to spatial relationships among voxels. The cartoon shows an example where s = 2.
Fig 2
Fig 2. Genomically-defined divisions of the olfactory system.
A) Horizontal-plane projection of the mouse olfactory system as demarcated in the Allen Brain Atlas (named subregions shown to the right). Diencephalic, midbrain, and brainstem structures are shown in gray for spatial context, though voxels comprising these structures were not used in the analysis. Abbreviations: R-rostral, C-caudal, D-dorsal, V-ventral) B) 3D rendering of the olfactory system, showing its various subdivisions, as in (A). The main (1) and accessory (2) olfactory bulbs define the rostral-most pole of the mouse brain and receive direct input from the olfactory periphery; the remaining structures receive both direct and indirect bulbar input, and lie along the brain’s ventral surface. C) Non-Negative Matrix Factorization (NMF)-based clustering of the olfactory system, for various choices of subspace size, s (see text for details).
Fig 3
Fig 3. Olfactory system subdivisions defined by ‘physiological’ genes.
A) Top: matrix of weights (H matrix) for all olfactory system voxels, for a 5 dimensional NFM decomposition. Columns have been sorted by peak value (preserving the order and values of row-contents) to reveal the block-diagonal structure of the matrix. Bottom: Polar plots of the average column-vector for each diagonal block, showing categorical assignment of voxels to one the five weight dimensions, to the relative exclusion of others. B) Spatial arrangement of clustered voxels shown in (A), in Brain-Atlas coordinates. Note the strong spatial contiguity of most of the clusters (with region 1 being a notable exception). Colors correspond to the polar plot colors in (A). Region names in quotes are given as a heuristic summary—they do not necessarily align with ABA or other atlas definitions. C) Dendrogram showing inter-cluster distances (Euclidian distance between basis vectors).
Fig 4
Fig 4. Gene expression profiles derived from NMF are sparse.
A) Expression profiles (the basis vectors W1-W5) for the three families of IUPHAR genes investigated (see text). B) Histograms of each expression profile. The x-axis is on a log-scale to reveal structure (gene ‘hits’) in the distribution tails that is not otherwise evident.
Fig 5
Fig 5. Gene expression and differential enrichment in the anterior vs posterior AOB.
A) 1: Scatter plots of gene expression for all 3,041 genes in the anterior vs. posterior AOB. Each point is an average across anterior voxels and posterior voxels (see Methods). Dotted line indicates equal expression in the anterior and posterior. Lower graph is the same data on an expanded scale. A2) total expression of all genes in the Anterior AOB and posterior AOB, illustrating no notable difference between the two. B) top. plot of differential enrichment (anterior AOB enrichment—posterior AOB enrichment; see text) for all genes. The majority of genes were symmetrically or near-symmetrically expressed in the anterior and posterior AOB. Genes with asymmetry scores exceeding 4 standard deviations are shown in lines and markers. The remainder of genes are shown as dots. Bottom: Histogram differential enrichment, shown in both linear (red) and log axes.
Fig 6
Fig 6. Clustering (s = 2) returns the known anterior and posterior sub-divisions of the AOB.
A) Weights matrix (See Fig 1) showing dichotomous segregation of AOB voxels. B) NMF reveals spatially contiguous subregions of the AOB clearly corresponding to the structure’s (known) anterior and posterior sub-divisions. C) classification accuracy of NMF vs number of genes included. Top: fraction of ‘perfectly classified voxels’, as a function of number of genes (see Methods). Bottom: Mean classification accuracy vs. number of genes used for the factorization. D) Histogram of basis-vector values, illustraing sparseness of the basis vectors (i.e. a small number of genes defines membership in anterior vs. posterior).
Fig 7
Fig 7. Clustering the main olfactory bulb reveals candidate genomic subdivisions.
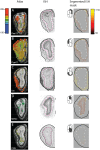
A) Location of NMF-derived clusters (s = 2) in ABA coordinates (see S1 File for genes comprising the clusters). B) left: NMF-decomposition (s = 2) of the fifth coronal section of the expression atlas reveals clear dorsal v. ventral domains (white box indicates ABA voxel-size); middle: ISH image from the ABA of Lhx9 –the highest ranked gene in the dorsal cluster; right: segmented expression mask showing strong dorsal pattering of Lhx9 (contrast unadjusted from the raw, downloaded mask). C) NMF decompositions of the OB (5th coronal section) at progressively greater granularity, revealing the ventral glomeruli as a clear and contiguous genomic territory as well as two distinct domains within the dorsal glomeruli. The lettering of clusters in the s = 5 case corresponds to the lettering in Fig 8. See supplementary info (S1 File) for genes comprising each cluster.
Fig 8
Fig 8. Expression patterns of leading genes in each of the 5 NMF-derived OB clusters.
Letters (A-E) correspond to clusters labeled in Fig 7C. Icons at the top-left of the segmented masks show which cluster is being shown. A) Phosphoprotein enriched in astrocytes 15 (Pea15); rank # 2/3,041; enriched in the dorsomedial glomerular cluster. B) Purkinje cell protein 4-like (Pcp4l1); rank #2/3,04; enriched in the dorsolateral glomerular cluster. C) Vitronectin (Vtn); rank #3/3,041; enriched in the ventral glomerular cluster. D) Myocyte enhancer factor 2C (Mef2c); rank #7/3,041 (#3 of protein coding genes); enriched in dorsal mitral and granule cells; E) Corticotropin releasing hormone (CRH); rank #24/3,041; enriched in ventral granule cell population.

References

    1. Plato, Helmbold WC, Rabninowitz W. Phaedrus. Indianapolis: Bobbs-Merrill Co.; 1956.
    1. Swanson LW. Quest for the basic plan of nervous system circuitry. Brain Res Rev. 2007;55: 356–372. 10.1016/j.brainresrev.2006.12.006 - DOI - PMC - PubMed
    1. Lein ES, Hawrylycz MJ, Ao N, Ayres M, Bensinger A, Bernard A, et al. Genome-wide atlas of gene expression in the adult mouse brain. Nature. 2007;445: 168–176. 10.1038/nature05453 - DOI - PubMed
    1. Hawrylycz M, Bernard A, Lau C, Sunkin SM, Chakravarty MM, Lein ES, et al. Areal and laminar differentiation in the mouse neocortex using large scale gene expression data. Methods San Diego Calif. 2010;50: 113–121. 10.1016/j.ymeth.2009.09.005 - DOI - PubMed
    1. Thompson CL, Pathak SD, Jeromin A, Ng LL, MacPherson CR, Mortrud MT, et al. Genomic anatomy of the hippocampus. Neuron. 2008;60: 1010–1021. 10.1016/j.neuron.2008.12.008 - DOI - PubMed

Substances

LinkOut - more resources