. 2017 May 18;12(5):e0178105.
doi: 10.1371/journal.pone.0178105. eCollection 2017.

ROS regulation of axonal mitochondrial transport is mediated by Ca2+ and JNK in Drosophila

Affiliations

ROS regulation of axonal mitochondrial transport is mediated by Ca2+ and JNK in Drosophila

Pin-Chao Liao et al. PLoS One. .

Abstract

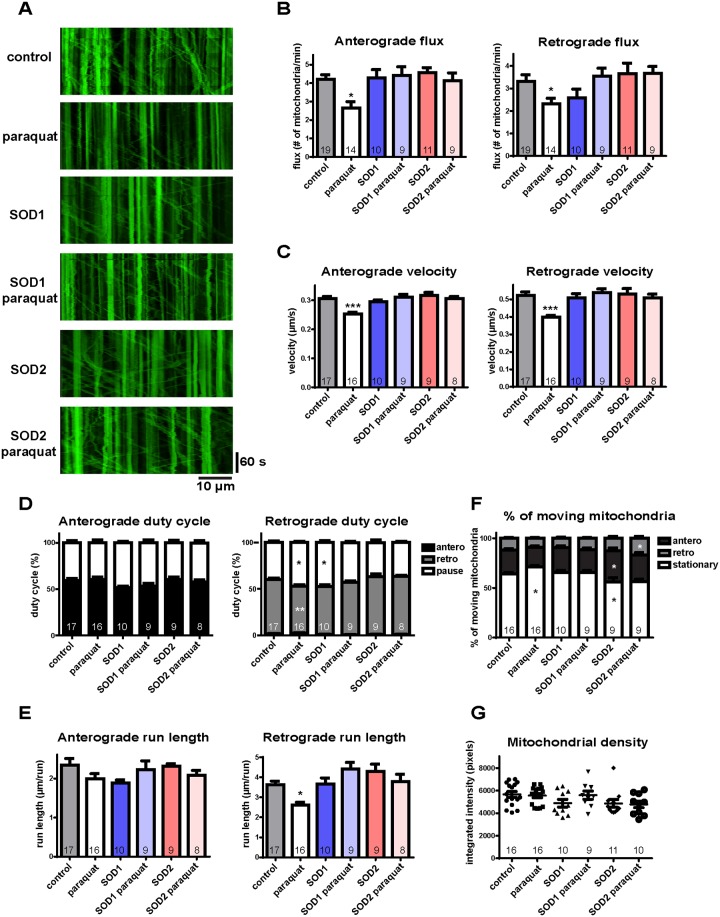
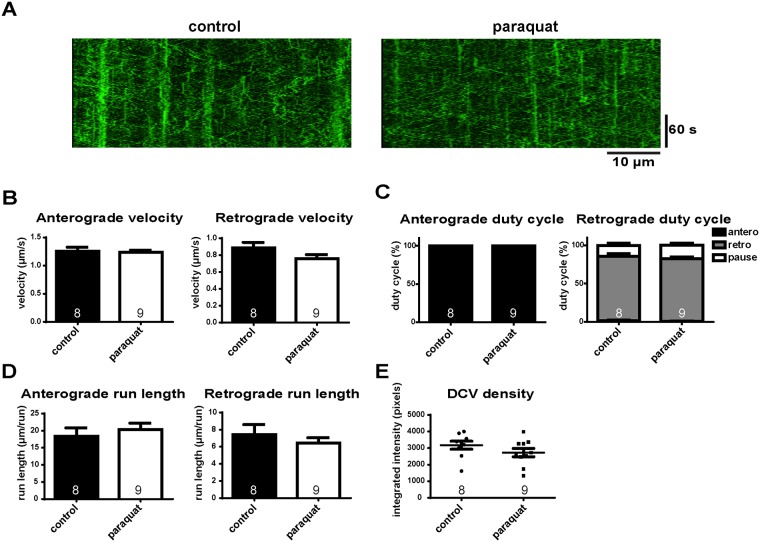
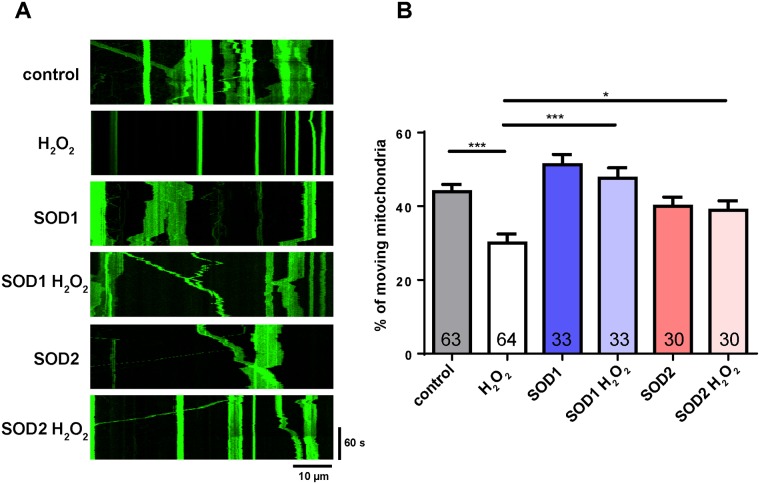
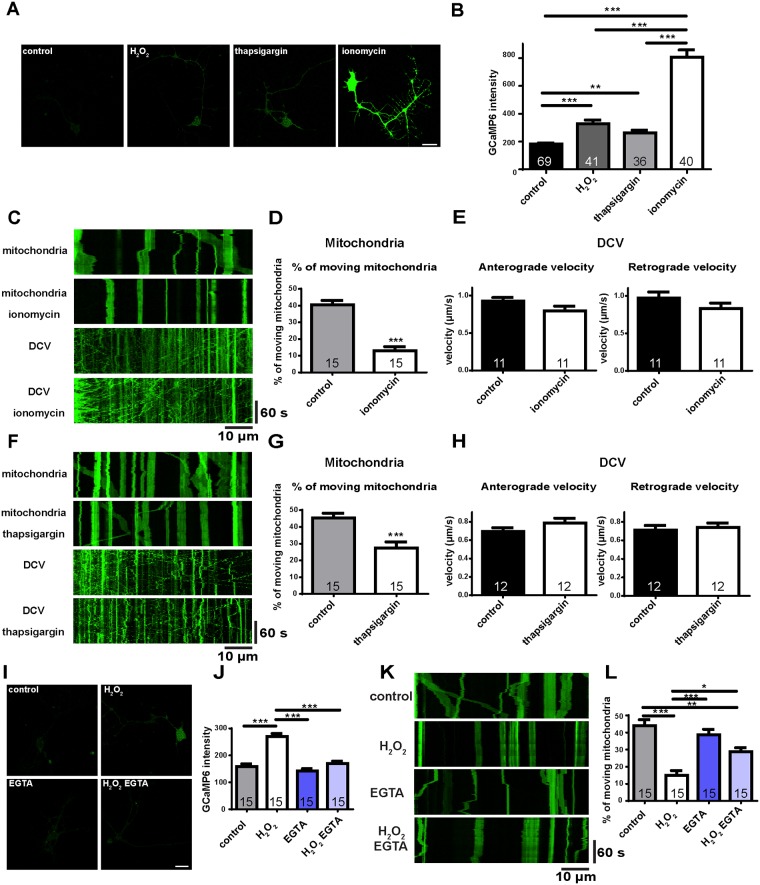
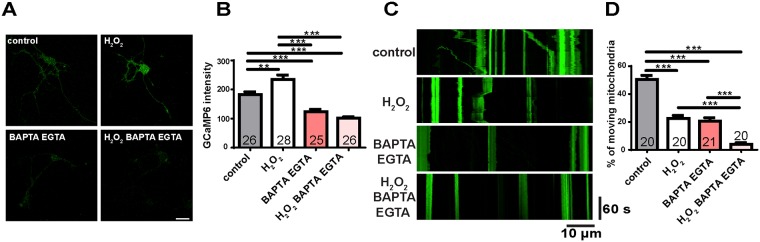
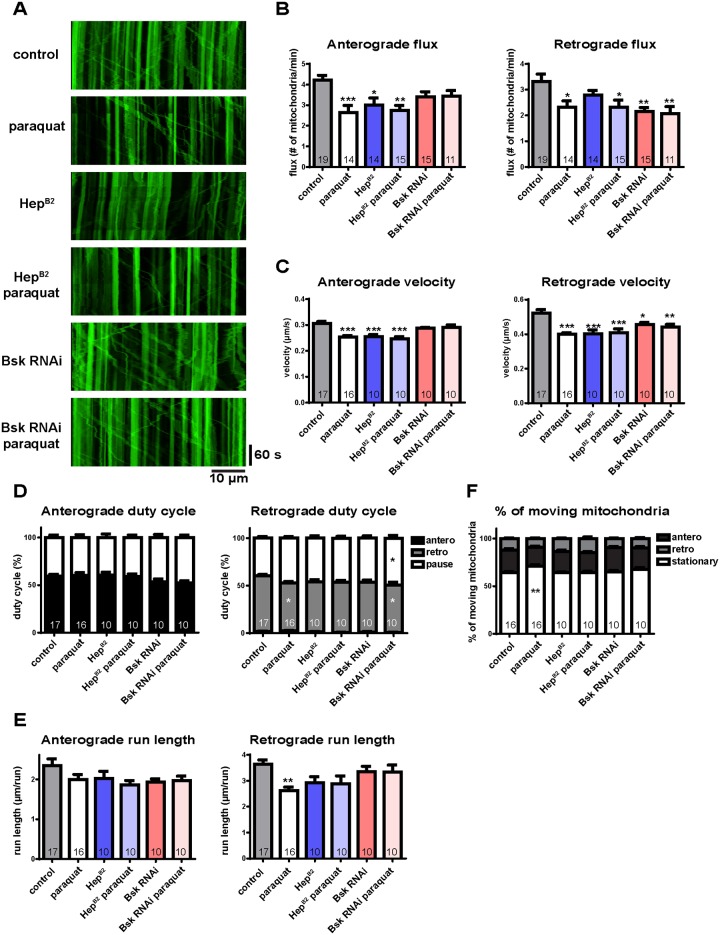
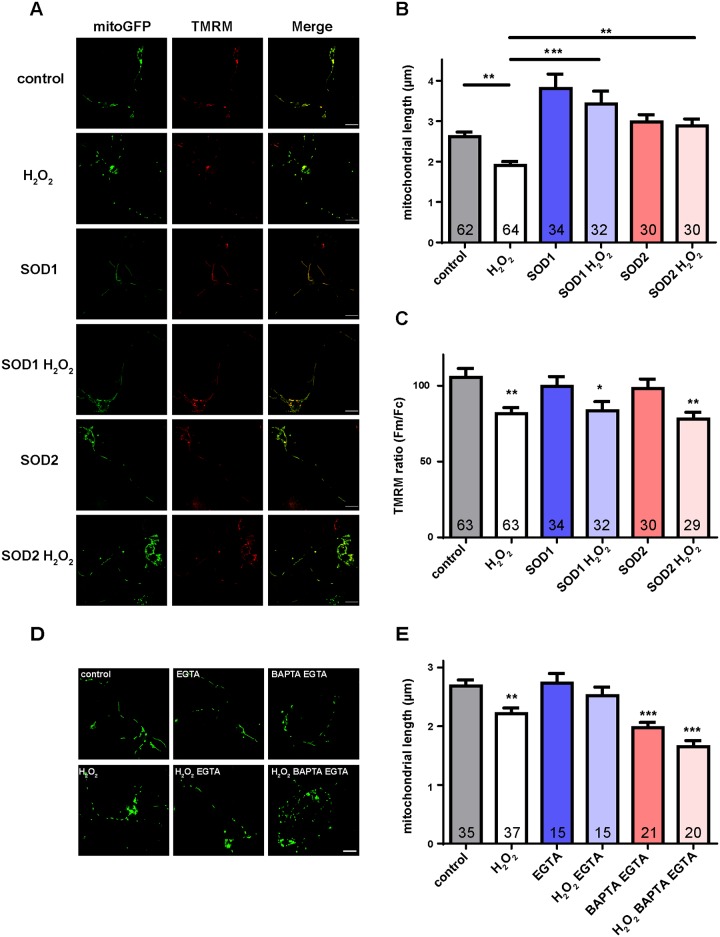
Mitochondria perform critical functions including aerobic ATP production and calcium (Ca2+) homeostasis, but are also a major source of reactive oxygen species (ROS) production. To maintain cellular function and survival in neurons, mitochondria are transported along axons, and accumulate in regions with high demand for their functions. Oxidative stress and abnormal mitochondrial axonal transport are associated with neurodegenerative disorders. However, we know little about the connection between these two. Using the Drosophila third instar larval nervous system as the in vivo model, we found that ROS inhibited mitochondrial axonal transport more specifically, primarily due to reduced flux and velocity, but did not affect transport of other organelles. To understand the mechanisms underlying these effects, we examined Ca2+ levels and the JNK (c-Jun N-terminal Kinase) pathway, which have been shown to regulate mitochondrial transport and general fast axonal transport, respectively. We found that elevated ROS increased Ca2+ levels, and that experimental reduction of Ca2+ to physiological levels rescued ROS-induced defects in mitochondrial transport in primary neuron cell cultures. In addition, in vivo activation of the JNK pathway reduced mitochondrial flux and velocities, while JNK knockdown partially rescued ROS-induced defects in the anterograde direction. We conclude that ROS have the capacity to regulate mitochondrial traffic, and that Ca2+ and JNK signaling play roles in mediating these effects. In addition to transport defects, ROS produces imbalances in mitochondrial fission-fusion and metabolic state, indicating that mitochondrial transport, fission-fusion steady state, and metabolic state are closely interrelated in the response to ROS.


Conflict of interest statement

Competing Interests: The authors have declared that no competing interests exist.

Figures

Fig 1
Fig 1. ROS changes mitochondrial motility mainly by reducing flux and velocity in vivo.
(A) Representative kymographs of mitochondrial transport under paraquat treatment. Anterograde transport is toward the right; retrograde transport is toward the left. (B) Paraquat treatment produces a decrease in mitochondrial flux, which is rescued by overexpression of SOD1 or SOD2 in both directions. (C) Velocity is reduced with paraquat treatment, and this is rescued by SOD1 or SOD2 overexpression in both directions. (D) Paraquat treatment shows a small reduction in retrograde duty cycle with an increase of pause time and a decrease of moving time; overexpression of SOD1 shows a small increase of pause time. (E) Retrograde run length is modestly reduced with paraquat treatment. (F) Paraquat treatment shows an increase of the percentage of stationary mitochondria, which is rescued by SOD overexpression. The percentage of anterograde moving mitochondria increases with SOD2 overexpression. (G) Mitochondrial density is comparable to control with paraquat treatment or SOD overexpression. The number of larvae analyzed is shown on the bars. Error bars indicate mean ± SEM. Significance is determined by one-way ANOVA with Bonferroni’s post-test. *p<0.05, **p < 0.01, and ***p < 0.001.
Fig 2
Fig 2. DCV transport is nearly unaffected by ROS treatment.
(A) Representative kymographs of DCV transport in vivo. Anterograde transport is toward the right; retrograde transport is toward the left. Parameters in DCV transport with paraquat treatment including (B) velocity, (C) duty cycle, (D) run length, and (E) density are all comparable to controls. The number of larvae analyzed is shown on the bars. Error bars indicate mean ± SEM. Significance is determined by Student’s t-test.
Fig 3
Fig 3. The percentage of moving mitochondria is reduced in response to ROS and rescued by SOD overexpression in vitro.
(A) Representative kymographs of mitochondrial transport under H2O2 treatment. Anterograde transport is toward the right; retrograde transport is toward the left. (B) The percentage of moving mitochondria is reduced with H2O2 treatment. SOD1 or SOD2 overexpression can rescue the defect. The number of cells analyzed is shown on the bars. Error bars indicate mean ± SEM. Significance is determined by one-way ANOVA with Bonferroni’s post-test. *p<0.05 and ***p < 0.001.
Fig 4
Fig 4. ROS-induced defects in mitochondrial transport are mediated by Ca2+ levels.
(A) Representative Ca2+ imaging with H2O2, thapsgargin, or ionomycin treatment is measured by the intensity of GCaMP6 indicator. Scale bars indicate 10 μm. (B) Quantitative results from (A). H2O2 or thapsgargin treatment produces an increase of Ca2+ levels of similar extent. Ionomycin treatment produces a large increase compared to controls. (C) Representative kymographs of axonal transport of mitochondria or DCVs before and after ionomycin treatment in the same cell. Anterograde transport is toward the right; retrograde transport is toward the left. (D) The percentage of moving mitochondria is dramatically reduced by ionomycin treatment. (E) Velocity of DCV transport is not affected by ionomycin. (F) Representative kymographs of axonal transport of mitochondria or DCVs before and after thapsigargin treatment in the same cell. (G) The percentage of moving mitochondria is reduced by thapsigargin treatment, but the effect is not as large as ionomycin treatment. (H) Velocity of DCV transport is not affected by thapsigargin. (I) Representative Ca2+ imaging with H2O2 or EGTA treatment is measured by the intensity of GCaMP6 indicator. Scale bars indicate 10 μm. (J) Quantitative results from (I). Elevated Ca2+ levels induced by H2O2 are rescued by EGTA treatment. EGTA alone does not affect intracellular Ca2+ levels. (K) Representative kymographs of mitochondrial transport under H2O2 or EGTA treatment. Anterograde transport is toward the right; retrograde transport is toward the left. (L) The reduced percentage of moving mitochondria by H2O2 is partially rescued by EGTA. EGTA alone does not affect mitochondrial transport. The number of cells analyzed is shown on the bars. Error bars indicate mean ± SEM. Significance is determined by one-way ANOVA with Bonferroni’s post-test (B, J, L) or paired Student’s t-test (D, E, G, H). *p<0.05, **p < 0.01, and ***p < 0.001.
Fig 5
Fig 5. Ca2+ homeostasis is required for normal mitochondrial transport.
(A) Representative Ca2+ imaging with H2O2 or EGTA/BAPTA treatment is measured by the intensity of GCaMP6 indicator. Scale bars indicate 10 μm. (B) Quantitative results from (A). Ca2+ levels are increased by H2O2 but reduced with EGTA/BAPTA treatment. (C) Representative kymographs of mitochondrial transport with H2O2 or EGTA/BAPTA treatment. Anterograde transport is toward the right; retrograde transport is toward the left. (D) EGTA/BAPTA treatment produces a decrease of mitochondrial transport. The reduced percentage of moving mitochondria by H2O2 is further reduced by EGTA/BAPTA treatment. The number of cells analyzed is shown on the bars. Significance is determined by one-way ANOVA with Bonferroni’s post-test. **p < 0.01, and ***p < 0.001.
Fig 6
Fig 6. The JNK pathway plays a role in the regulation of mitochondrial transport in vivo.
(A) Representative kymographs of mitochondrial transport with overexpression of JNK kinase (HepB2) or knockdown of JNK (Bsk RNAi) in response to paraquat. Anterograde transport is toward the right; retrograde transport is toward the left. (B) Paraquat and/or overexpression of HepB2 produce a decrease in mitochondrial flux anterogradly. Knockdown of Bsk partially rescues the effect of paraquat. Both overexpression of HepB2 and knockdown of Bsk reduce retrograde flux. (C) Anterograde velocity is reduced by paraquat or overexpression of HepB2, while retrograde velocity is reduced in both overexpression of HepB2 and knockdown of Bsk. (D) Paraquat treatment shows slightly reduction in retrograde duty cycle with a decrease of moving time; Knockdown of Bsk in response to paraquat shows a slightly increase of pause and a decrease of moving time. (E) Retrograde run length is modestly reduced by paraquat treatment. Either overexpression of HepB2 of knockdown of Bsk does not show significant difference compared to controls. (F) Paraquat treatment shows an increase of the percentage of stationary mitochondria, while neither overexpression of HepB2 nor knockdown of Bsk shows any difference. The number of larvae analyzed is shown on the bars. Error bars indicate mean ± SEM. Significance is determined by one-way ANOVA with Bonferroni’s post-test. *p<0.05, **p < 0.01, and ***p < 0.001.
Fig 7
Fig 7. Mitochondrial length, membrane potential, and transport are interrelated in response to ROS.
(A) Representative images of mitochondrial length and membrane potential. Mitochondrial lengths are measured using mitoGFP signals and mitochondrial membrane potential is measured using TMRM staining by the intensity ratio of mitochondrial fluorescence to cytosolic fluorescence. Scale bars indicate 10 μm. (B) Quantitative results of mitochondrial length. ROS treatment shows a decrease of mitochondrial length, which is rescued by SOD1 or SOD2 overexpression. (C) Quantitative results of mitochondrial membrane potential. Mitochondrial membrane potential is reduced under oxidative stress conditions. SOD1 or SOD2 overexpression does not rescue these defects. (D) Representative images of mitochondrial length measured using the mitoGFP signal. Scale bars indicate 10 μm. (E) H2O2 and/or EGTA/BAPTA reduce mitochondrial length, which is consistent with the results of mitochondrial transport (Figs 4K, 4L, 5C and 5D). The number of cells analyzed is shown on the bars. Error bars indicate mean ± SEM. Significance is determined by one-way ANOVA with Bonferroni’s post-test. *p<0.05, **p < 0.01, and ***p < 0.001.

Similar articles

Cited by

References

    1. Court FA, Coleman MP. Mitochondria as a central sensor for axonal degenerative stimuli. Trends Neurosci. 2012;35(6):364–72. 10.1016/j.tins.2012.04.001 . - DOI - PubMed
    1. Brookes PS, Yoon Y, Robotham JL, Anders MW, Sheu SS. Calcium, ATP, and ROS: a mitochondrial love-hate triangle. Am J Physiol Cell Physiol. 2004;287(4):C817–33. 10.1152/ajpcell.00139.2004 . - DOI - PubMed
    1. Nayernia Z, Jaquet V, Krause KH. New insights on NOX enzymes in the central nervous system. Antioxid Redox Signal. 2014;20(17):2815–37. 10.1089/ars.2013.5703 ; - DOI - PMC - PubMed
    1. Lambeth JD, Neish AS. Nox enzymes and new thinking on reactive oxygen: a double-edged sword revisited. Annu Rev Pathol. 2014;9:119–45. 10.1146/annurev-pathol-012513-104651 . - DOI - PubMed
    1. D'Autréaux B, Toledano MB. ROS as signalling molecules: mechanisms that generate specificity in ROS homeostasis. Nat Rev Mol Cell Biol. 2007;8(10):813–24. 10.1038/nrm2256 . - DOI - PubMed

MeSH terms

LinkOut - more resources