. 2017 May 18;12(5):e0177740.
doi: 10.1371/journal.pone.0177740. eCollection 2017.

Fast exploration of an optimal path on the multidimensional free energy surface

Affiliations

Fast exploration of an optimal path on the multidimensional free energy surface

Changjun Chen. PLoS One. .

Abstract

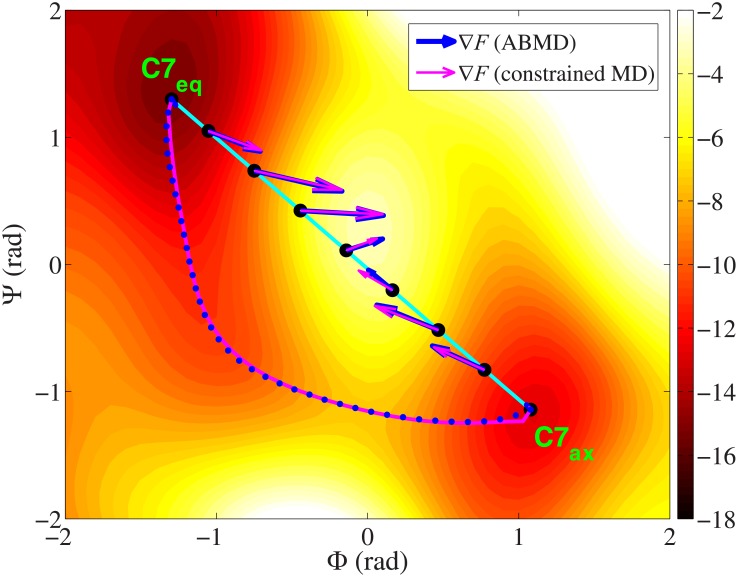
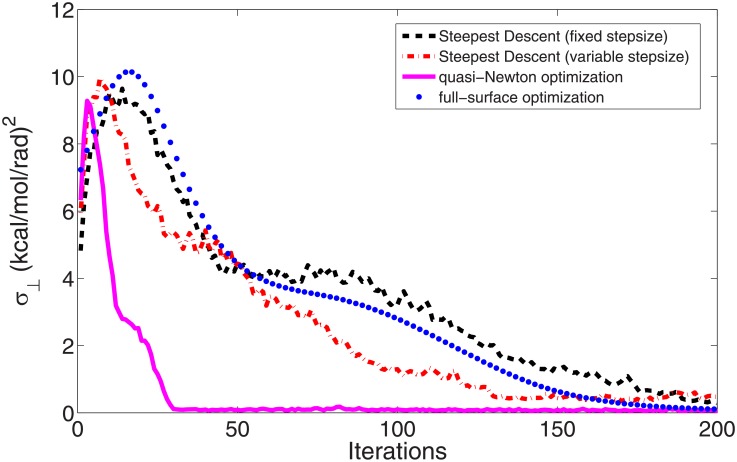
In a reaction, determination of an optimal path with a high reaction rate (or a low free energy barrier) is important for the study of the reaction mechanism. This is a complicated problem that involves lots of degrees of freedom. For simple models, one can build an initial path in the collective variable space by the interpolation method first and then update the whole path constantly in the optimization. However, such interpolation method could be risky in the high dimensional space for large molecules. On the path, steric clashes between neighboring atoms could cause extremely high energy barriers and thus fail the optimization. Moreover, performing simulations for all the snapshots on the path is also time-consuming. In this paper, we build and optimize the path by a growing method on the free energy surface. The method grows a path from the reactant and extends its length in the collective variable space step by step. The growing direction is determined by both the free energy gradient at the end of the path and the direction vector pointing at the product. With fewer snapshots on the path, this strategy can let the path avoid the high energy states in the growing process and save the precious simulation time at each iteration step. Applications show that the presented method is efficient enough to produce optimal paths on either the two-dimensional or the twelve-dimensional free energy surfaces of different small molecules.


Conflict of interest statement

Competing Interests: The authors have declared that no competing interests exist.

Figures

Fig 1
Fig 1. Different optimized paths of the ALA dipeptide between the reactant (C7eq) and the product (C7ax) in the two-dimensional collective variable space.
The green dashed lines from up to down are the paths at 0, 50, 100 and 200 iterations by the interpolation method. The yellow solid line is the path generated by the growing method in this work. The unit of the free energy surface is kcal/mol.
Fig 2
Fig 2
(a) Free energy profiles of ALA dipeptide on the optimized paths by the interpolation method at 0, 50, 100 and 200 iterations (black dashed lines from up to down) and the final growth path by the growing method (blue solid line). (b) The changes of the average free energy gradients perpendicular to the tangent of the path (σ in Eq 8) in the two optimizations.
Fig 3
Fig 3
(a) Average perpendicular free energy gradients of the paths (σ in Eq 8) with different number of snapshots (from 20 to 40). The data in the optimization by the interpolation method are represented by the black squares and the data of the growing method are represented by the blue triangles. Note that the per-snapshot simulation time and the total simulation time are set to be the same for each path in the two optimizations (shown in (b)).
Fig 4
Fig 4. Two components of the free energy gradient of ALA dipeptide (blue solid lines) and 10-ALA dipeptide (black dashed lines) along the straight path from the reactant to the product.
(a) The first term of the free energy gradient. (b) The second term of the free energy gradient.
Fig 5
Fig 5. Selected free energy gradients of ALA dipeptide on a straight path.
Blue arrows are the gradients ∇F from one prepared complete free energy surface in a 500 ns ABMD simulation [–58] (multiplied by 0.06). Magenta arrows are the gradients ∇F from a few independent constrained simulations [18, 19] (multiplied by 0.06). The blue dotted curve and the magenta solid curve are the final optimized paths by the two kinds of free energy gradients, respectively. The unit of the free energy surface is kcal/mol. See the details on the optimizations in the main text.
Fig 6
Fig 6. The changes of the average perpendicular free energy gradients (σ in Eq 8) in four different optimizations for ALA dipeptide from the straight path.
The black dashed line is the data in the optimization by the steepest descent method with a fixed step size. The red dash-dotted line is the data of the steepest descent method with a variable step size. The magenta solid line is the data by the quasi-Newton method with L-BFGS formula [6, 7]. The blue dotted line is the data of the optimization on a prepared complete free energy surface from a ABMD simulation [–58]. The shapes of the final optimized paths in the last two optimizations are plotted as the magenta solid curve and the blue dotted curve in Fig 5, respectively.
Fig 7
Fig 7. Projection of different paths of 10-ALA peptide from the reactant (π-helix, at the upper left) to the product (α-helix, at the bottom right) in a reduced two-dimensional space.
The blue dash-dotted line, red dotted line and magenta dashed line represent the interpolated path, the growth path and the optimized path, respectively. The two collective variables, nHBα and nHBπ, are the effective numbers of the hydrogen bonds in the standard α-helix (i+4→i) and the standard π-helix (i+5→i) (Eq 11). The colors in the figure show the free energy profiles on the paths in the optimization from the interpolated path (unit: kcal/mol). Note that all the paths are originally defined and optimized in a 12-dimensional collective variable space.
Fig 8
Fig 8
(a) Free energy profiles of 10-ALA peptide in the optimization from the interpolated path at 0, 100, 200 and 600 iterations (black dashed lines from up to down). And the free energy profiles of the paths optimized from the growth path at 0, 100, 200, and 600 iterations (blue solid lines from up to down). (b) The changes of the average free energy gradients perpendicular to the tangent of the path (σ in Eq 8) in the two optimizations.

Similar articles

References

    1. Hu H, Lu Z, Yang W. QM/MM Minimum Free Energy Path: Methodology and Application to Triosephosphate Isomerase. J Chem Theory Comput. 2007;3:390–406. 10.1021/ct600240y - DOI - PMC - PubMed
    1. Del Campo JM, Koster AM. A hierarchical transition state search algorithm. J Chem Phys. 2008;129:024107 10.1063/1.2950083 - DOI - PubMed
    1. Ulitsky A, Elber R. A new technique to calculate steepest descent paths in flexible polyatomic systems. J Chem Phys. 1990;92:1510–1.
    1. Tyka MD, Clarke AR, Sessions RB. An Efficient, Path-Independent Method for Free-Energy Calculations. J Phys Chem B. 2006;110:17212–20. 10.1021/jp060734j - DOI - PubMed
    1. Chen C, Xiao Y. Accurate free energy calculation along optimized paths. J Comput Chem. 2010;31:1368–75. 10.1002/jcc.21420 - DOI - PubMed

LinkOut - more resources