

Simulating within-vector generation of the malaria parasite diversity
- PMID: 28542484
- PMCID: PMC5440164
- DOI: 10.1371/journal.pone.0177941
Simulating within-vector generation of the malaria parasite diversity
Abstract
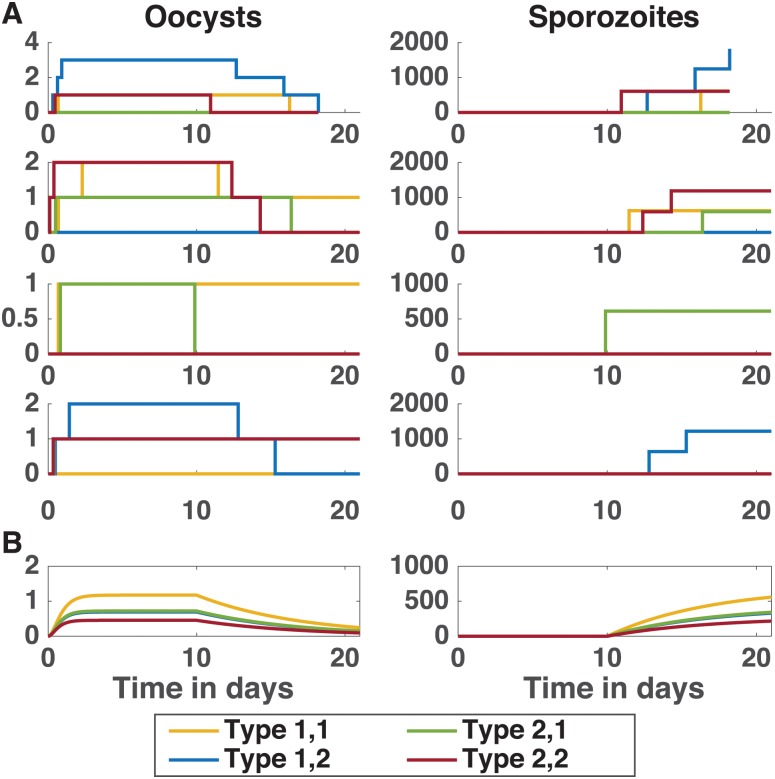
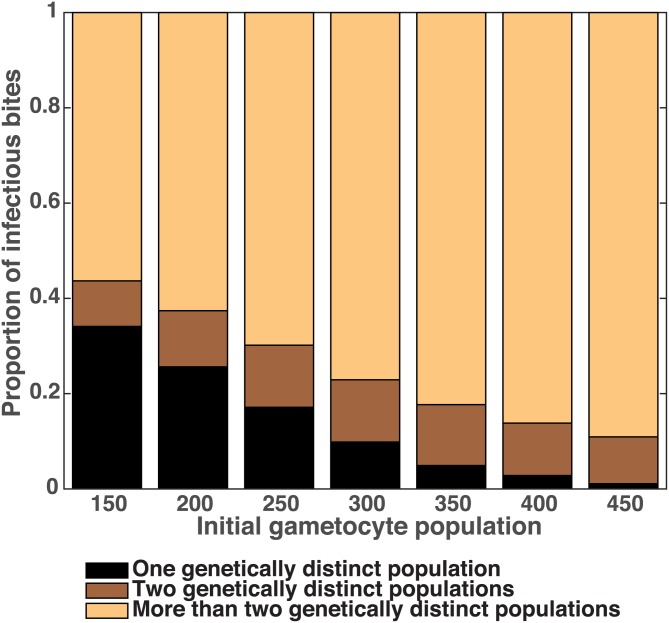
Plasmodium falciparum, the most virulent human malaria parasite, undergoes asexual reproduction within the human host, but reproduces sexually within its vector host, the Anopheles mosquito. Consequently, the mosquito stage of the parasite life cycle provides an opportunity to create genetically novel parasites in multiply-infected mosquitoes, potentially increasing parasite population diversity. Despite the important implications for disease transmission and malaria control, a quantitative mapping of how parasite diversity entering a mosquito relates to diversity of the parasite exiting, has not been undertaken. To examine the role that vector biology plays in modulating parasite diversity, we develop a two-part model framework that estimates the diversity as a consequence of different bottlenecks and expansion events occurring during the vector-stage of the parasite life cycle. For the underlying framework, we develop the first stochastic model of within-vector P. falciparum parasite dynamics and go on to simulate the dynamics of two parasite subpopulations, emulating multiply infected mosquitoes. We show that incorporating stochasticity is essential to capture the extensive variation in parasite dynamics, particularly in the presence of multiple parasites. In particular, unlike deterministic models, which always predict the most fit parasites to produce the most sporozoites, we find that occasionally only parasites with lower fitness survive to the sporozoite stage. This has important implications for onward transmission. The second part of our framework includes a model of sequence diversity generation resulting from recombination and reassortment between parasites within a mosquito. Our two-part model framework shows that bottlenecks entering the oocyst stage decrease parasite diversity from what is present in the initial gametocyte population in a mosquito's blood meal. However, diversity increases with the possibility for recombination and proliferation in the formation of sporozoites. Furthermore, when we begin with two parasite subpopulations in the initial gametocyte population, the probability of transmitting more than two unique parasites from mosquito to human is over 50% for a wide range of initial gametocyte densities.
Conflict of interest statement
Figures


Similar articles
-
A randomized feasibility trial comparing four antimalarial drug regimens to induce Plasmodium falciparum gametocytemia in the controlled human malaria infection model.Elife. 2018 Feb 27;7:e31549. doi: 10.7554/eLife.31549. Elife. 2018. PMID: 29482720 Free PMC article. Clinical Trial.
-
Population dynamics of sporogony for Plasmodium vivax parasites from western Thailand developing within three species of colonized Anopheles mosquitoes.Malar J. 2006 Aug 3;5:68. doi: 10.1186/1475-2875-5-68. Malar J. 2006. PMID: 16887043 Free PMC article.
-
Plasmodium falciparum mating patterns and mosquito infectivity of natural isolates of gametocytes.PLoS One. 2015 Apr 14;10(4):e0123777. doi: 10.1371/journal.pone.0123777. eCollection 2015. PLoS One. 2015. PMID: 25875840 Free PMC article.
-
Malaria parasite development in mosquitoes.Annu Rev Entomol. 1998;43:519-43. doi: 10.1146/annurev.ento.43.1.519. Annu Rev Entomol. 1998. PMID: 9444756 Review.
-
When Is a Plasmodium-Infected Mosquito an Infectious Mosquito?Trends Parasitol. 2020 Aug;36(8):705-716. doi: 10.1016/j.pt.2020.05.011. Epub 2020 Jul 1. Trends Parasitol. 2020. PMID: 32620501 Free PMC article. Review.
Cited by
-
Declines in prevalence alter the optimal level of sexual investment for the malaria parasite Plasmodium falciparum.Proc Natl Acad Sci U S A. 2022 Jul 26;119(30):e2122165119. doi: 10.1073/pnas.2122165119. Epub 2022 Jul 22. Proc Natl Acad Sci U S A. 2022. PMID: 35867831 Free PMC article.
-
Plasmodium falciparum msp-1 and msp-2 genetic diversity and multiplicity of infection in isolates from Congolese patients in the Republic of Congo.Parasitol Res. 2023 Oct;122(10):2433-2443. doi: 10.1007/s00436-023-07951-y. Epub 2023 Aug 25. Parasitol Res. 2023. PMID: 37624380
-
Estimating the extrinsic incubation period of malaria using a mechanistic model of sporogony.PLoS Comput Biol. 2021 Feb 16;17(2):e1008658. doi: 10.1371/journal.pcbi.1008658. eCollection 2021 Feb. PLoS Comput Biol. 2021. PMID: 33591963 Free PMC article.
-
Modeling cellular co-infection and reassortment of bluetongue virus in Culicoides midges.Virus Evol. 2022 Sep 30;8(2):veac094. doi: 10.1093/ve/veac094. eCollection 2022. Virus Evol. 2022. PMID: 36381232 Free PMC article.
-
Mathematical modeling of climate change and malaria transmission dynamics: a historical review.J Math Biol. 2018 Oct;77(4):857-933. doi: 10.1007/s00285-018-1229-7. Epub 2018 Apr 24. J Math Biol. 2018. PMID: 29691632 Review.
References
-
- WHO. World malaria report 2013. World Health Organization; 2014.
-
- Ross R. The prevention of malaria. London: Murray; 1911.
MeSH terms
Grants and funding
LinkOut - more resources
Full Text Sources
Other Literature Sources
