. 2017 May 25;12(5):e0178058.
doi: 10.1371/journal.pone.0178058. eCollection 2017.

Regeneration of myelin sheaths of normal length and thickness in the zebrafish CNS correlates with growth of axons in caliber

Affiliations

Regeneration of myelin sheaths of normal length and thickness in the zebrafish CNS correlates with growth of axons in caliber

Marja J Karttunen et al. PLoS One. .

Abstract

Demyelination is observed in numerous diseases of the central nervous system, including multiple sclerosis (MS). However, the endogenous regenerative process of remyelination can replace myelin lost in disease, and in various animal models. Unfortunately, the process of remyelination often fails, particularly with ageing. Even when remyelination occurs, it is characterised by the regeneration of myelin sheaths that are abnormally thin and short. This imperfect remyelination is likely to have implications for the restoration of normal circuit function and possibly the optimal metabolic support of axons. Here we describe a larval zebrafish model of demyelination and remyelination. We employ a drug-inducible cell ablation system with which we can consistently ablate 2/3rds of oligodendrocytes in the larval zebrafish spinal cord. This leads to a concomitant demyelination of 2/3rds of axons in the spinal cord, and an innate immune response over the same time period. We find restoration of the normal number of oligodendrocytes and robust remyelination approximately two weeks after induction of cell ablation, whereby myelinated axon number is restored to control levels. Remarkably, we find that myelin sheaths of normal length and thickness are regenerated during this time. Interestingly, we find that axons grow significantly in caliber during this period of remyelination. This suggests the possibility that the active growth of axons may stimulate the regeneration of myelin sheaths of normal dimensions.


Conflict of interest statement

Competing Interests: The authors have declared that no competing interests exist.

Figures

Fig 1
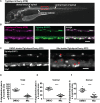
Fig 1. Oligodendrocyte ablation using the Tg(mbp:mCherry-NTR) model.
A. Top panel: brightfield image of a Tg(mbp:mCherry-NTR) larva at 5dpf. Bottom panel: fluorescent mage showing the expression of the mbp:mCherry-NTR transgene in the larva. The dorsal and ventral tracts of the spinal cord and the posterior lateral line are indicated. The red box outlines the region that is shown in higher magnification in B (in another animal). B. Lateral views of the spinal cord of double transgenic Tg(mbp:mCherry-NTR);Tg(mbp:EGFP) larvae at 7dpf, showing complete overlap of the mCherry and GFP channels. Scale bar: 20μm.C. Oligodendrocyte ablation in Tg(mbp:mCherry-NTR) animals following two-day treatment with Mtz. Red arrowheads indicate unaffected oligodendrocytes and red asterisks indicate vacuolated structures. Scale bar: 20μm.D-F. Quantification of oligodendrocyte numbers from a four-somite stretch of the spinal cord in the entire region (D) ventral (E) and dorsal (F) tracts of DMSO and Mtz-treated larvae at 7dpf (immediately following treatment). Overall oligodendrocyte number (dorsal and ventral combined), controls: 85.71 ± 2.1 vs treated: 27.48 ± 2.1 (68% reduction, p < 0.0001). n = 21. In the ventral tract, controls: 51.57 ± 1.3 vs treated: 16.57 ± 1.3 (68% reduction, p < 0.0001). In the dorsal tract, mean in controls: 34.14 ±1.3 vs treated: 10.9 ± 1.2 (68% reduction, p < 0.0001).
Fig 2
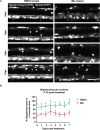
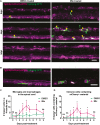
Fig 2. Oligodendrocyte numbers remain low in Mtz-treated Tg(mbp:mCherry-NTR) larvae for 7 days following treatment.
A. Representative images from the spinal cords of DMSO- and Mtz-treated Tg(mbp:mCherry-NTR) larvae at the time points indicated; GFP channel is shown. B. Quantification of oligodendrocyte numbers from a four-somite stretch of the spinal cord. At 0dpt, mean number of oligodendrocytes in controls: 69.94 ± 11.64 vs treated: 26.76 ± 7.20, p < 0.0001. At 1dpt, controls: 71.43 ± 12.09 vs treated: 37.75 ± 5.34, p < 0.0001. At 2pt, controls: 75.29 ± 6.16 vs treated: 37.22 ± 12.28, p < 0.0001. At 3dpt, controls: 79.29 ± 13.71 vs treated: 50.13 ± 15.78, p < 0.0001. At 4dpt, controls: 76.08 ± 8.92 vs treated: 42.95, p < 0.0001. At 5dpt, controls: 81.92 vs treated: 35.60 ± 10.88, p < 0.0001. At 6dpt, controls: 77.78 ± 10.54 vs treated: 35.64 ± in 11.3, p < 0.0001. At 7dpt, controls: 92.15 ± 9.76 vs treated: 44.25 ± 11.57, p < 0.0001. Statistical significances were determined by multiple t tests per row, without assuming equal standard deviations (Holm-Sidak method). n = no less than 7. Scale bar: 20μm.
Fig 3
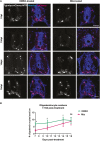
Fig 3. Oligodendrocyte numbers are restored to control levels by 16 days post-treatment.
A. Representative images of transversely cut cryosections of spinal cords stained with Hoechst and showing endogenous expression of the mbp:mCherry-NTR transgene. Time points from 7d post-treatment to 16d post-treatment are shown, as indicated. Yellow arrowheads point to examples of double positive cells that were counted as oligodendrocytes.B. Quantification of oligodendrocyte numbers per section. At 7dpt, mean in controls: 6.9 ± 0.44 vs treated: 2.4 ± 0.23 in Mtz-treated sections, p < 0.0001. At 10dpt, controls: 7.6 ± 0.75 vs treated: 4.04 ±0.47, p = 0.0012. At 14dpt, controls: 9.88 ± 0.6 vs treated: 7.3 ± 0.67, p = 0.0095. At 16dpt, controls: 9.46 ± 2.21 vs treated: 8.57 ± 2.58, p = 0.260. All significances were obtained using multiple t tests per row (Holm-Sidak method). n = no less than 5. Scale bars: 20μm.
Fig 4
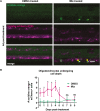
Fig 4. Acridine orange staining reveals oligodendrocytes undergoing cell death following treatment with Mtz.
A. Representative images of spinal cords of DMSO- or Mtz-treated Tg(mbp:mCherry-NTR) larvae at 4dpt. Acridine orange labels cells undergoing cell death in green. In Mtz-treated animals several bright green puncta can be seen, and these colocalise with mCherry (yellow arrowheads). B. Quantification of cells that are positive for both mCherry and acridine orange, per four-somite stretch of spinal cord. At 0dpt, control mean: 0.56 ± 1.01 vs treated: 3.88 ± 1.25, p < 0.0001. The number of AO+ cells peaks at 4dpt, when the mean in controls was: 0.4 ± 0.89, vs treated: 6.5 ± 1.69, p < 0.0001. This then reduced so that at 7dpt, controls: 1.25 ± 1.16 vs treated: 0.86 ± 1.07, p = 0.510. All significances were obtained using multiple t tests per row (Holm-Sidak method). n = no less than 8. Scale bar: 20μm.
Fig 5
Fig 5. Macrophage and microglia response to oligodendrocyte ablation.
A. Representative images of spinal cords of DMSO- or Mtz-treated Tg(mbp:mCherry-NTR) larvae, Green cells are mpeg-expressing microglia and macrophages. Yellow arrowheads indicate examples of mpeg+ cells in contact with the spinal cord. B. Single z-plane images from DMSO- or Mtz-treated Tg(mbp:mCherry-NTR) larvae, Green cells are mpeg-expressing microglia and macrophages and can be seen to surround mCherry positive structures in Mtz-treated animals. C. Quantification of mpeg+ cells in contact with the spinal cord (from a four-somite stretch of the spinal cord) At 0dpt, mean in controls: 2.0 ± 1.73 vs treated: 2.0 ± 2.26, p > 0.9999. At 1dpt, controls: 2.0 ± 1.71 vs treated: 1.31 ± 1.3, p = 0.237. At 2dpt, controls: 2.33 ± 2.02 vs treated: 4.14 ± 1.75, p = 0.022. At 3dpt, controls: 1.79 ± 2.39 vs treated: 8.2 ± 3.68, p < 0.0001). At 4dpt (controls: 3.17 ± 2.22 vs treated: 10.92 ± 4.01, p = 0.00040). At 5dpt, controls: 2.23 ± 1.24 vs treated: 7.84 ± 2.38, p < 0.0001. At 7dpt, controls: 3.69 ± 1.70 vs treated: 7.94 ± 3.42, p = 0.0003. At 9dpt, there is no significant difference between control and Mtz-treated animals (controls: 3.0 ± 1.48 vs treated: 4.22 ± 2.44, p = 0.18). Statistical significance was determined using multiple t tests per row, with a Holm-Sidak method. n = no less than 9. Scale bar: 20μm. D. Quantification of mpeg mpeg+ cells containing mCherry+ material in control Mtz-treated animals.At 1dpt, controls: 0.92 ± 1.38 vs treated: 0.81 ± 1.05 in Mtz-treated animals (p = 0.822). At 2dpt, controls: 0.75 ± 1.06 vs treated: 2.79 ± 2.16 (p = 0.0066).At 3dpt: controls: 0.62 ± 0.77 vs treated: 5.0 ± 2.85 (p < 0.0001). At 4dpt: controls: 1 ± 0.89 vs treated: 9.23 ± 4.02 in Mtz-treated animals (p = 0.00014). At 5dpt: controls: 0.50 ± 0.76 vs treated: 4.39 ± 2.33 (p < 0.0001). At 7dpt: controls: 0.85 ± 0.90 vs treated: 4.75 ± 3.17 cells in Mtz-treated animals (p = 0.00018). At 9dpt: controls: 0.45 ± 0.69 cells in controls and 2.11 ± 1.96 cells in treated animals (p = 0.017). This was not deemed significant by the Holm-Sidak method. Statistical significance was determined using multiple t tests per row, with a Holm-Sidak method. n = no less than 9. Scale bar: 20μm.
Fig 6
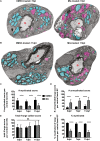
Fig 6. Oligodendrocyte ablation results in extensive demyelination of reticulospinal axons.
A-B. Representative electron micrographs of ventral hemi-spinal cords of DMSO- or Mtz-treated Tg(mbp:mCherry-NTR) larvae at 7dpt or 11dpt as indicated. Myelinated axons are shaded in turquoise and non-myelinated axons in pink. Red letters M indicate Mauthner axons. Scale bar: 1μm. C. Quantification of the number of myelinated axons per ventral hemi-spinal cord at 5, 7 and 11d following withdrawal of Mtz-treatment. At 5dpt, mean in controls: 59.25 ± 15.22 vs treated: 22.5 ± 1.29. At 7dpt, controls: 53.0 ± 10.42 vs treated: mean 21.5 ± 5.51. At 11dpt, controls: 62.75 ± 17.73 vs treated: 24.5 ± 15.46. A two-way ANOVA found a significant main effect of treatment condition (p < 0.0001) but a non-significant main effect of time point (p = 0.597) and non-significant interaction (p = 0.851). D. Quantification of the number of unmyelinated axons with a perimeter over 1μm. At 5dpt, mean in controls: 11.25 ± 6.24 vs treated: 43.75 ± 20.52. At 7dpt, mean in controls: 16.0 ± 3.46 vs treated: 56.0 ± 18.24. At 11dpt, mean in controls: 20.75 ± 9.81 vs treated: 59.25 ± 22.43. A two-way ANOVA found a significant main effect of treatment condition (p < 0.0001) but a non-significant main effect of time point (p = 0.274) and a non-significant interaction (p = 0.875). E. Quantification of the total number of axons with a perimeter over 1μm per ventral hemi-spinal cord. At 5dpt, mean in controls: 70.5 ± 20.04 vs treated: 66.25 ± 21.23. At 7dpt, controls: 69.0 ± 8.04 vs treated: 77.5 ± 23.70. At 11dpt, controls: 83.5 ± 27.06 vs treated: 83.75 ± 30.51. A two-way ANOVA found a non-significant main effect of treatment condition (p = 0.874) as well as non-significant main effect of time point (p = 0.414) and a non-significant interaction (p = 0.854). F. Quantification of the percentage of myelinated axons. At 5dpt, mean percentage of myelinated axons in controls: 80.5% ± 2.89% vs treated: 36.5% ± 10.85%. At 7dpt, controls: 76.5% ± 7.69% vs treated: 28.13 ± 1.93%. At 11dpt, controls: 75.75% ± 4.19% vs treated: 28.88% ± 10.43%. A two-way ANOVA found a significant main effect of treatment condition (p < 0.0001) but a non-significant main effect of time point (p = 0.172) and a non-significant interaction (p = 0.830). n = 4.
Fig 7
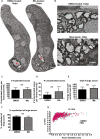
Fig 7. Remyelination occurs by 16 days post-treatment.
A. Electron micrographs of entire hemispinal cords of DMSO- or Mtz-treated Tg(mbp:mCherry-NTR) larvae). Scale bar: 3μm. B. Higher magnification electron micrographs of the ventral spinal cords. Scale bar: 1μm. C. Quantification of the numbers of myelinated axons per ventral hemi-spinal cord. Mean in controls: 80.88 ± 23.12 vs treated: 85.71 ± 22.01, p = 0.686. D. Quantification of the number of unmyelinated axons < 1μm in perimeter. Mean in controls: 10.25 ± 7.13 vs treated: 18.29 ± 12.47, p = 0.143. E. Quantification of the total number of axons with perimeter over 1μm. Mean in controls: 91.13 ± 25.39 vs treated: 104.0 ± 24.04 in Mtz-treated animals, p = 0.334. F. Quantification of the percentage of myelinated axons. Mean in controls: 88.75 ± 7.09% vs treated: 82.86 ± 9.72%, p = 0.199. n = 6 for controls, 5 for treated. Significances obtained from two-tailed Student’s t tests.G. G ratios plotted against axon diameters show that there is no difference in myelin thickness across axon sizes between control and Mtz-treated animals.
Fig 8
Fig 8. Myelin sheath numbers and lengths per oligodendrocyte are not different between control and treated animals at the remyelinated stage.
A. Representative images of single oligodendrocytes in DMSO- or Mtz-treated Tg(mbp:mCherry-NTR) fish, labelled with mbp:EGFP-CAAX. Scale bar: 20μm. B. Quantification of the mean number of sheaths per oligodendrocyte in control and Mtz-treated animals: in controls: 15.89 ± 6.39, vs treated: 19.11 ± 7.36, p = 0.143 (t test). C. Quantification of the mean length of myelin sheath per oligodendrocyte: mean in controls. Mean length of sheath per oligodendrocyte; in controls: 42.21 ± 11.64 vs treated: 37.41 ± 22.14, p = 0.400. n = 19 cells (in 16 animals) for controls, 23 cells (in 19 animals) for treated animals.
Fig 9
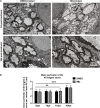
Fig 9. Remyelination coincides with growth of axon caliber between 5dpt and 16dpt.
A. Top panel: representative electron micrographs from DMSO- and Mtz-treated Tg(mbp:mCherry-NTR) larvae at 5dpt. Bottom panel: same from larvae 16dpt. Scale bar: 1μm. B. Quantification of the mean perimeter of the 40 largest axons (whether myelinated or unmyelinated) in control and treated larvae at 5, 7, 11 and 16dpt. At 5dpt, mean perimeter of the 40 largest axons in controls: 3.32 μm ± 0.60 μm and treated 3.13 μm ± 0.62 μm. At 7dpt, controls 3.30μm ± 0.39μm and treated 3.19μm ± 0.46μm. At 11dpt, controls 3.21μm ± 0.23μm and treated 3.33μm ± 0.68μm. At 16dpt, the mean perimeter of the largest 40 axons in controls was 4.34 ± 0.63 in controls and in treated, 4.25 ± 0.59. A two-way ANOVA found a significant main effect of time point (p = 0.0003) but a non-significant main effect of treatment condition (p = 0.707) and a non-significant interaction (p = 0.952).

Similar articles

Cited by

References

    1. Ettle B, Schlachetzki JCM, Winkler J. Oligodendroglia and Myelin in Neurodegenerative Diseases: More Than Just Bystanders? Mol Neurobiol. Molecular Neurobiology; 2016;: 1–17. - PMC - PubMed
    1. Ginsberg MR, Rubin RA, Falcone T, Ting AH, Natowicz MR. Brain transcriptional and epigenetic associations with autism. PLoS ONE. 2012;7: e44736 doi: 10.1371/journal.pone.0044736 - DOI - PMC - PubMed
    1. Olmos-Serrano JL, Kang HJ, Tyler WA, Silbereis JC, Cheng F, Zhu Y, et al. Down Syndrome Developmental Brain Transcriptome Reveals Defective Oligodendrocyte Differentiation and Myelination. Elsevier Ltd; 2016;: 1–16. - PMC - PubMed
    1. Nave K-A, Ehrenreich H. Myelination and oligodendrocyte functions in psychiatric diseases. JAMA Psychiatry. 2014;71: 582–584. doi: 10.1001/jamapsychiatry.2014.189 - DOI - PubMed
    1. Périer O, Grégoire A. Electron microscopic features of multiple sclerosis lesions. Brain. 1965;88: 937–952. - PubMed

MeSH terms

LinkOut - more resources