. 2017 May 24;12(5):e0178250.
doi: 10.1371/journal.pone.0178250. eCollection 2017.

Robustness analysis of the detailed kinetic model of an ErbB signaling network by using dynamic sensitivity

Affiliations

Robustness analysis of the detailed kinetic model of an ErbB signaling network by using dynamic sensitivity

Hiroyuki Masunaga et al. PLoS One. .

Abstract

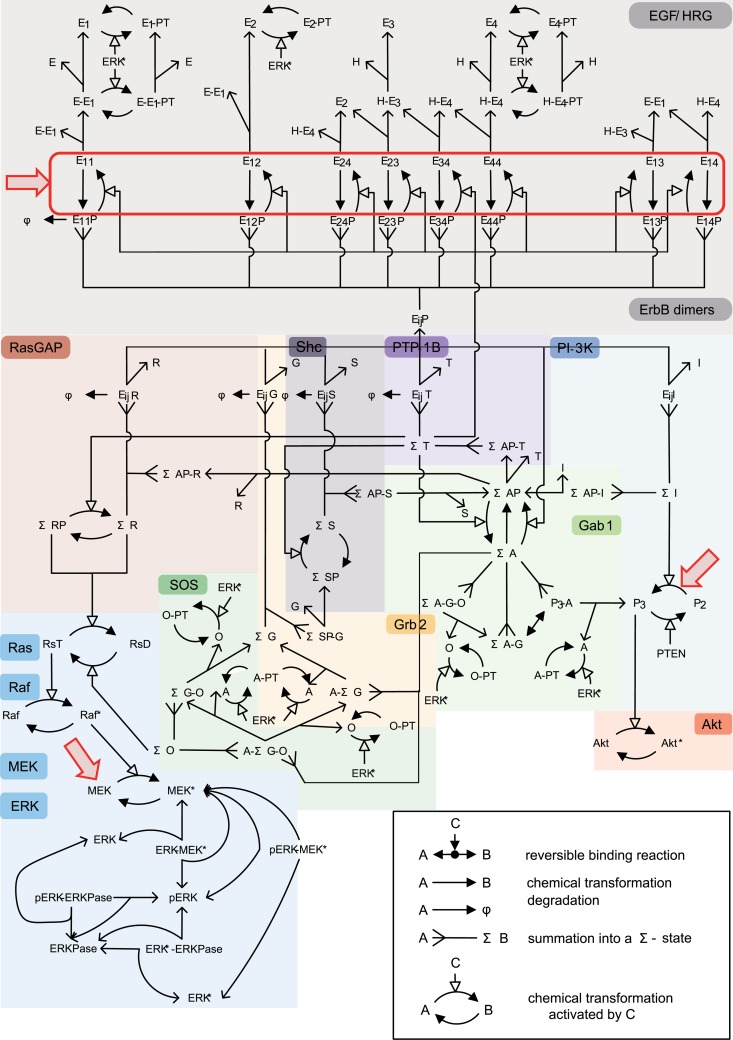
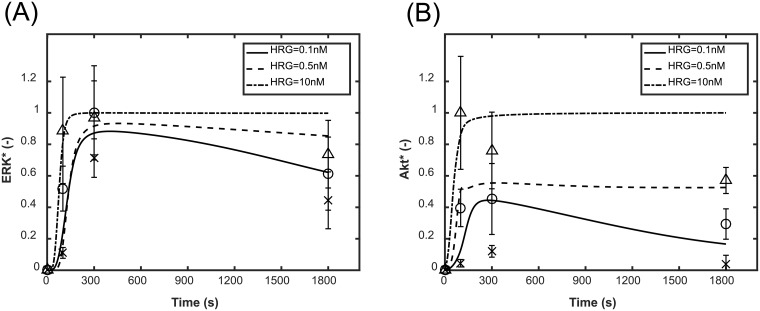
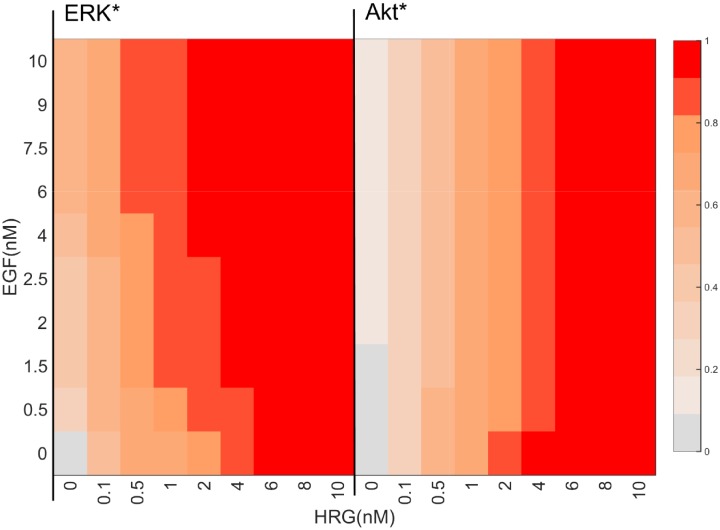
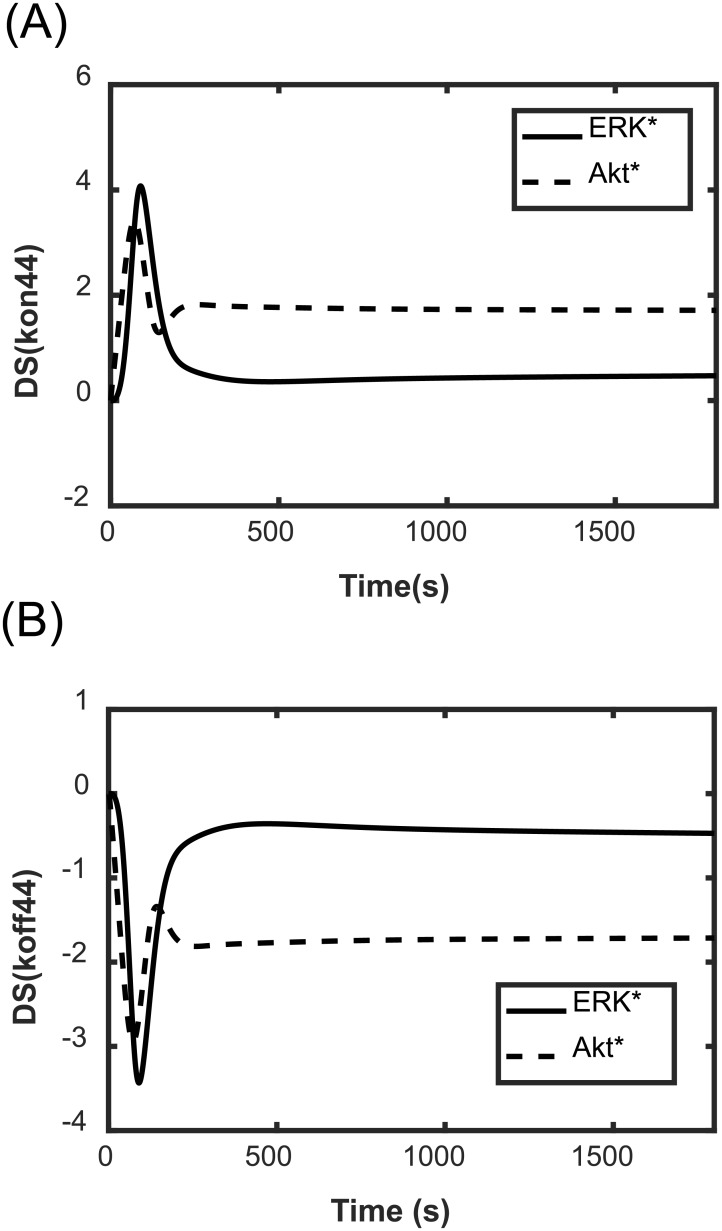
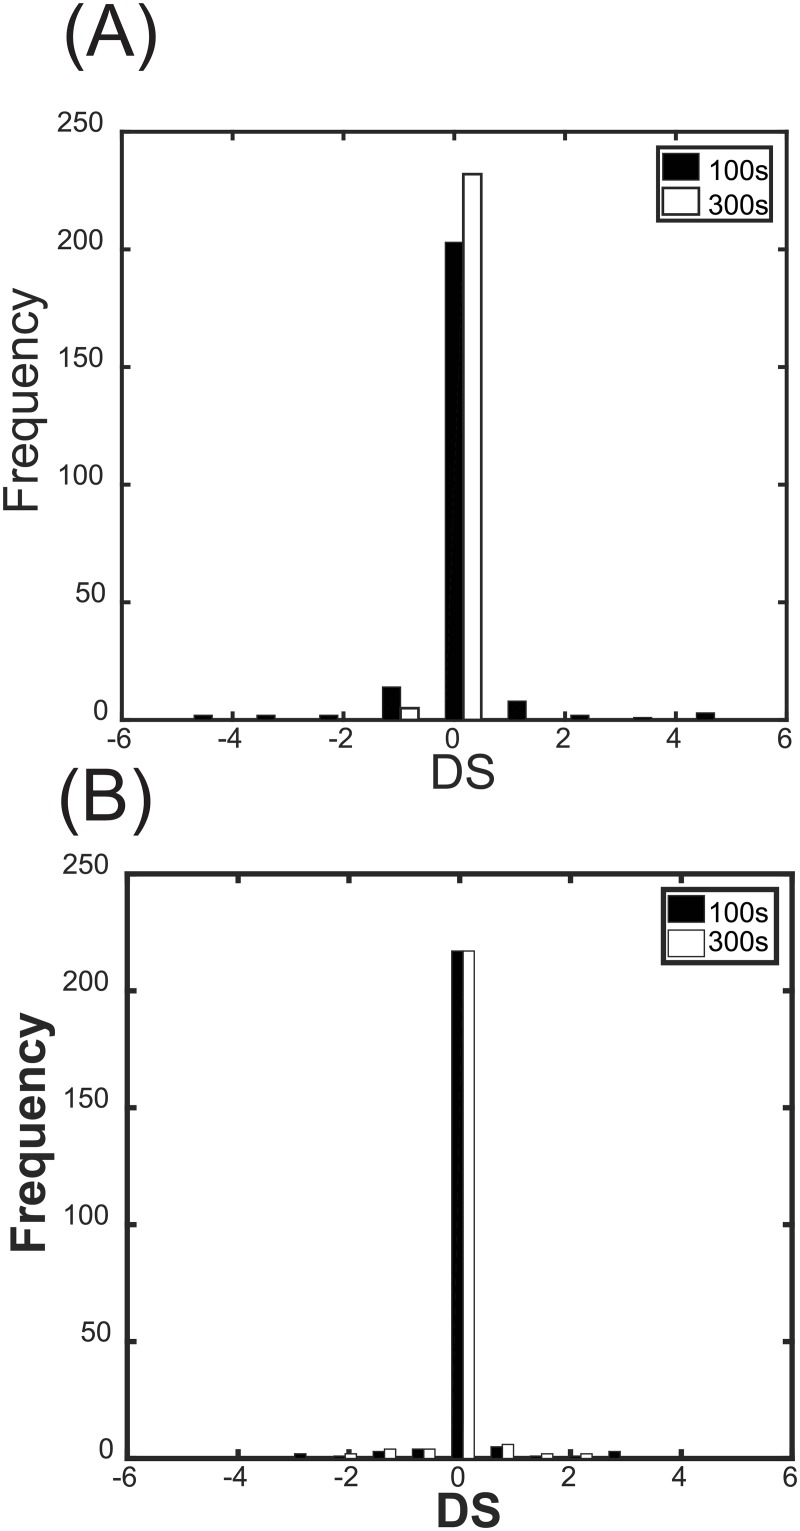
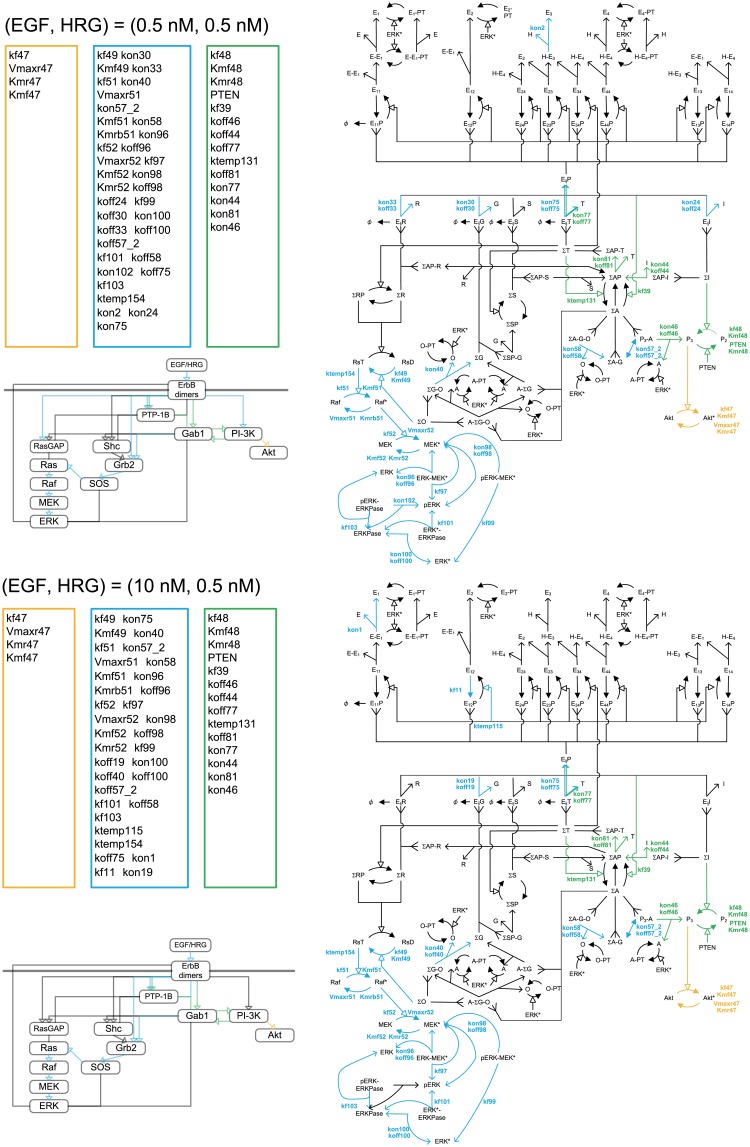
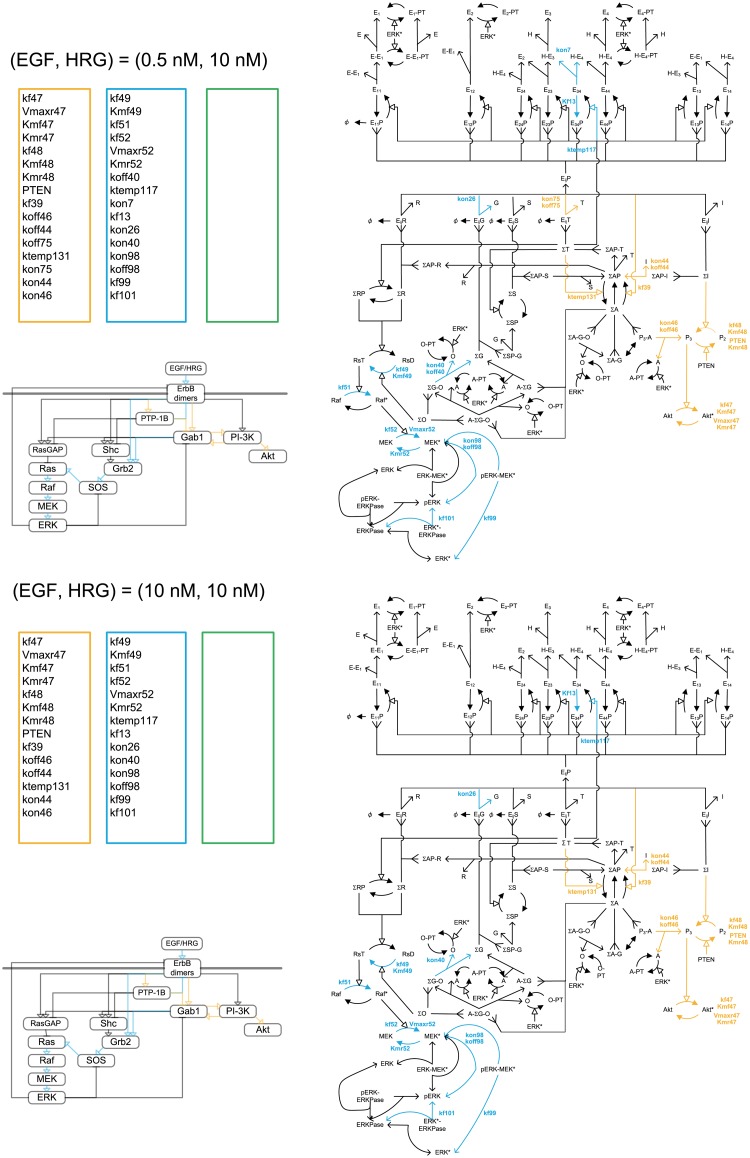
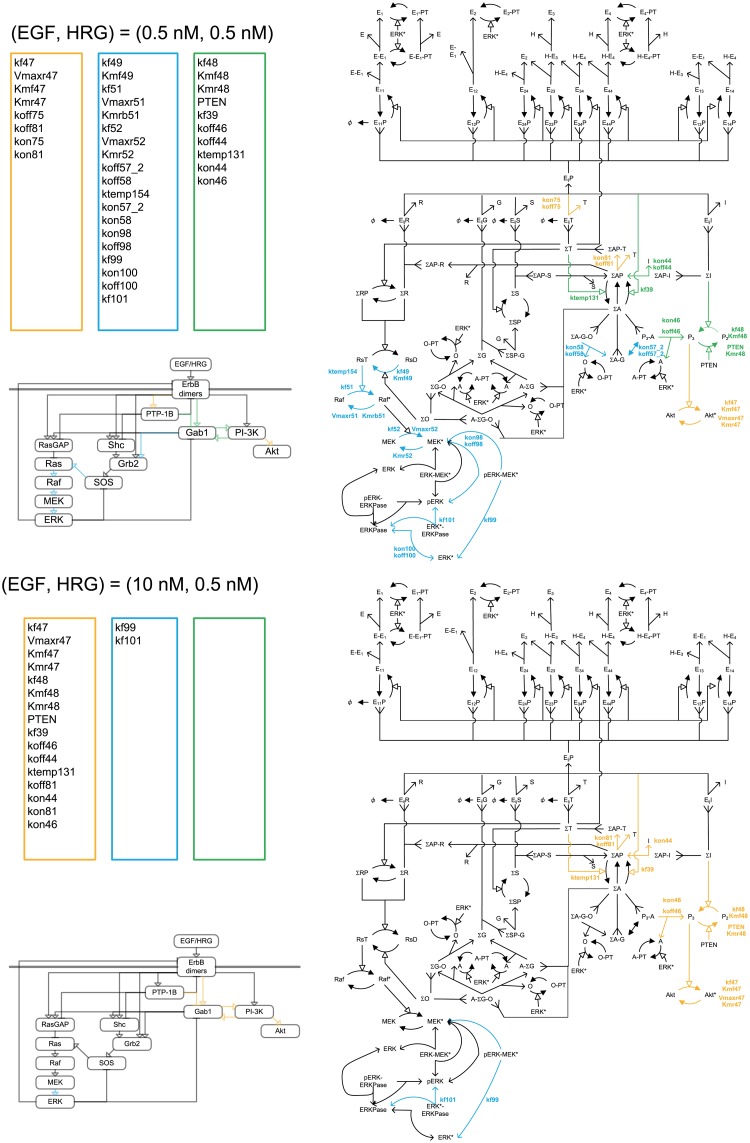
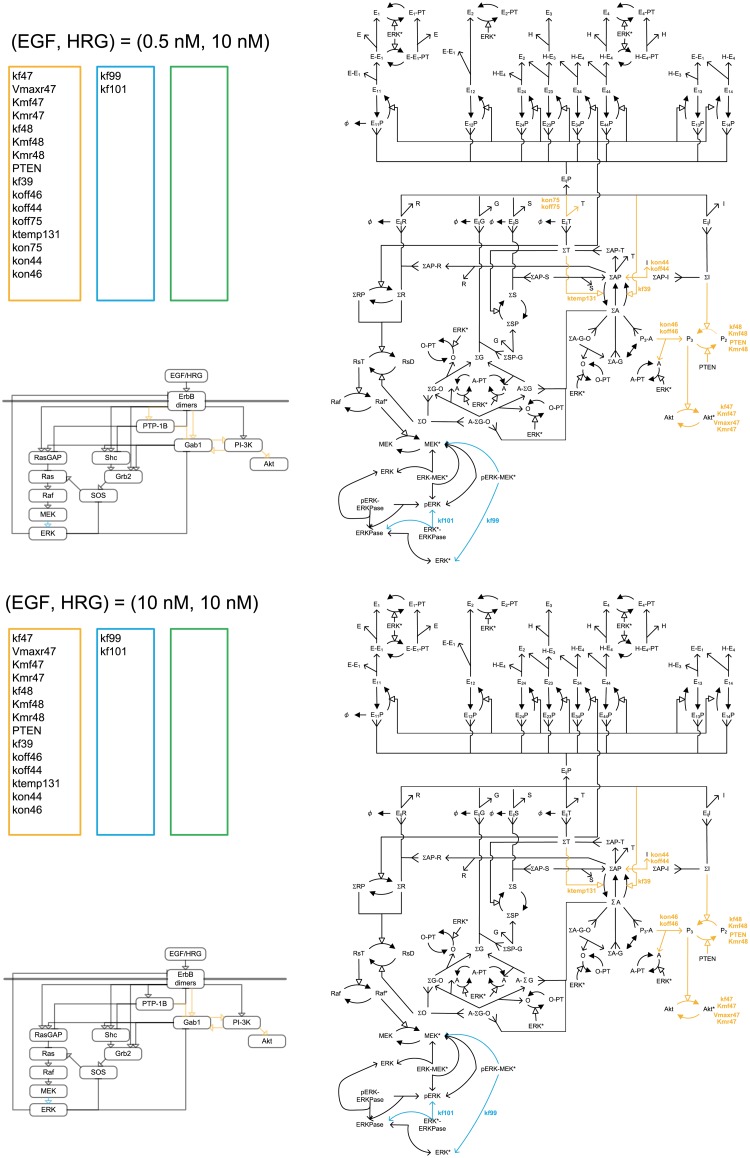
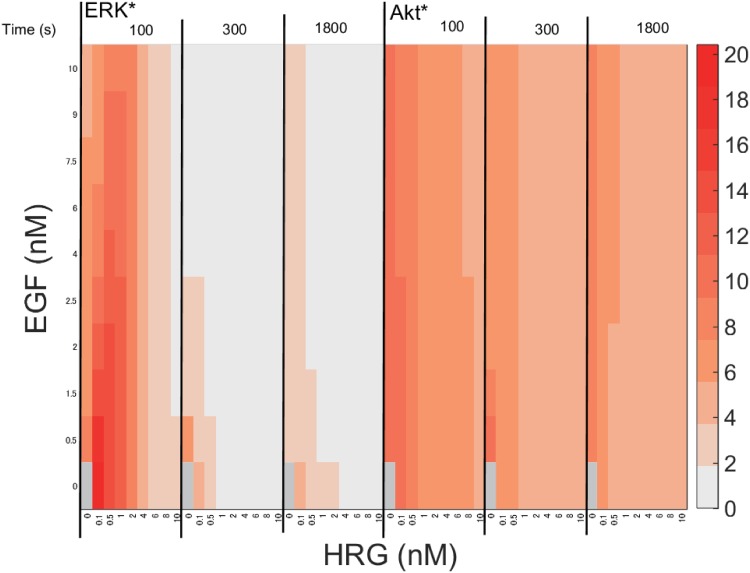
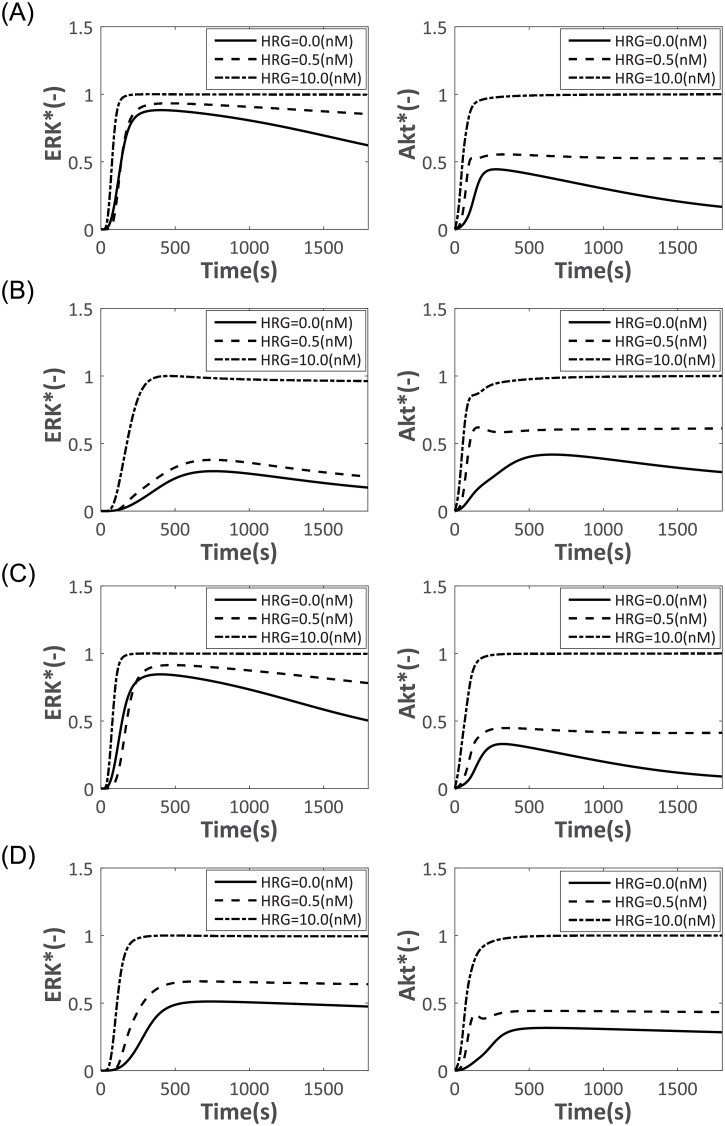
The ErbB receptor signaling pathway plays an important role in the regulation of cellular proliferation, survival and differentiation, and dysregulation of the pathway is linked to various types of human cancer. Mathematical models have been developed as a practical complementary approach to deciphering the complexity of ErbB receptor signaling and elucidating how the pathways discriminate between ligands to induce different cell fates. In this study, we developed a simulator to accurately calculate the dynamic sensitivity of extracellular-signal-regulated kinase (ERK) activity (ERK*) and Akt activity (Akt*), downstream of the ErbB receptors stimulated with epidermal growth factor (EGF) and heregulin (HRG). To demonstrate the feasibility of this simulator, we estimated how the reactions critically responsible for ERK* and Akt* change with time and in response to different doses of EGF and HRG, and predicted that only a small number of reactions determine ERK* and Akt*. ERK* increased steeply with increasing HRG dose until saturation, while showing a gently rising response to EGF. Akt* had a gradual wide-range response to HRG and a blunt response to EGF. Akt* was sensitive to perturbations of intracellular kinetics, while ERK* was more robust due to multiple, negative feedback loops. Overall, the simulator predicted reactions that were critically responsible for ERK* and Akt* in response to the dose of EGF and HRG, illustrated the response characteristics of ERK* and Akt*, and estimated mechanisms for generating robustness in the ErbB signaling network.


Conflict of interest statement

Competing Interests: The authors have declared that no competing interests exist.

Figures

Fig 1
Fig 1. The MCF7 ErbB signaling network map.
Σ-states are summations over specific membrane-localized species with identical downstream signaling activity and membrane-anchorage. ΣA:P3-A, ΣA-G, A-ΣG-O, ΣA-G-O, A-ΣG, ΣI:EijI, ΣAP-I, ΣG:EijG, ΣSP-G, ΣS:EijS, ΣAP-S, ΣR:Eij, ΣAP-R, ΣT:EijT, ΣAP-T, ΣO:ΣG-O, A-ΣG-O, ΣA-G-O, E:EGF, H:HRG, Ei:ErbB, G:Grb2, S:Shc, I:PI3K, T:PTP1-B, O:SOS, A:Gab1, R:RasGAP, RsD:Ras-GDP, RsT:Ras-GTP, P2:PIP2, P3:PIP3, Eij:ErbB homo- or heterodimer bound, EijX: Eij bound to protein. Single-sided solid-head arrows with solid lines depict chemical transformation, while those with dotted lines depict a potentially multistep chemical reaction process. Single-sided double solid-head arrows depict summation into a Σ-state. P denotes tyrosine phosphorylation, PT denotes threonine/serine phosphorylation, and *denotes activation. Red arrows show the targets of ERK, Akt, and ErbB inhibitors.
Fig 2
Fig 2. Time course simulation of ERK* and Akt*.
(A) Simulated and experimental time course of ERK*. (B) Simulated and experimental time course of Akt*. The HRG concentrations were 0.1, 0.5 and 10 nM, while the EGF concentration was set to 0.5 nM. The solid, dashed and dot-dash lines indicate the simulated results at 0, 0.5 and 10 nM HRG, respectively. The cross, circle and triangle indicate the experimental activity at 0.1, 0.5 and 10 nM HRG, respectively. The initial activities are set to zero by subtracting the background intensity from the measured activities and then the resultant activities are normalized so that the maximum intensity during time course is 1. The error bars denote the standard deviations of signal intensities in quadruplicate independent experiments.
Fig 3
Fig 3. A heat map of the simulated final activity of ERK* and Akt*.
The final ERK* and Akt* were simulated while systematically varying the ligand concentrations of EGF and HRG. The ERK* and Akt* were normalized by their maximum values. The red color becomes more intense with an increase in ERK* and Akt*. A solid red bar represents maximum activity.
Fig 4
Fig 4. Time course of the DSs of ERK* and Akt*.
The simulated DSs of ERK* and Akt* with respect to kon44 (A), and koff44 (B). The concentrations of EGF and HRG were 0.5 nM and 0.5 nM, respectively.
Fig 5
Fig 5. Frequency distributions of the DSs of ERK* and Akt*.
(A) Frequency distribution of the DSs of ERK*. (B) Frequency distribution of the DSs of Akt*. DSs (n = 237) were simulated at 100 s and 300 s with (HRG, EGF) = (0.5 nM, 0.5 nM). The black and white bars indicate the distributions at 100 s and 300 s.
Fig 6
Fig 6. Critical parameter shifts in the early stage in response to EGF at a low HRG concentration.
Orange, blue and green colors indicates the Akt*-specific, ERK*-specific, and dual-specific critical reactions or parameters at 100s with (EGF, HRG) = (0.5nM, 0.5nM) and (EGF, HRG) = (10.0nM, 0.5nM).
Fig 7
Fig 7. Critical parameter shifts in the early stage in response to EGF at a high HRG concentration.
Orange, blue and green colors indicates the Akt*-specific, ERK*-specific, and dual-specific critical reactions or parameters at 100s with (EGF, HRG) = (0.5nM, 10.0nM) and (EGF, HRG) = (10.0nM, 10.0nM).
Fig 8
Fig 8. Critical parameter shifts in the late stage in response to EGF at a low HRG concentration.
Orange, blue and green colors indicates the Akt*-specific, ERK*-specific, and dual-specific critical reactions or parameters at 300s with (EGF, HRG) = (0.5nM, 0.5nM) and (EGF, HRG) = (10.0nM, 0.5nM).
Fig 9
Fig 9. Critical parameter shifts in the late stage in response to EGF at a high HRG concentration.
Orange, blue and green colors indicates the Akt*-specific, ERK*-specific, and dual-specific critical reactions or parameters at 300s with (EGF, HRG) = (0.5nM, 10.0nM) and (EGF, HRG) = (10.0nM, 10.0nM).
Fig 10
Fig 10. MPS time course of ERK* and Akt* in response to different concentrations of EGF and HRG.
The heat map illustrates the MPS values of ERK* and Akt* simulated at different concentrations of EGF and HRG. The white color represents a very small MPS value, i.e., enhanced robustness with respect to external changes in EGF and HRG, while the red color represents a high MPS value, i.e., sensitivity with respect to external changes in EGF and HRG.
Fig 11
Fig 11. Dynamics of ERK* and Akt* in response to the addition of three inhibitors.
(A) Control. No inhibitor added. (B) ERK inhibitor (9.0 nM). (C) Akt inhibitor (0.6 nM). (D) ErbB inhibitor (30 nM). The inhibitors were added at 0 s. The black lines, dashed lines and dotted lines indicate the simulated time courses of ERK* and Akt* at HRG concentrations of 0 nM, 0.5 nM and 10.0 nM, respectively. The EGF concentration was fixed at 10.0 nM.

Similar articles

References

    1. Citri A, Yarden Y (2006) EGF-ERBB signalling: towards the systems level. Nat Rev Mol Cell Biol 7: 505–516. 10.1038/nrm1962 - DOI - PubMed
    1. Thottassery JV, Sun Y, Westbrook L, Rentz SS, Manuvakhova M, et al. (2004) Prolonged extracellular signal-regulated kinase 1/2 activation during fibroblast growth factor 1- or heregulin beta1-induced antiestrogen-resistant growth of breast cancer cells is resistant to mitogen-activated protein/extracellular regulated kinase kinase inhibitors. Cancer Res 64: 4637–4647. 10.1158/0008-5472.CAN-03-2645 - DOI - PubMed
    1. Nakakuki T, Birtwistle MR, Saeki Y, Yumoto N, Ide K, et al. (2010) Ligand-specific c-Fos expression emerges from the spatiotemporal control of ErbB network dynamics. Cell 141: 884–896. 10.1016/j.cell.2010.03.054 - DOI - PMC - PubMed
    1. Kholodenko BN, Demin OV, Moehren G, Hoek JB (1999) Quantification of short term signaling by the epidermal growth factor receptor. J Biol Chem 274: 30169–30181. - PubMed
    1. Schoeberl B, Eichler-Jonsson C, Gilles ED, Muller G (2002) Computational modeling of the dynamics of the MAP kinase cascade activated by surface and internalized EGF receptors. Nat Biotechnol 20: 370–375. 10.1038/nbt0402-370 - DOI - PubMed

MeSH terms