

Ebola virus glycoprotein directly triggers T lymphocyte death despite of the lack of infection
- PMID: 28542576
- PMCID: PMC5456411
- DOI: 10.1371/journal.ppat.1006397
Ebola virus glycoprotein directly triggers T lymphocyte death despite of the lack of infection
Abstract
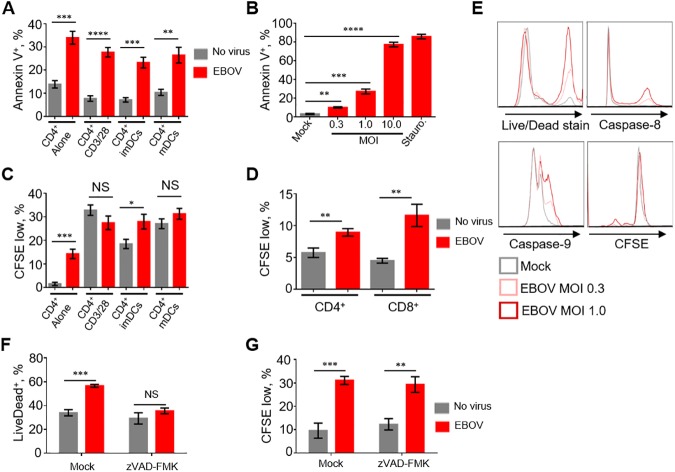
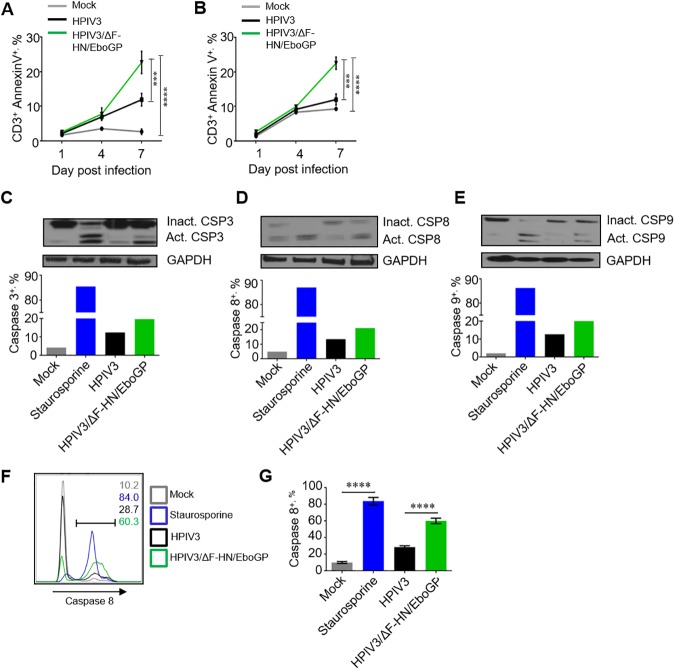
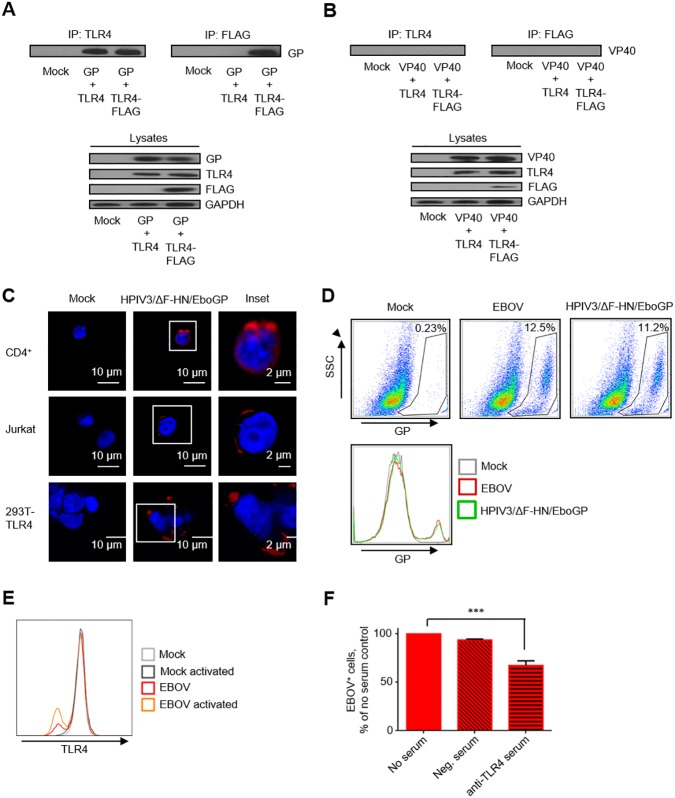
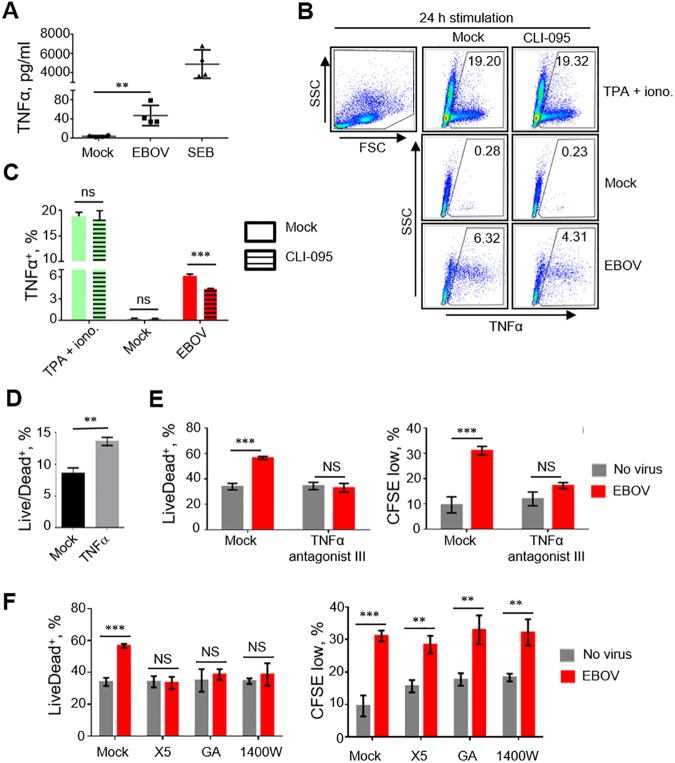
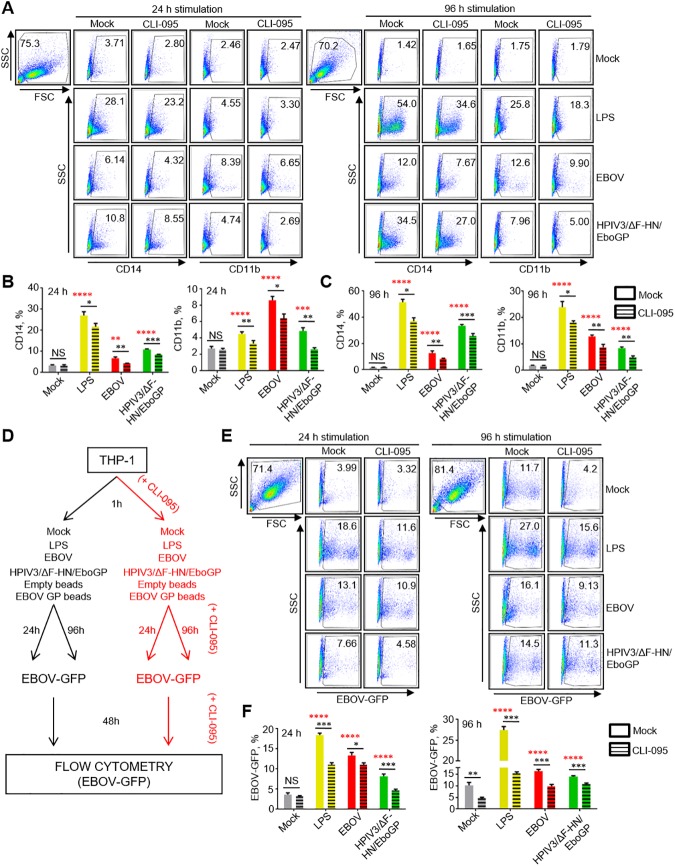
Fatal outcomes of Ebola virus (EBOV) infections are typically preceded by a 'sepsis-like' syndrome and lymphopenia despite T cells being resistant to Ebola infection. The mechanisms that lead to T lymphocytes death remain largely unknown; however, the degree of lymphopenia is highly correlative with fatalities. Here we investigated whether the addition of EBOV or its envelope glycoprotein (GP) to isolated primary human CD4+ T cells induced cell death. We observed a significant decrease in cell viability in a GP-dependent manner, which is suggestive of a direct role of GP in T cell death. Using immunoprecipitation assays and flow cytometry, we demonstrate that EBOV directly binds to CD4+ T cells through interaction of GP with TLR4. Transcriptome analysis revealed that the addition of EBOV to CD4+ T cells results in the significant upregulation of pathways associated with interferon signaling, pattern recognition receptors and intracellular activation of NFκB signaling pathway. Both transcriptome analysis and specific inhibitors allowed identification of apoptosis and necrosis as mechanisms associated with the observed T cell death following exposure to EBOV. The addition of the TLR4 inhibitor CLI-095 significantly reduced CD4+ T cell death induced by GP. EBOV stimulation of primary CD4+ T cells resulted in a significant increase in secreted TNFα; inhibition of TNFα-mediated signaling events significantly reduced T cell death while inhibitors of both necrosis and apoptosis similarly reduced EBOV-induced T cell death. Lastly, we show that stimulation with EBOV or GP augments monocyte maturation as determined by an overall increase in expression levels of markers of differentiation. Subsequently, the increased rates of cellular differentiation resulted in higher rates of infection further contributing to T cell death. These results demonstrate that GP directly subverts the host's immune response by increasing the susceptibility of monocytes to EBOV infection and triggering lymphopenia through direct and indirect mechanisms.
Conflict of interest statement
The authors have declared that no competing interests exist.
Figures
Similar articles
-
Ebola Virus Shed Glycoprotein Triggers Differentiation, Infection, and Death of Monocytes Through Toll-Like Receptor 4 Activation.J Infect Dis. 2018 Nov 22;218(suppl_5):S327-S334. doi: 10.1093/infdis/jiy406. J Infect Dis. 2018. PMID: 30085081 Free PMC article.
-
Enhancement of Ebola Virus Infection via Ficolin-1 Interaction with the Mucin Domain of GP Glycoprotein.J Virol. 2016 May 12;90(11):5256-5269. doi: 10.1128/JVI.00232-16. Print 2016 Jun 1. J Virol. 2016. PMID: 26984723 Free PMC article.
-
Matrix-M adjuvant enhances antibody, cellular and protective immune responses of a Zaire Ebola/Makona virus glycoprotein (GP) nanoparticle vaccine in mice.Vaccine. 2016 Apr 7;34(16):1927-35. doi: 10.1016/j.vaccine.2016.02.033. Epub 2016 Feb 24. Vaccine. 2016. PMID: 26921779
-
[Research progress on ebola virus glycoprotein].Bing Du Xue Bao. 2013 Mar;29(2):233-7. Bing Du Xue Bao. 2013. PMID: 23757858 Review. Chinese.
-
The Roles of Ebola Virus Soluble Glycoprotein in Replication, Pathogenesis, and Countermeasure Development.Viruses. 2019 Oct 31;11(11):999. doi: 10.3390/v11110999. Viruses. 2019. PMID: 31683550 Free PMC article. Review.
Cited by
-
HER2-mediated enhancement of Ebola virus entry.PLoS Pathog. 2020 Oct 14;16(10):e1008900. doi: 10.1371/journal.ppat.1008900. eCollection 2020 Oct. PLoS Pathog. 2020. PMID: 33052961 Free PMC article.
-
Immunological Perspective for Ebola Virus Infection and Various Treatment Measures Taken to Fight the Disease.Pathogens. 2020 Oct 17;9(10):850. doi: 10.3390/pathogens9100850. Pathogens. 2020. PMID: 33080902 Free PMC article. Review.
-
Hyperinflammation, apoptosis, and organ damage.Exp Biol Med (Maywood). 2022 Jul;247(13):1112-1123. doi: 10.1177/15353702221090454. Epub 2022 Apr 27. Exp Biol Med (Maywood). 2022. PMID: 35475359 Free PMC article. Review.
-
Immunologic timeline of Ebola virus disease and recovery in humans.JCI Insight. 2020 May 21;5(10):e137260. doi: 10.1172/jci.insight.137260. JCI Insight. 2020. PMID: 32434986 Free PMC article.
-
Ebola virus-mediated T-lymphocyte depletion is the result of an abortive infection.PLoS Pathog. 2019 Oct 24;15(10):e1008068. doi: 10.1371/journal.ppat.1008068. eCollection 2019 Oct. PLoS Pathog. 2019. PMID: 31648236 Free PMC article.
References
-
- CDC. 2014–2016 Ebola Outbreak in West Africa. 2016. Available from: https://www.cdc.gov/vhf/ebola/outbreaks/2014-west-africa/index.html.
-
- Kilgore PE, Grabenstein JD, Salim AM, Rybak M. Treatment of ebola virus disease. Pharmacotherapy. 2015;35(1):43–53. doi: 10.1002/phar.1545 - DOI - PubMed
-
- Geisbert TW, Hensley LE, Gibb TR, Steele KE, Jaax NK, Jahrling PB. Apoptosis induced in vitro and in vivo during infection by Ebola and Marburg viruses. Lab Invest. 2000;80(2):171–86. - PubMed
-
- Reed DS, Hensley LE, Geisbert JB, Jahrling PB, Geisbert TW. Depletion of peripheral blood T lymphocytes and NK cells during the course of ebola hemorrhagic Fever in cynomolgus macaques. Viral Immunol. 2004;17(3):390–400. doi: 10.1089/vim.2004.17.390 - DOI - PubMed
MeSH terms
Substances
LinkOut - more resources
Full Text Sources
Other Literature Sources
Medical
Molecular Biology Databases
Research Materials
Miscellaneous
