

Association Between Undetected 10-2 Visual Field Damage and Vision-Related Quality of Life in Patients With Glaucoma
- PMID: 28542692
- PMCID: PMC5710200
- DOI: 10.1001/jamaophthalmol.2017.1396
Association Between Undetected 10-2 Visual Field Damage and Vision-Related Quality of Life in Patients With Glaucoma
Abstract
Importance: Recent evidence supports the presence of macular damage (within 8° of the central field) to retinal ganglion cells and associated central visual field (VF) defects in glaucoma, even in early stages. Despite this, to our knowledge, the association of 10-2 VF damage with vision-related quality of life (QOL) has not been well studied.
Objective: To determine the association between QOL and visual function as measured by 24-2 and 10-2 VFs in patients with primary open-angle glaucoma and to test the hypothesis that patients with vision-related QOL disproportionate to their 24-2 VF status may exhibit 10-2 damage overlooked by the 24-2 test.
Design, setting, and participants: In this cross-sectional analysis of observational cohort study data taken from a tertiary care specialty practice, 113 patients with glaucoma with the entire range of 24-2 VF damage completed the National Eye Institute Visual Function Questionnaire (NEI VFQ-25). Data were collected from May 2014 to January 2015 and were analyzed from March 2016 to May 2016.
Interventions: Standardized binocular 24-2 and 10-2 VF sensitivities were calculated for each patient.
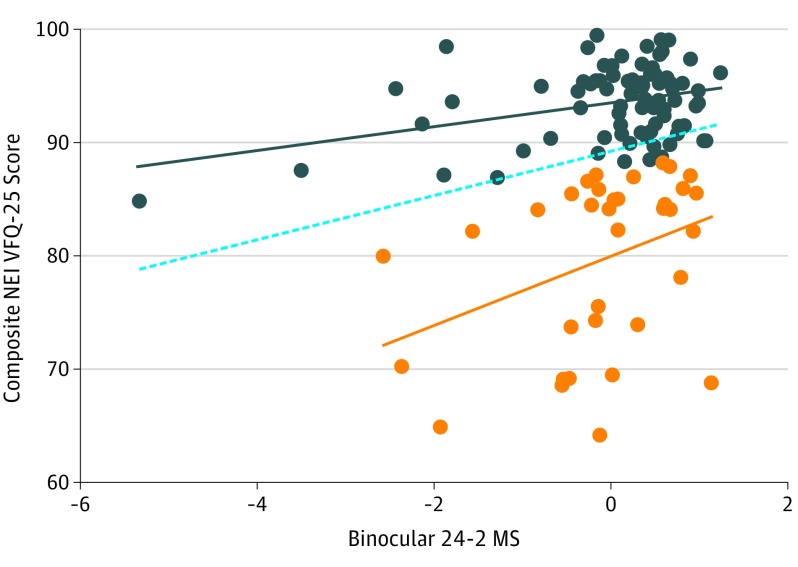
Main outcomes and measures: Association of binocular 24-2 and 10-2 VF sensitivity with Rasch-calibrated NEI VFQ-25 scores. Detection of outliers was based on Cook distance of the regression of binocular 24-2 and NEI VFQ-25 score. Outlier association with QOL was then assessed using a linear regression model, with binocular 10-2 VF sensitivity as the independent variable.
Results: Of the 113 patients, the mean (SD) age was 70.1 (10.9) years, and 51 (45.1%) were male and 71 (62.8%) were white. The composite NEI VFQ-25 score was associated with both binocular 24-2 (β = 1.95; 95% CI, 0.47-3.43; P = .01) and 10-2 (β = 2.57; 95% CI, 1.12-4.01; P = .001) sensitivities, but the 10-2 VF univariable model showed an almost 2-fold better fit to the data (R2 = 9.2% vs 4.9%). However, the binocular 10-2 sensitivities of 24-2 outliers had the strongest association with the composite NEI VFQ-25 scores (β = 2.78; 95% CI, 0.84-4.72; P = .006.) and the best fit to the data (R2 = 18.2%.).
Conclusions and relevance: The 10-2 VF model showed a stronger association with NEI VFQ-25 score than the 24-2 VF model. Patients with disproportionately low quality of vision relative to patients with 24-2 VF damage may have damage on the central field missed by the 24-2 grid. Future prospective testing, including additional dimensions of quality of life, is indicated.
Conflict of interest statement
Figures
Comment in
-
Growing Evidence of the Importance of the Macula in Glaucoma.JAMA Ophthalmol. 2017 Jul 1;135(7):747-748. doi: 10.1001/jamaophthalmol.2017.1379. JAMA Ophthalmol. 2017. PMID: 28542686 No abstract available.
Similar articles
-
The correlation between glaucomatous visual field loss and vision-related quality of life.J Glaucoma. 2015 Jun-Jul;24(5):e121-7. doi: 10.1097/IJG.0000000000000225. J Glaucoma. 2015. PMID: 25642814
-
Association of Glaucoma-Related, Optical Coherence Tomography-Measured Macular Damage With Vision-Related Quality of Life.JAMA Ophthalmol. 2017 Jul 1;135(7):783-788. doi: 10.1001/jamaophthalmol.2017.1659. JAMA Ophthalmol. 2017. PMID: 28594977 Free PMC article.
-
Patient-reported vision-related quality of life differences between superior and inferior hemifield visual field defects in primary open-angle glaucoma.JAMA Ophthalmol. 2015 Mar;133(3):269-75. doi: 10.1001/jamaophthalmol.2014.4908. JAMA Ophthalmol. 2015. PMID: 25429608
-
A Review of Studies of the Association of Vision-Related Quality of Life with Measures of Visual Function and Structure in Patients with Glaucoma in the United States.Ophthalmic Epidemiol. 2021 Jun;28(3):265-276. doi: 10.1080/09286586.2020.1863992. Epub 2021 Feb 3. Ophthalmic Epidemiol. 2021. PMID: 33530788 Free PMC article. Review.
-
Psychological distress is associated with vision-related but not with generic quality of life in patients with visual field defects after cerebral lesions.Ment Illn. 2012 Sep 6;4(2):e12. doi: 10.4081/mi.2012.e12. eCollection 2012 Jul 26. Ment Illn. 2012. PMID: 25478113 Free PMC article. Review.
Cited by
-
Association Between Longitudinal 10-2 Central Visual Field Change and the Risk of Visual Acuity Loss in Mild-to-Moderate Glaucoma.J Glaucoma. 2023 Jul 1;32(7):549-555. doi: 10.1097/IJG.0000000000002236. Epub 2023 May 10. J Glaucoma. 2023. PMID: 37171991 Free PMC article.
-
Comparing 10-2 and 24-2 Visual Fields for Detecting Progressive Central Visual Loss in Glaucoma Eyes with Early Central Abnormalities.Ophthalmol Glaucoma. 2019 Mar-Apr;2(2):95-102. doi: 10.1016/j.ogla.2019.01.003. Epub 2019 Jan 14. Ophthalmol Glaucoma. 2019. PMID: 31742250 Free PMC article.
-
Qualitative Evaluation of the 10-2 and 24-2 Visual Field Tests for Detecting Central Visual Field Abnormalities in Glaucoma.Am J Ophthalmol. 2021 Sep;229:26-33. doi: 10.1016/j.ajo.2021.02.015. Epub 2021 Feb 21. Am J Ophthalmol. 2021. PMID: 33626360 Free PMC article.
-
Rapid Campimetry in glaucoma - correspondence with standard perimetry and OCT.Sci Rep. 2024 Oct 25;14(1):25400. doi: 10.1038/s41598-024-75037-5. Sci Rep. 2024. PMID: 39455627 Free PMC article.
-
Rapid Campimetry-A Novel Screening Method for Glaucoma Diagnosis.J Clin Med. 2022 Apr 12;11(8):2156. doi: 10.3390/jcm11082156. J Clin Med. 2022. PMID: 35456248 Free PMC article.
References
-
- Tham YC, Li X, Wong TY, Quigley HA, Aung T, Cheng CY. Global prevalence of glaucoma and projections of glaucoma burden through 2040: a systematic review and meta-analysis. Ophthalmology. 2014;121(11):2081-2090. - PubMed
Publication types
MeSH terms
Grants and funding
LinkOut - more resources
Full Text Sources
Other Literature Sources
Medical
