. 2017 Aug;174(15):2528-2544.
doi: 10.1111/bph.13865. Epub 2017 Jun 27.

Modulatory features of the novel spider toxin μ-TRTX-Df1a isolated from the venom of the spider Davus fasciatus

Affiliations

Modulatory features of the novel spider toxin μ-TRTX-Df1a isolated from the venom of the spider Davus fasciatus

Fernanda C Cardoso et al. Br J Pharmacol. 2017 Aug.

Abstract

Background and purpose: Naturally occurring dysfunction of voltage-gated sodium (NaV ) channels results in complex disorders such as chronic pain, making these channels an attractive target for new therapies. In the pursuit of novel NaV modulators, we investigated spider venoms for new inhibitors of NaV channels.

Experimental approach: We used high-throughput screens to identify a NaV modulator in venom of the spider Davus fasciatus. Further characterization of this venom peptide was undertaken using fluorescent and electrophysiological assays, molecular modelling and a rodent pain model.

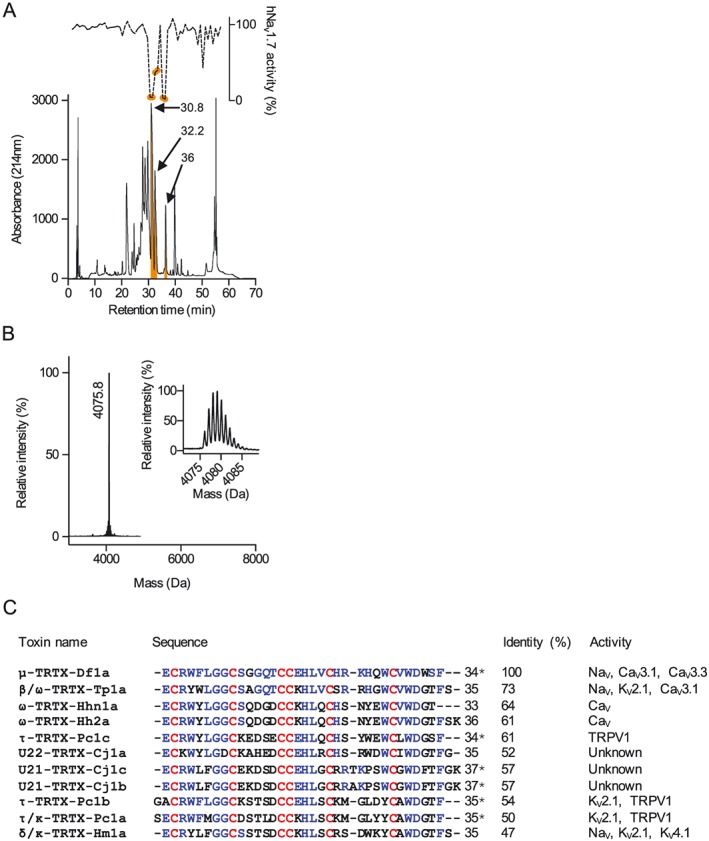
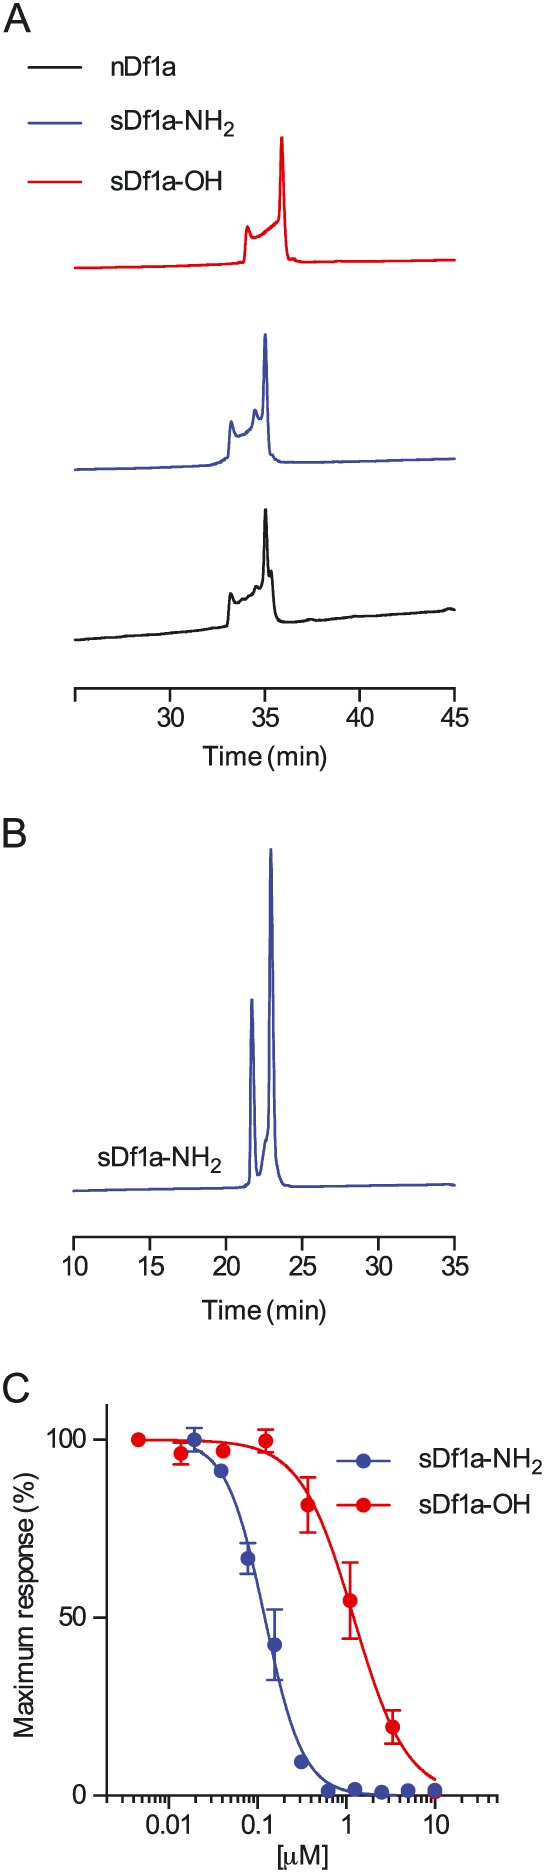
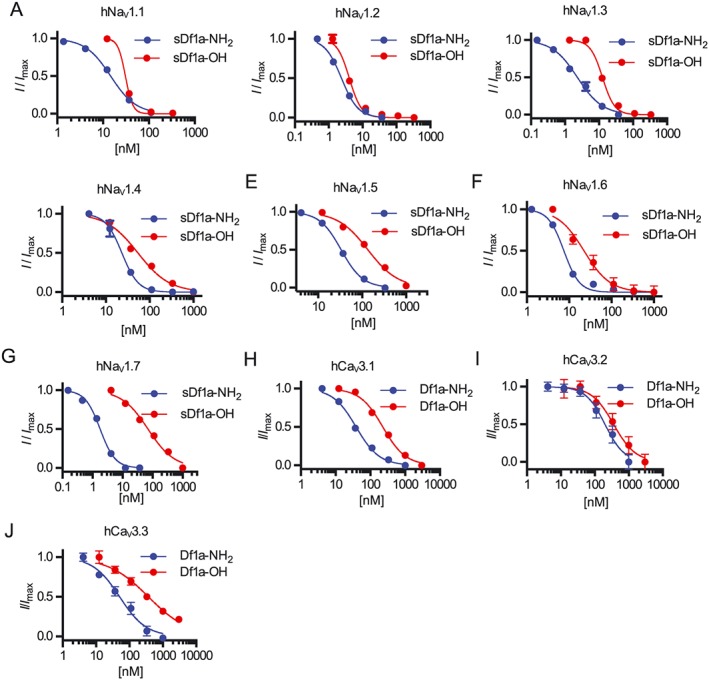
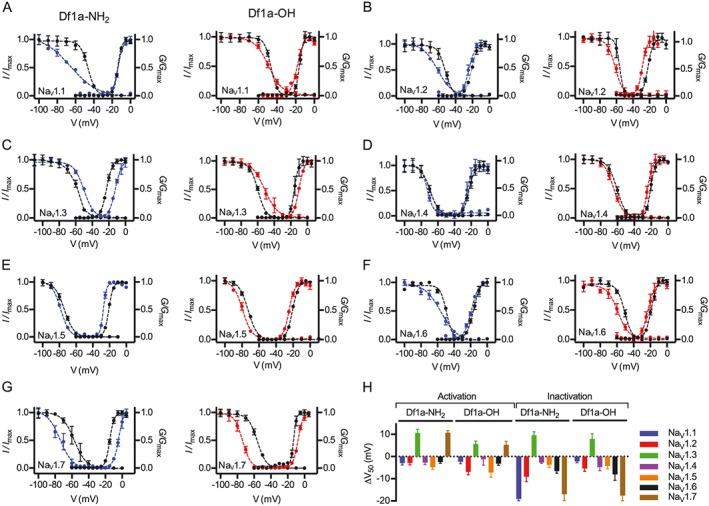
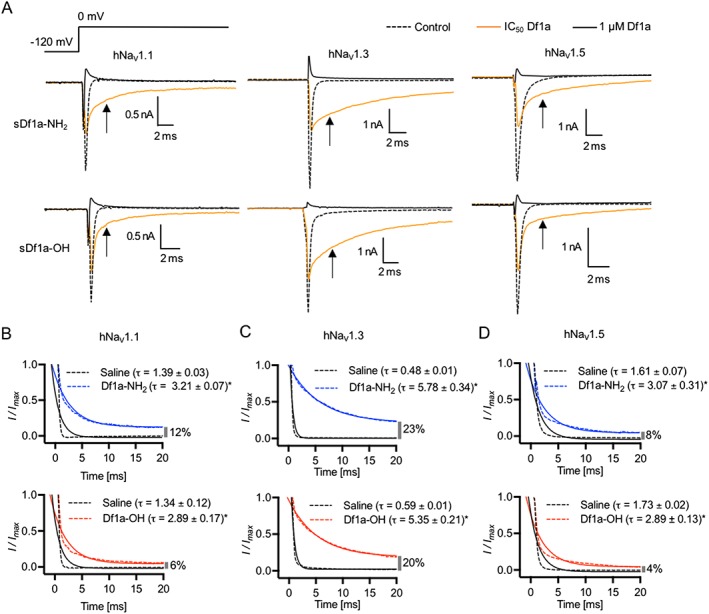
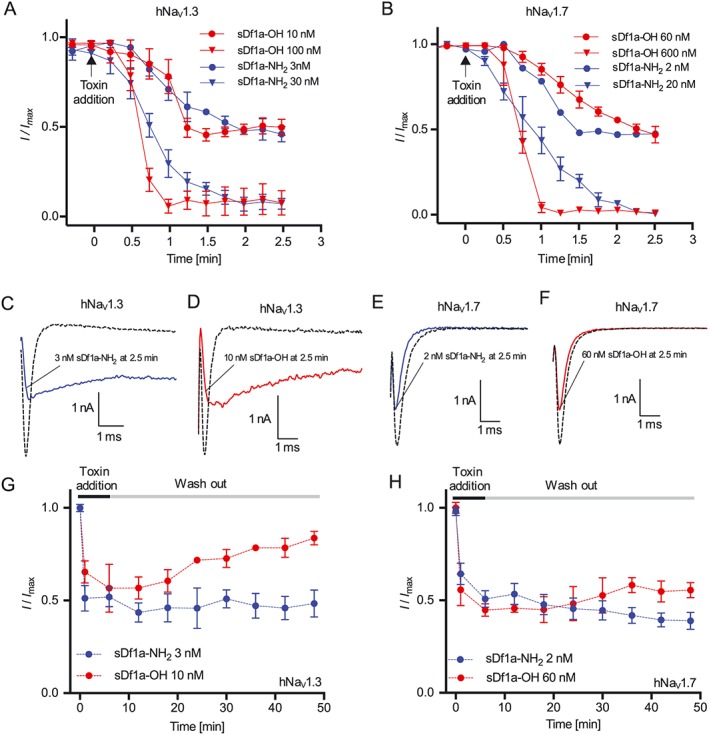
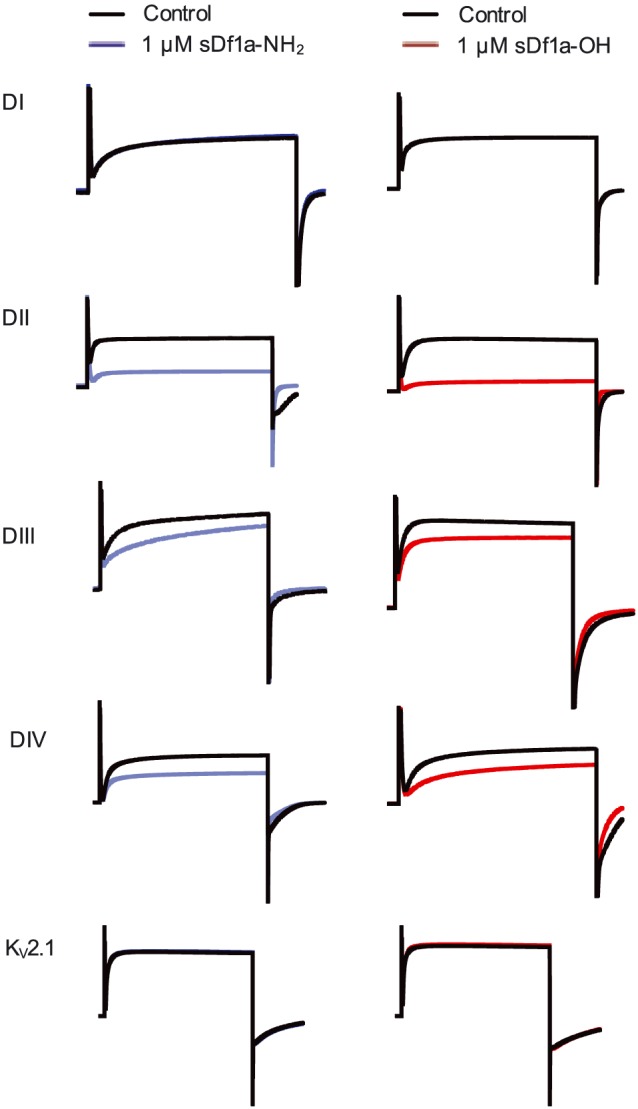
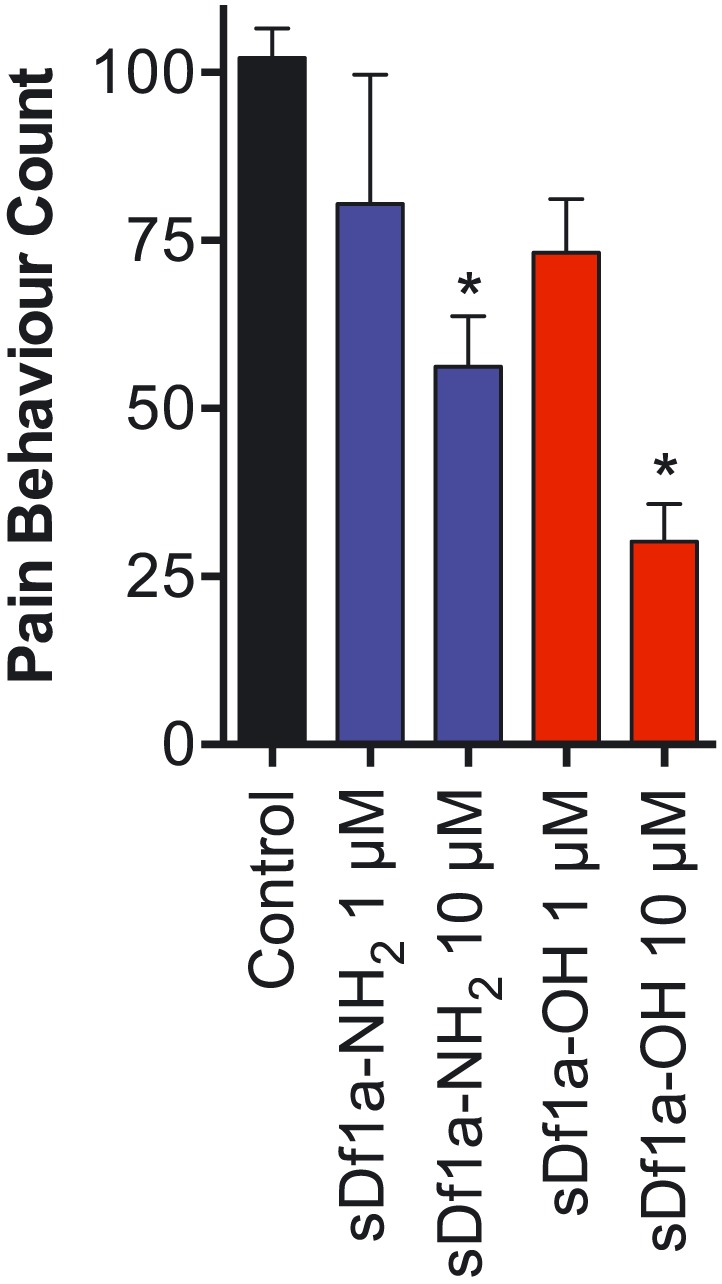
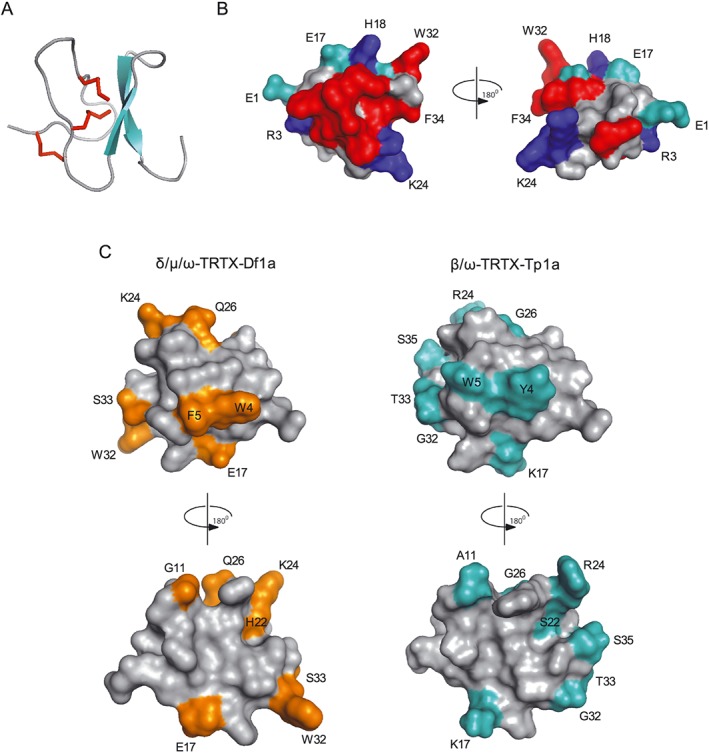
Key results: We identified a potent NaV inhibitor named μ-TRTX-Df1a. This 34-residue peptide fully inhibited responses mediated by NaV 1.7 endogenously expressed in SH-SY5Y cells. Df1a also inhibited voltage-gated calcium (CaV 3) currents but had no activity against the voltage-gated potassium (KV 2) channel. The modelled structure of Df1a, which contains an inhibitor cystine knot motif, is reminiscent of the NaV channel toxin ProTx-I. Electrophysiology revealed that Df1a inhibits all NaV subtypes tested (hNaV 1.1-1.7). Df1a also slowed fast inactivation of NaV 1.1, NaV 1.3 and NaV 1.5 and modified the voltage-dependence of activation and inactivation of most of the NaV subtypes. Df1a preferentially binds to the domain II voltage-sensor and has additional interactions with the voltage sensors domains III and IV, which probably explains its modulatory features. Df1a was analgesic in vivo, reversing the spontaneous pain behaviours induced by the NaV activator OD1.

Conclusion and implications: μ-TRTX-Df1a shows potential as a new molecule for the development of drugs to treat pain disorders mediated by voltage-gated ion channels.


Figures

Figure 1
Figure 1
Venom fractionation, activity screening on NaV1.7, mass spectrometry and sequence determination of active fraction 36. (A) RP‐HPLC of Davus fasciatus crude venom (1 mg) was performed using a Vydac218TP C18 column using a three‐step gradient of acetonitrile/0.05% trifluoroacetic acid (5–10% B for 5 min, 20–40% B for 40 min and 40–80% B for 5 min). Fractions were collected at 0.7 mL·min−1 and screened for NaV1.7 inhibition using Calcium dye and a FLIPRTetra instrument. Fractions eluted at 30.8, 32.2 and 36 min showed strong NaV1.7 inhibition (orange shaded fractions). (B) MALDI‐TOF mass spectrometry of fraction 36 showing single predominant mass of 4075.8 Da. (C) Sequence identification and analysis of μ‐TRTX‐Df1a. Edman degradation analysis of the native toxin revealed a peptide with 34 residues containing six cysteines. The difference in the masses between the native Df1a and predicted mass of the amino acids sequence revealed by Edman degradation indicates the presence of a C‐terminal amidation in the native peptide. Sequence alignment of peptides toxins showing at least 47% identity in their amino acids sequence with Df1a. Identical residues are shown in blue and cysteine scaffold in red. The % identity is shown relative to Df1a, and the activity reported for each peptide toxin is presented in the far right column according to data sourced from the ArachnoServer database (Herzig et al., 2011). Asterisks denote C‐terminal amidation. Df1a showed highest identity with the toxin β/ω‐TRTX‐Tp1a (ProTx‐I) isolated from the tarantula Thrixopelma pruriens (Middleton et al., 2002).
Figure 2
Figure 2
Comparison of the RP‐HPLC retention time of native μ‐TRTX‐Df1a and synthetic Df1a‐NH2 and Df1a‐OH. (A) Analytical RP‐HPLC chromatograms of native amidated Df1a, synthetic Df1a‐NH2 and synthetic Df1a‐OH. RP‐HPLC was performed on a Shimadzu LC20AT system using a Thermo Hypersil GOLD C18 column (2.1 × 100 mm) heated at 40°C. Peptides were eluted using a gradient of 5–50% B over 45 min with a flow rate of 0.3 mL·min−1. Native Df1a and synthetic Df1a‐NH2 eluted both at 33.2 (minor peak) and 35.1 (major peak) min, while synthetic Df1a‐OH eluted at 34.1 (minor peak) and 35.9 (major peak) min. (B) Analytical HPLC trace showing synthetic Df1a‐NH2 at 23°C. Lowering the temperature produced a deconvolution of the chromatogram resulting in only two peaks and disappearance of the unresolved portion between them observed at 40°C. (C) Activity of synthetic sDf1a‐NH2 and sDf1a‐OH over hNaV1.7 in SH‐SY5Y cells determined using a fluorescent assay. The IC50 for hNaV1.7 inhibitions were (in μM) 0.117 ± 0.006 and 1.24 ± 0.30 for sDf1a‐NH2 and sDf1a‐OH respectively. Data are presented as mean ± SEM, n = 9 independent experiments performed on three different days.
Figure 3
Figure 3
Inhibition of hNaV and hCaV3 subtypes by μ‐TRTX‐Df1a measured by automated patch clamp electrophysiology in QPatch 16X. Holding potential was −80 mV for hNaV and −90 mV for hCaV3. Na+ currents were elicited by 20 ms voltage steps to 0 mV from a −120 mV conditioning pulse applied for 200 ms, and Ca2+ currents were elicited by 60 ms voltage steps to −30 mV from a −120 mV conditioning pulse applied for 60 ms. Representative concentration–response curves for inhibition of (A) hNaV1.1, (B) hNaV1.2, (C) hNaV1.3, (D) hNaV1.4, (E) hNaV1.5, (F) hNaV1.6, (G) hNaV1.7, (H) hCaV3.1, (I) hCaV3.2 and (J) hCaV3.3. The IC50 values, calculated using I/I max values and non‐linear regression, were (in nM) 14.3 ± 0.1 (n = 5) and 30.7 ± 2.2 (n = 6) for hNaV1.1, 1.9 ± 0.5 (n = 5) and 3 ± 1.4 (n = 5) for hNaV1.2, 3 ± 0.7 (n = 5) and 10 ± 1 (n = 8) for hNaV1.3, 24 ± 1.8 (n = 5) and 53.6 ± 12 (n = 6) for hNaV1.4, 45.3 ± 6.8 (n = 5) and 125.6 ± 21 (n = 5) for hNaV1.5, 7.6 ± 0.4 (n = 5) and 23 ± 2.9 (n = 7) for hNaV1.6, 1.9 ± 0.08 (n = 6) and 60.5 ± 6.1 (n = 6) for hNaV1.7, 44.6 ± 5.8 (n = 8) and 216 ± 28.1 (n = 7) for hCaV3.1, 253 ± 45.7 (n = 6) and 371 ± 48.8 (n = 6) for hCaV3.2 and 48.4 ± 7.2 (n = 5) and 460 ± 43.7 (n = 7) for hCaV3.3, under application of sDf1a‐NH2 and sDf1a‐OH respectively. Data are presented as mean ± SEM from described n independent experiments; one cell was considered an independent experiment.
Figure 4
Figure 4
Modulation of the voltage‐dependence of hNaV channel activation and inactivation gating in the presence of μ‐TRTX‐Df1a. Data (mean ± SEM, n = 5, one cell was considered an independent experiment) for (A) hNaV1.1, (B) hNaV1.2, (C) hNaV1.3, (D) hNaV1.4, (E) hNaV1.5, (F) hNaV1.6 and (G) hNaV1.7 are plotted as G/G max or I/I max. Cells were held at −80 mV. μ‐TRTX‐Df1a C‐terminal amide and acid were applied at respective IC50 concentration for each NaV channel subtype as described in Figure 3 and Supporting Information Table S1. Steady state kinetics were estimated by currents elicited at 5 mV increment steps ranging from −110 to +80 mV. Conductance was calculated using G = I/(VV rev) in which I, V and V rev are the current value, membrane potential and reverse potential respectively. The voltage‐dependence of fast inactivation was estimated using a double‐pulse protocol where currents were elicited by a 20 ms depolarizing potential of 0 mV following a 500 ms pre‐pulse at potentials ranging from −130 to −10 mV with 10 mV increments. Steady‐state activation and inactivation V50 were determined by the Boltzmann equation. Both C‐terminal acid and amide forms of sDf1a applied at respective IC50 concentrations modified the gating properties of hNaV channels by shifting the voltage‐dependence of activation and steady‐state inactivation to more hyperpolarizing or depolarizing potentials. The ΔV50 was calculated, showing most of the voltage shifts towards more hyperpolarizing potentials, except for hNaV1.3 and hNaV1.7 that had some of these shifts to more hyperpolarizing potentials (H).
Figure 5
Figure 5
μ‐TRTX‐Df1a slows the fast inactivation of hNaV1.1, hNaV1.3 and hNaV1.5 along with peak current reduction after the application of sDf1a‐NH2 or sDf1a‐OH. The same effect is not observed in other hNaV subtypes tested, which presented only peak current reduction after the application of sDf1a‐NH2 or sDf1a‐OH (data not shown). Cells were held at −80 mV and Na+ currents were elicited by 20 ms voltage steps to 0 mV from a −120 mV conditioning pulse applied for 200 ms. (A) Representative traces of hNaV1.1, hNaV1.3 and hNaV1.5 in the presence of sDf1a‐NH2 and sDf1a‐OH. Cells were applied with the correspondent IC50 (black traces) and 1 μM sDf1a (grey trances) for each NaV subtype and incubated for 5 min before depolarization at 0 mV. No toxin controls are presented as dashed traces. Current traces showing the slowing in fast inactivation are featured by arrows. The slowing of fast inactivation at 5 ms after application of 0 mV was plotted against the log scale of various concentrations of Df1a, and maximum slowing in inactivation evaluated. (B–D) hNaV1.1, hNaV1.3 and hNaV1.5 inactivation decay time constant (τ) and percentage of remaining currents were calculated in the presence of respective IC50 concentrations of Df1a for each channel subtype. Blue traces represent the time constant (τ) in the presence of Df1a‐NH2 and red traces in the presence of Df1a‐OH. Remaining currents (%) are presented in the far right of the X‐axis at each graph. A marked slowing of fast inactivation was observed for the NaV1.3 channel subtype in the presence of Df1a, which also displayed the highest percentage of remaining currents at 20 ms. Data are presented as mean ± SEM from n ≥ 5 independent experiments for each ion channel assayed; one cell was considered as an independent experiment (see Supporting Information Table S1).
Figure 6
Figure 6
Kinetics of hNaV current inhibition and recovery in the presence of μ‐TRTX‐Df1a. Cells were maintained at a holding potential −80 mV and Na+ currents elicited by 20 ms voltage steps to 0 mV from a −120 mV conditioning pulse applied for 200 ms. (A) For on‐rates, Na+ currents were recorded every 15 s for 15 min after toxin addition. The on‐rates for hNaV1.3 were 4.34 and 2.03 min at 3 and 30 nM sDf1a‐NH2, respectively, and 1.14 and 1.13 min at 10 and 100 nM sDf1a‐OH respectively. (B) For hNaV1.7, the on‐rates were 0.64 and 1.32 min at 2 and 20 nM sDf1a‐NH2 and 3.06 and 1.32 min at 60 and 600 M sDf1a‐OH respectively. (C–F) Representative Na+ current traces after 2.5 min incubation with Df1a along to consecutive pulses of 0 mV with 15 s intervals. A persistent slowing in fast inactivation associated with peak current reduction was observed for hNaV1.3 in the presence of (C) 3 nM sDf1a‐NH2 and (D) 10 nM sDf1a‐OH, while for hNaV1.7, only a peak reduction was observed in the presence of (E) 2 nM sDf1a‐NH2 and (F) 60 nM sDf1a‐OH. (G–H) For the wash‐out of sDf1a‐NH2 and sDf1a‐OH over hNaV1.3 and hNaV1.7, cells were incubated for 10 min with Df1a and Na+ currents assessed at 5 min intervals during saline washes. The inhibition by sDf1a‐OH at the IC50 concentration was reversible only in the hNaV1.3 subtype, while for sDf1a‐NH2 over hNaV1.3 and hNaV1.7, and sDf1a‐OH over hNaV1.7 the inhibition remained quasi‐irreversible under the experimental conditions applied at up 50 min of recording. The K on, K off and K d were calculated using K d = K off/K on (nM), where K off = 1/τoff (s−1) and K on = (1/τon − K off)/[toxin] (nM−1·S−1). Data are presented as mean ± SEM, n = 5 independent experiments for each condition assayed; one cell was considered as an independent experiment.
Figure 7
Figure 7
Binding sites of μ‐TRTX‐Df1a over hNaV.7. Chimeras hNaV1.7/rKV2.1 containing the paddles S3‐S4 from DI‐DIV from NaV1.7 were used to explore the binding site of Df1a over NaV1.7. Potassium currents were elicited by depolarization to +70 mV. The currents are shown before and after addition of 1 μM Df1a toxin. sDf1a (both C‐terminally acid and amide) preferentially binds to S3‐S4 loop region in DII of NaV1.7, followed by DIII and DIV. Df1a (C‐terminally acid and amide) had no effect on wild‐type rKV2.1 at up to 1 μM. Data are from n = 5 independent experiments for each condition assayed; one oocyte was considered for each independent experiment.
Figure 8
Figure 8
Antinociceptive effects of μ‐TRTX‐Df1a. (A) Intraplantar injection of the NaV1.7 activator OD1 (300 nM) led to rapid development of nocifensive behaviour in mice. This spontaneous pain behaviour, measured by the number of paw licks and flinches, was attenuated in a concentration‐dependent manner by co‐administration of sDf1a‐OH at 1 and 10 μM, and sDf1a‐NH2 at 10 μM but not at 1 μM. Data are presented as mean ± SEM of n = 5 mice per group treated with Df1a and n = 12 mice in the control group. *P < 0.05.
Figure 9
Figure 9
Molecular modelling and structural features of μ‐TRTX‐Df1a. The three dimensional structure of Df1a was modelled using the NMR structure of β/ω‐theraphotoxin‐Tp1a (ProTx‐I) (Gui et al., 2014). (A) Ribbon representation showing β‐sheet (cyan) and Cys‐bridges (red) of a typical ICK peptide. (B) Surface representation of Df1a structure with 180° rotation shown in cyan: negatively charged, blue: positively charged and red: hydrophobic residues (aromatics). Residues present in these regions are labelled (E1, R3, E17, H18, K24, W32 and F34). (C) Comparison of the structures of Df1a and ProTx‐I. The differences in amino acids residues between these toxins are highlighted in orange and cyan respectively. These residues are W4Y, F5W, G11A, E17K, H22S, K24R, Q26G, W32G, S33T for Df1a and ProTx‐I, respectively, and S35 is present only in ProTx‐I. Structures are shown in two orientations, rotated by 180°.

Similar articles

Cited by

References

    1. Alexander SPH, Catterall WA, Kelly E, Marrion N, Peters JA, Benson HE et al. (2015). The Concise Guide to PHARMACOLOGY 2015/16: Voltage‐gated ion channels. Br J Pharmacol 172: 5904–5941. - PMC - PubMed
    1. Amin AS, Klemens CA, Verkerk AO, Meregalli PG, Asghari‐Roodsari A, de Bakker JM et al. (2010). Fever‐triggered ventricular arrhythmias in Brugada syndrome and type 2 long‐QT syndrome. Neth Heart J 18: 165–169. - PMC - PubMed
    1. Arnold K, Bordoli L, Kopp J, Schwede T (2006). The SWISS‐MODEL workspace: a web‐based environment for protein structure homology modelling. Bioinformatics 22: 195–201. - PubMed
    1. Bosmans F, Rash L, Zhu S, Diochot S, Lazdunski M, Escoubas P et al. (2006). Four novel tarantula toxins as selective modulators of voltage‐gated sodium channel subtypes. Mol Pharmacol 69: 419–429. - PubMed
    1. Bosmans F, Martin‐Eauclaire MF, Swartz KJ (2008). Deconstructing voltage sensor function and pharmacology in sodium channels. Nature 456: 202–208. - PMC - PubMed

Publication types

MeSH terms