. 2018 Jan;175(2):335-347.
doi: 10.1111/bph.13867. Epub 2017 Jun 16.

Ibuprofen and diclofenac treatments reduce proliferation of pancreatic acinar cells upon inflammatory injury and mitogenic stimulation

Affiliations

Ibuprofen and diclofenac treatments reduce proliferation of pancreatic acinar cells upon inflammatory injury and mitogenic stimulation

Marta Bombardo et al. Br J Pharmacol. 2018 Jan.

Abstract

Background and purpose: Nonsteroidal anti-inflammatory drugs (NSAIDs) are administered to manage the pain typically found in patients suffering from pancreatitis. NSAIDs also display anti-proliferative activity against cancer cells; however, their effects on normal, untransformed cells are poorly understood. Here, we evaluated whether NSAIDs inhibit the proliferation of pancreatic acinar cells during the development of acute pancreatitis.

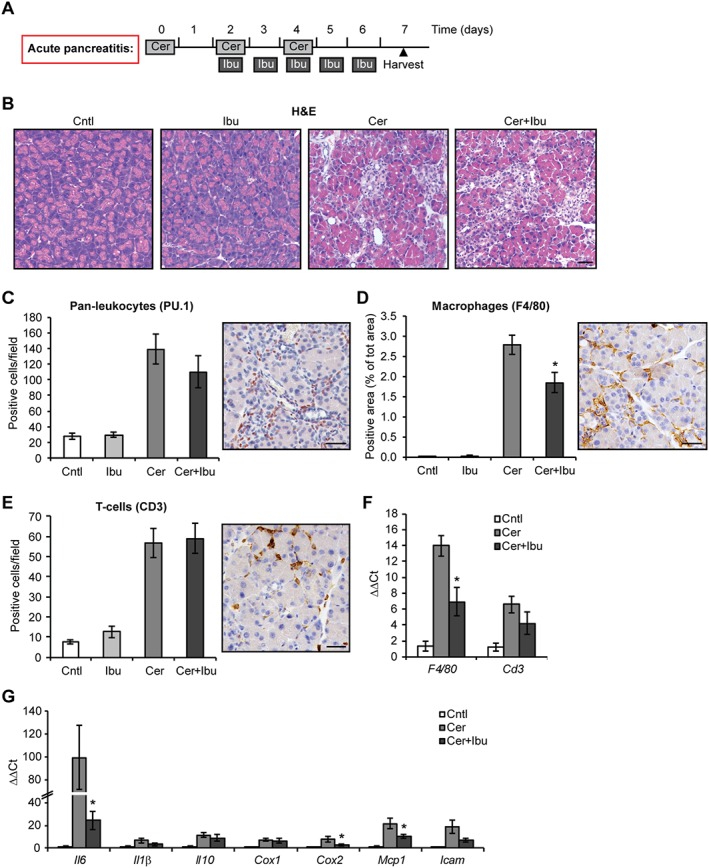
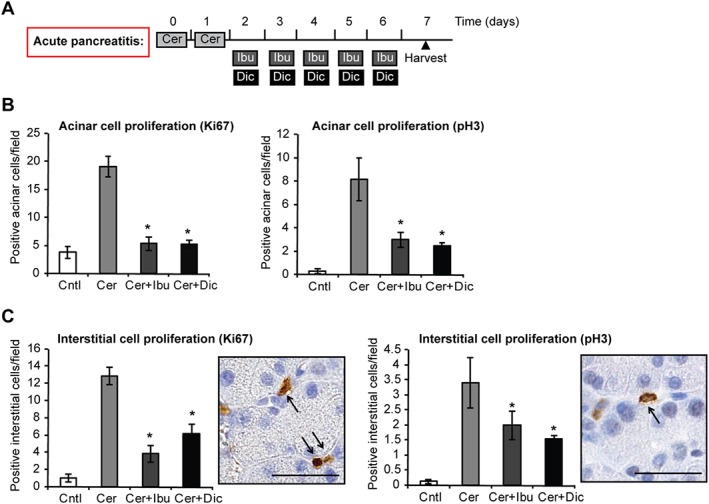
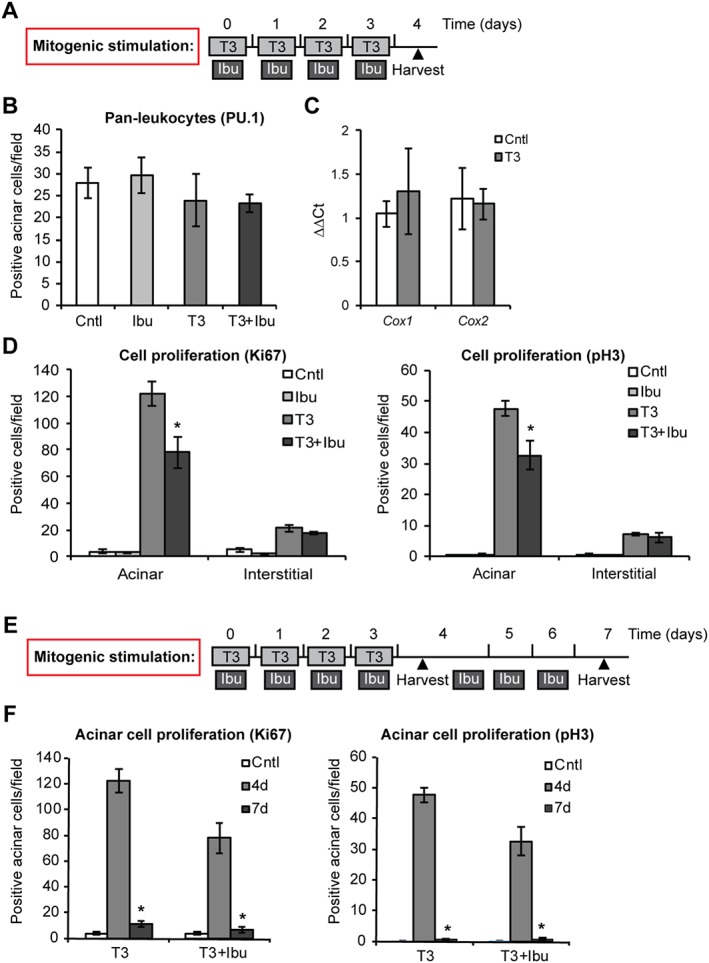
Experimental approach: The NSAIDs ibuprofen and diclofenac were administered to C57BL/6 mice after induction of pancreatitis with serial injections of cerulein. In addition, ibuprofen was administered concomitantly with 3,5,3-L-tri-iodothyronine (T3), which induces acinar cell proliferation in the absence of tissue inflammation. The development of pancreatic inflammation, acinar de-differentiation into metaplastic lesions and acinar proliferation were quantified by histochemical, biochemical and RT-PCR approaches.

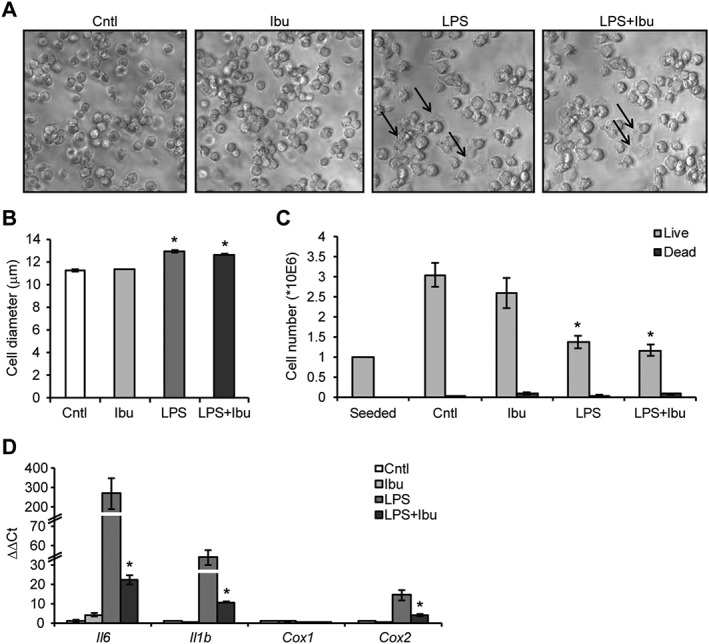
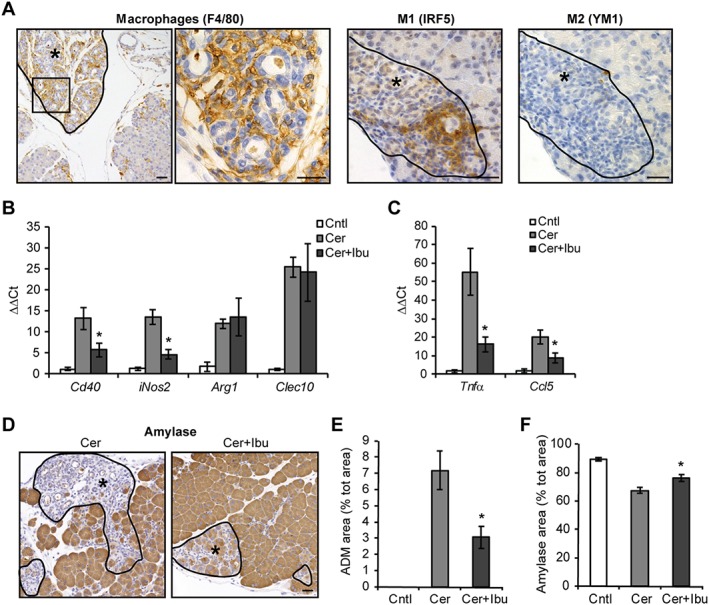
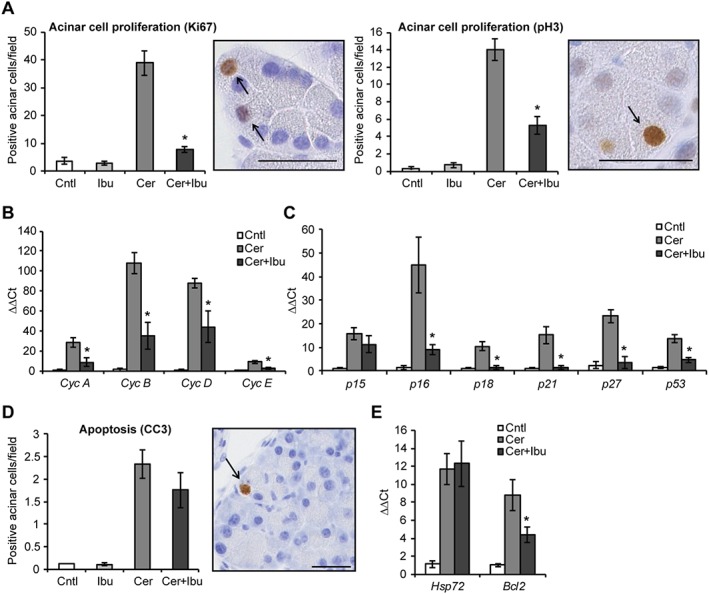
Key results: Therapeutic ibuprofen treatment selectively reduced pancreatic infiltration of activated macrophages in vivo, and M1 macrophage polarization and pro-inflammatory cytokine expression both in vivo and in vitro. Reduced macrophage activation was accompanied by reduced acinar de-differentiation into acinar-to-ductal metaplasia. Acinar proliferation was significantly impaired in the presence of ibuprofen and diclofenac, as demonstrated at both the level of proliferation markers and expression of cell cycle regulators. Ibuprofen also reduced acinar cell proliferation induced by mitogenic stimulation with T3, a treatment that does not elicit pancreatic inflammation.

Conclusions and implications: Our study provides evidence that the NSAIDs ibuprofen and diclofenac inhibit pancreatic acinar cell division. This suggests that prolonged treatment with these NSAIDs may negatively affect the regeneration of the pancreas and further studies are needed to confirm these findings in a clinical setting.

Linked articles: This article is part of a themed section on Inventing New Therapies Without Reinventing the Wheel: The Power of Drug Repurposing. To view the other articles in this section visit http://onlinelibrary.wiley.com/doi/10.1111/bph.v175.2/issuetoc.


Figures

Figure 1
Figure 1
Ibuprofen treatment reduces macrophage infiltration following acute pancreatitis. (A) Schematic representation of ibuprofen treatment using the ‘staggered’ protocol of cerulein‐induced acute pancreatitis. Light grey boxes represent six i.p. injections of 50 μg·kg−1 cerulein (Cer) administered hourly on alternate days. Dark grey boxes represent two i.p. injections of 25 mg·kg−1 ibuprofen (Ibu) administered daily 4 h apart. Black triangle indicates the time of animal harvest, counting from the first cerulein injection. (B) Haematoxylin and eosin (H&E) staining of pancreata after the indicated treatments. (C) Quantification of leukocytes, positive for the pan‐leukocytes PU.1, infiltrating the pancreas. Right panel, representative microphotograph of stained cells. (D) Quantification of F4/80‐positive activated macrophages infiltrating the pancreas. Right panel, representative microphotograph of stained cells. (E) Quantification of CD3‐positive T‐cells infiltrating the pancreas. Right panel, representative microphotograph of stained cells. (F) qPCR of F4/80 and Cd3 expression. (G) qPCR of inflammatory cytokines, chemokine and adhesion molecule expression. Results are average ± SEM (n = 5), *P < 0.05. Scale bars: 50 μm.
Figure 2
Figure 2
Ibuprofen treatment reduces cytokine expression in LPS‐activated macrophages. (A) Microphotograph showing morphological alterations and flattened shape (arrows) of RAW264.7 macrophages upon activation with 10 ng·mL−1 LPS for 16 h in the presence of 800 μM ibuprofen. (B) Cell diameter of LPS‐treated RAW264.7 macrophages in the presence of ibuprofen. (C) Quantification of live and dead RAW264.7 macrophages treated with LPS in the presence of ibuprofen. (D) qPCR of pro‐inflammatory markers in RAW264.7 macrophages treated with LPS in the presence of ibuprofen. Results are average ± SEM (n = 5), *P < 0.05. Scale bars: 50 μm.
Figure 3
Figure 3
Ibuprofen treatment alters macrophage polarization and reduces ADM formation following acute pancreatitis. (A) Staining of F4/80‐positive macrophages and M1, M2 polarized macrophages in ADM lesions (asterisks). (B) qPCR of M1 and M2 macrophage markers in pancreata. (C) qPCR of ADM‐promoting pro‐inflammatory cytokines. (D) Staining of amylase revealing intact acinar cells (brown areas) and ADM lesions with loss of amylase (asterisks). (E) Quantification of ADM areas following amylase staining, expressed as percentage of total area. (F) Quantification of intact acinar cell areas following amylase staining, expressed as percentage of total area. Results are average ± SEM (n = 5), *P < 0.05. Scale bars: 50 μm.
Figure 4
Figure 4
Ibuprofen treatment reduces acinar cell proliferation following acute pancreatitis. (A) Quantification of proliferating acinar cells upon staining with the general proliferation marker Ki67 and with the mitosis‐specific marker pH 3. Right panels, representative microphotographs of stained cells. qPCR of cyclins (B) and cell cycle inhibitors (C) in pancreata after induction of pancreatitis. (D) Quantification of cleaved caspase 3 (CC3)‐positive apoptotic acinar cells after induction of pancreatitis. Right panel, representative microphotograph of stained cells. (E) qPCR of Hsp72 and Bcl2 expression in pancreata. Results are average ± SEM (n = 5), *P < 0.05. Scale bars: 50 μM.
Figure 5
Figure 5
Ibuprofen and diclofenac treatments reduce acinar cell proliferation in a second model of acute pancreatitis. (A) Schematic representation of NSAID treatment using the ‘consecutive’ protocol of cerulein‐induced acute pancreatitis. Light grey boxes represent six i.p. injections of 50 μg·kg−1 cerulein (Cer) administered hourly on two consecutive days. Dark grey boxes represent two i.p. injections of 25 mg·kg−1 ibuprofen (Ibu) administered daily 4 h apart. Black boxes represent two i.p. injections of 10 mg·kg−1 diclofenac (Dic) administered daily 4 h apart. Black triangle indicates the time of animal harvest, counting from the first cerulein injection. (B) Quantification of proliferating acinar cells upon staining with the general proliferation marker Ki67 and with the mitosis‐specific marker pH 3. (C) Quantification of proliferating interstitial cells upon staining with the general proliferation marker Ki67 and with the mitosis‐specific marker pH 3. Right panels, representative microphotographs of stained cells. Results are average ± SEM (n = 5), *P < 0.05.
Figure 6
Figure 6
Ibuprofen treatment reduces acinar cell proliferation following mitogenic stimulation. (A) Schematic representation of ibuprofen treatment during stimulation with T3. Light grey boxes represent daily i.p. injections of 400 mg·kg−1 T3. Dark grey boxes represent two i.p. injections of 25 mg·kg−1 ibuprofen (Ibu) administered daily 4 h apart. Black triangle indicates the time of animal harvest, counting from the first T3 injection. (B) Quantification of PU.1‐positive pan‐leukocytes infiltrating the pancreas. (C) qPCR of Cox1, 2 expression in pancreata. (D) Quantification of proliferating acinar and interstitial cells upon staining with the general proliferation marker Ki67 and with the mitosis‐specific marker pH 3. (E) Schematic representation of prolonged ibuprofen treatment after stimulation with T3. Symbols are as in (A). (F) Quantification of proliferating acinar cells upon staining with the general proliferation marker Ki67 and with the mitosis‐specific marker pH 3. Results are average ± SEM (n = 5), *P < 0.05.

References

    1. Alexander SPH, Davenport AP, Kelly E, Marrion N, Peters JA, Benson HE et al. (2015a). The concise guide to PHARMACOLOGY 2015/16: G protein‐coupled receptors. Br J Pharmacol 172: 5744–5869. - PMC - PubMed
    1. Alexander SPH, Fabbro D, Kelly E, Marrion N, Peters JA, Benson HE et al. (2015b). The concise guide to PHARMACOLOGY 2015/16: Enzymes. Br J Pharmacol 172: 6024–6109. - PMC - PubMed
    1. Andrews J, Djakiew D, Krygier S, Andrews P (2002). Superior effectiveness of ibuprofen compared with other NSAIDs for reducing the survival of human prostate cancer cells. Cancer Chemother Pharmacol 50: 277–284. - PubMed
    1. Araki Y, Okamura S, Hussain SP, Nagashima M, He P, Shiseki M et al. (2003). Regulation of cyclooxygenase‐2 expression by the Wnt and ras pathways. Cancer Res 63: 728–734. - PubMed
    1. Bang UC, Semb S, Nojgaard C, Bendtsen F (2008). Pharmacological approach to acute pancreatitis. World J Gastroenterol 14: 2968–2976. - PMC - PubMed

Publication types

MeSH terms