. 2017 Aug;142(3):392-406.
doi: 10.1111/jnc.14076. Epub 2017 Jun 20.

The polysialic acid mimetics idarubicin and irinotecan stimulate neuronal survival and neurite outgrowth and signal via protein kinase C

Affiliations

The polysialic acid mimetics idarubicin and irinotecan stimulate neuronal survival and neurite outgrowth and signal via protein kinase C

Gabriele Loers et al. J Neurochem. 2017 Aug.

Abstract

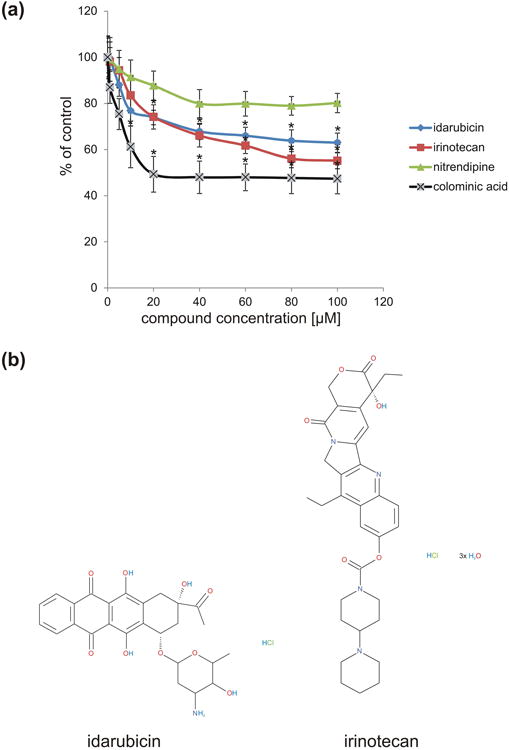
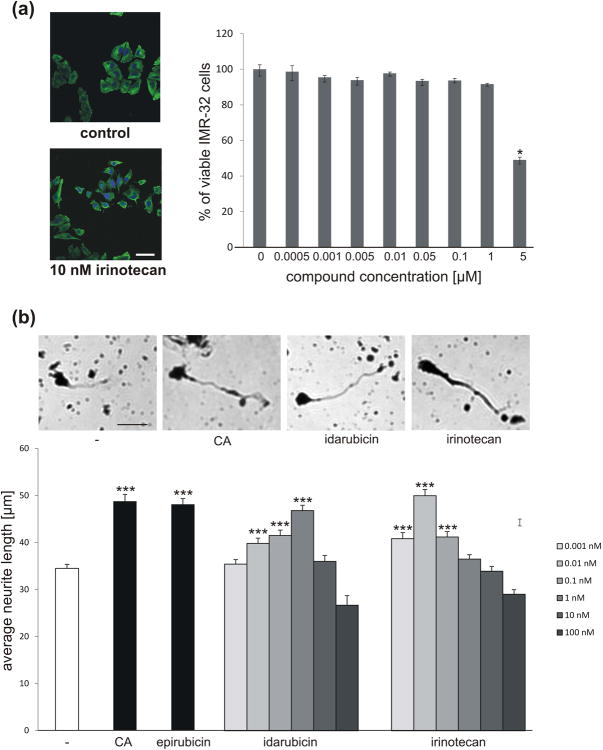
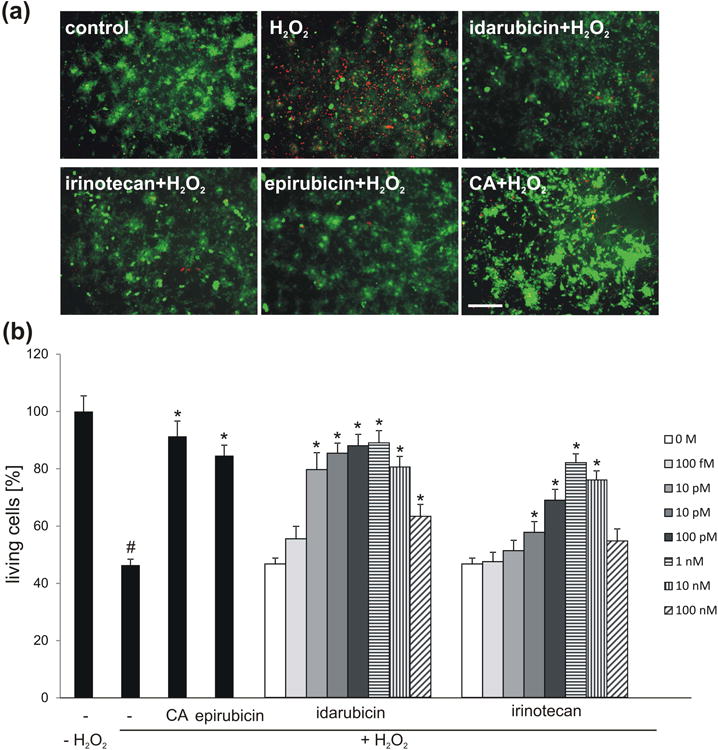
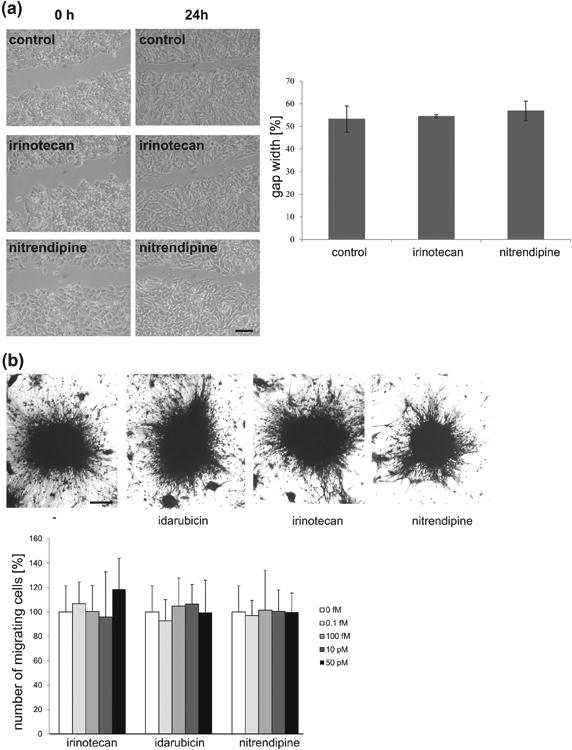
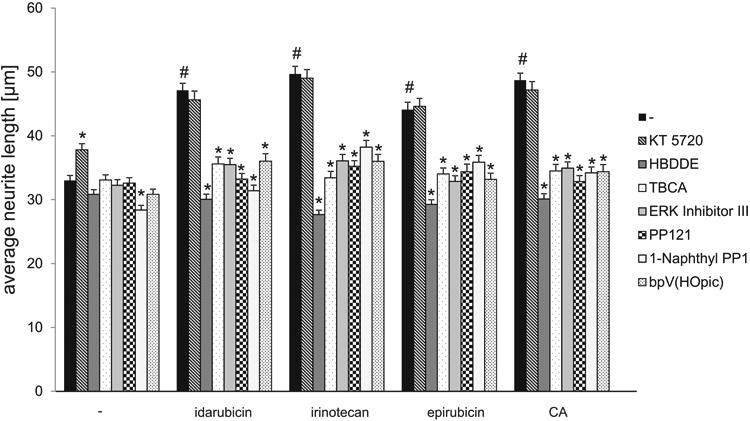
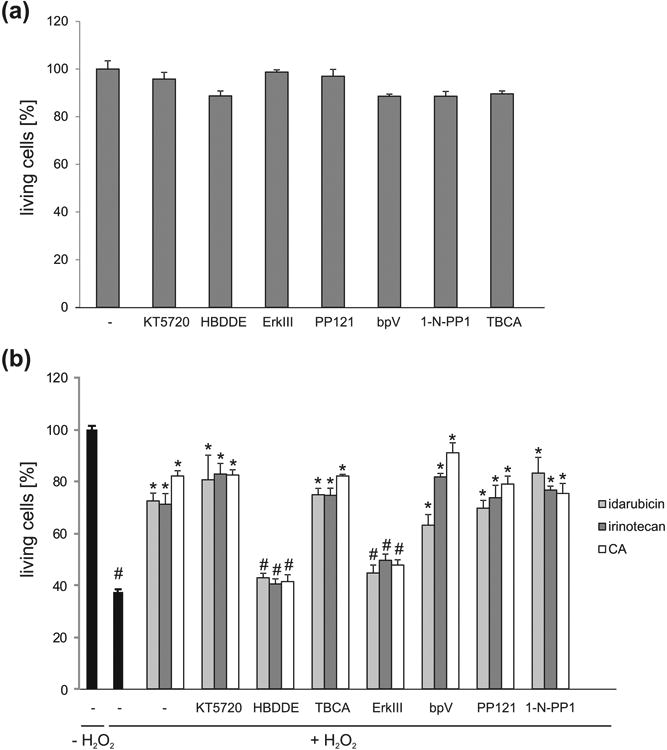
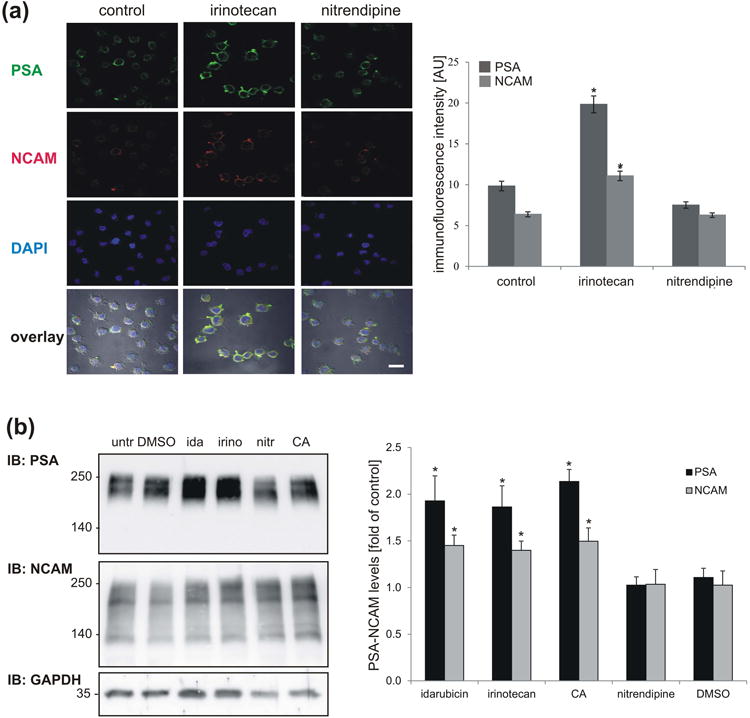
Polysialic acid (PSA) is a large, negatively charged, linear homopolymer of alpha2-8-linked sialic acid residues. It is generated by two polysialyltransferases and attached to N- and/or O-linked glycans, and its main carrier is the neural cell adhesion molecule (NCAM). PSA controls the development and regeneration of the nervous system by enhancing cell migration, axon pathfinding, synaptic targeting, synaptic plasticity, by regulating the differentiation of progenitor cells and by modulating cell-cell and cell-matrix adhesions. In the adult, PSA plays a role in the immune system, and PSA mimetics promote functional recovery after nervous system injury. In search for novel small molecule mimetics of PSA that are applicable for therapy, we identified idarubicin, an antineoplastic anthracycline, and irinotecan, an antineoplastic agent of the topoisomerase I inhibitor class, as PSA mimetics using a competition enzyme-linked immunosorbent assay. Idarubicin and irinotecan compete with the PSA-mimicking peptide and colominic acid, the bacterial analog of PSA, for binding to the PSA-specific monoclonal antibody 735. Idarubicin and irinotecan stimulate neurite outgrowth and survival of cultured cerebellar neurons after oxidative stress via protein kinase C and Erk1/2 in a similar manner as colominic acid, whereas Fyn, casein kinase II and the phosphatase and tensin homolog are only involved in idarubicin and irinotecan-stimulated neurite outgrowth. These novel results show that the structure and function of PSA can be mimicked by the small organic compounds irinotecan and idarubicin which trigger the same signaling cascades as PSA, thus introducing the possibility of retargeting these drugs to treat nervous system injuries.

Keywords: cell survival; idarubicin; irinotecan; neurite outgrowth; polysialic acid.


Figures

Fig. 1
Fig. 1
Idarubicin and irinotecan compete with the PSA-mimicking peptide for binding to the PSA-specific antibody 735. (a) PSA-mimicking peptide-coupled catalase was immobilized and incubated with anti-PSA antibody 735 in the presence of idarubicin (blue), irinotecan (red) or control compound nitrendipine (green) at 1 - 100 μM concentration or colominic acid (black). The signal from 735 antibody binding to PSA-mimicking peptide coupled catalase was set to 100%. Idarubicin and irinotecan compete with PSA-mimicking peptide for binding to 735 antibody in a concentration dependent manner reaching a maximal effect at 60 to 100 μM concentrations. *p< 0.01 (3 wells from three independent experiments; n = 3); data were compared by one-way analysis of variance (ANOVA). (b) Chemical structure of idarubicin and irinotecan.
Fig. 2
Fig. 2
Idarubicin and irinotecan are not toxic to IMR-32 neuroblastoma cells at sub-micromolar concentration and enhance neurite outgrowth of cerebellar granule cells in a concentration-dependent manner. (a) Representative images of irinotecan-treated IMR-32 cells and control cells and quantification of cell survival after treatment of cells with different concentrations of irinotecan. Three wells per treatment group were used to determine the number of live cells (mean ± SEM) and the experiment was repeated thrice (n = 3). Asterisks signify statistically significant differences as compared to untreated control (p < 0.05, one-way ANOVA with Holm Sidak post-hoc test). (b) Representative images of mouse cerebellar granule cells left untreated (-), treated with 1 nM idarubicin or epirubicin, 0.01 nM irinotecan or 30 μg/ml colominic acid (CA). Bar diagram shows the average neurite length (mean + SEM) from the longest neurite of 300 cells (n = 300 cells from 6 wells out of 3 independent experiments) treated with different concentrations of idarubicin and irinotecan, or treated with epirubicin and CA as positive controls. Experiments were performed 3 independent times. Asterisks signify statistically significant differences versus untreated neurons (-) as determined by one-way ANOVA with Fisher's PLSD test (F=27.744, p<0.0001; PLSD *p<0.05). Scale bar, 25 μm.
Fig. 3
Fig. 3
Idarubicin and irinotecan enhance survival of cerebellar granule cells in a concentration-dependent manner. (a) Representative images of cerebellar granule cells treated with 1 nM idarubicin, irinotecan or epirubicin or 30 μg/ml colominic acid (CA) and subsequently stressed using hydrogen peroxide (H2O2), and stained with calcein-AM (green) and propidium iodide (red). (b) Bar diagram shows the relative number of live neurons (mean + SEM) treated with different concentrations of irdarubicin and irinotecan, or treated with 1 nM epirubicin and 30 μg/ml CA as positive controls and stressed with H2O2. The experiment was performed independently five times with three biological replicates in each experiment (n = 5). The hash sign shows significant difference between the unstressed group (-; - H2O2) and stressed group (-; + H2O2). Asterisks signify statistically significant differences between the stressed group (-; + H2O2) and stressed and compound treated groups (epirubicin/CA/idarubicin/irinotecan; + H2O2) as determined by one-way ANOVA with Holm-Sidak post hoc test#p< 0.0001; *p< 0.005). Scale bar, 50 μm.
Fig. 4
Fig. 4
Irinotecan and idarubicin do not alter migration of IMR-32 cells after scratch injury or of neurons from cerebellar explants. (a) Representative phase contrast images of IMR-32 cells, 0 and 24 hours after scratch injury depicting gap size in untreated control, irinotecan (10 nM) and nitrendipine (negative control; 10 nM) treated cells. Scale bar = 200 μm. Histogram represents % gap size (mean ± SEM) in control, irinotecan and nitrendipine treated cells after 24 hours of treatment (initial gap width was taken as 100%). The experiment was performed thrice with two wells per condition (n = 3). No statistically significant differences between control and treated cells were seen (p > 0.05, one-way ANOVA with Holm-Sidak post hoc test). (b) Representative phase contrast images of untreated explants (-) and explants treated with idarubicin, irinotecan or nitrendipine (negative control) (all 100 fM) 24 hours after treatment. Histogram shows the number of migrating cells out of cerebellar explants (mean + SD) from control, irinotecan, idarubicin or nitrendipine treated explants at indicated concentrations 24 hours after treatment. The experiment was performed independently four times and at least 12 explants were analyzed in each experiment (n = 4). No statistically significant differences between control and treated explants were seen (p > 0.05, one-way ANOVA with Holm-Sidak post hoc test). Scale bar, 50 μm.
Fig. 5
Fig. 5
Cell signaling essential for neurite outgrowth that is triggered by idarubicin, irinotecan, epirubicin and CA.Bar diagram displays the average longest neurite length (mean + SEM) of rat cerebellar granule cells pre-treated with different signal transducer molecule inhibitors (KT 5720 (PKA), HBDDE (PKC), TBCA (CKII), Erk inhibitor III (Erk), PP121 (Src), 1-Naphthyl PP1 (Fyn), bpV(HOpic) (PTEN)) and untreated cells or cells treated with 1 nM idarubicin or epirubicin, 0.01 nM irinotecan or 30 μg/ml CA. The hash sign shows a significant difference between the untreated group (control; -) and the groups treated only with PSA mimetics or CA (#p< 0.001). Asterisks signify statistically significant differences within the groups as determined by one-way ANOVA with Fisher's PLSD test (n = 300 cells from 6 wells out of 3 independent experiments; F=36.575 p < 0.0001; PLSD *p< 0.05).
Fig. 6
Fig. 6
Cell signaling triggered by idarubicin, irinotecan, epirubicin and CA which is essential for neuronal survival. (a) Inhibitors do not influence basal cell survival. Bar diagram displays the average number of living murine cerebellar granule cells (mean + SEM) treated with different signal transducer molecule inhibitors (KT 5720 (PKA), HBDDE (PKC), TBCA (CKII), ERK inhibitor III (Erk), PP121 (Src), 1-Naphthyl PP1 (1-N-PP1; Fyn), bpV(HOpic) (bpV; PTEN)). (b) Bar diagram displays the average number of living murine cerebellar granule cells (mean + SEM) pre-treated with different signal transducer molecule inhibitors and treated with 1 nM idarubicin, irinotecan or epirubicin or 30 μg/ml CA followed by cell death induction with H2O2. For each treatment and experiment 6 wells were used and the experiment was repeated four times (n = 4). The pound sign shows significant difference between the untreated group (-; - H2O2) and the stressed group (-; + H2O2) or the stressed groups treated with compounds (-; + H2O2; idarubicin/irinotecan/CA) and the stressed groups treated with inhibitors and compounds (inhibitor; + H2O2; idarubicin/irinotecan/CA) (#p< 0.001). Asterisks signify statistically significant difference compared to the hydrogen peroxide treated group as determined by one-way ANOVA with test Holm-Sidak post-hoc test (*p< 0.005).
Fig. 7
Fig. 7
Expression of PSA and NCAM is enhanced by irinotecan and idarubicin treatment. (a) IMR-32 cells were treated with 10 nM irinotecan, 10 nM nitrendipine (control compound) and DMSO (formulation control) for 72 hours, fixed and stained with antibodies against PSA (green) and NCAM (red). Nuclei are visualized with DAPI (blue). Scale bar: 50 μm. Histogram shows data representing mean values ± SEM from three independent experiments (100 cells were counted per experiment; n = 300) representing the intensity of PSA and NCAM staining in irinotecan (10 nM) and nitrendipine (10 nM) treated cells compared to control cells. * p < 0.05, one-way ANOVA with Holm-Sidak post-hoc test. (b) Cerebellar neurons were left untreated (untr) or treated with 1 nM irinotecan (irino), 1 nM idarubicin (ida), 1 nM nitrendipine (nitr; control compound), 30 μg/ml colominic acid (CA) or DMSO (formulation control) for 24 h, lysed and subjected to Western blot analysis (IB) with antibodies against PSA and NCAM. GAPDH was analyzed to control for loading. PSA and NCAM levels were quantified by densitometry and normalized to the GAPDH levels. A representative immunoblot out of six experiments is shown. Histogram shows data representing mean values + SD from six independent experiments (n = 6) representing the levels of PSA and NCAM levels in compound treated cells normalized to GAPDH levels and compared to PSA and NCAM levels in control cells. * p < 0.05, one-way ANOVA with Holm-Sidak post hoc test.

Similar articles

Cited by

References

    1. Bax M, van Vliet SJ, Litjens M, García-Vallejo JJ, van Kooyk Y. Interaction of polysialic acid with CCL21 regulates the migratory capacity of human dendritic cells. PLOS ONE. 2009;4:e6987. - PMC - PubMed
    1. Bonfanti L. PSA-NCAM in mammalian structural plasticity and neurogenesis. Prog Neurobiol. 2006;80:129–164. - PubMed
    1. Bonfanti L, Theodosis DT. Polysialic acid and activity-dependent synapse remodeling. Cell Adh Migr. 2009;3:43–50. - PMC - PubMed
    1. Brezun JM, Daszuta A. Serotonergic reinnervation reverses lesion-induced decreases in PSA-NCAM labeling and proliferation of hippocampal cells in adult rats. Hippocampus. 2000;10:37–46. - PubMed
    1. Bushman J, Mishra B, Ezra M, Gul S, Schulze C, Chaudhury S, Ripoll D, Wallqvist A, Kohn J, Schachner M, Loers G. Tegaserod mimics the neurostimulatory glycan polysialic acid and promotes nervous system repair. Neuropharmacology. 2014;79:456–466. - PMC - PubMed

Publication types

MeSH terms