Model-Based Evaluation of Exenatide Effects on the QT Interval in Healthy Subjects Following Continuous IV Infusion
- PMID: 28543393
- PMCID: PMC5518197
- DOI: 10.1002/jcph.882
Model-Based Evaluation of Exenatide Effects on the QT Interval in Healthy Subjects Following Continuous IV Infusion
Abstract
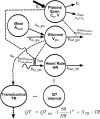
Investigation of the cardiovascular proarrhythmic potential of a new chemical entity is now an integral part of drug development. Studies suggest that meals and glycemic changes can influence QT intervals, and a semimechanistic model has been developed that incorporates the effects of changes in glucose concentrations on heart rate (HR) and QT intervals. This analysis aimed to adapt the glucose-HR-QT model to incorporate the effects of exenatide, a drug that reduces postprandial increases in glucose concentrations. The final model includes stimulatory drug effects on glucose elimination and HR perturbations. The targeted and constant exenatide plasma concentrations (>200 pg/mL), via intravenous infusions at multiple dose levels, resulted in significant inhibition of glucose concentrations. The exenatide concentration associated with 50% of the stimulation of HR production was 584 pg/mL. After accounting for exenatide effects on glucose and HR, no additional drug effects were required to explain observed changes in the QT interval. Resulting glucose, HR, and QT profiles at all exenatide concentrations were adequately described. For therapeutic agents that alter glycemic conditions, particularly those that alter postprandial glucose, the QT interval cannot be directly compared to that with placebo without first accounting for confounding factors (eg, glucose) either through mathematical modeling or careful consideration of mealtime placement in the study design.
Keywords: QT interval; glucose; heart rate; mathematical modeling.
© 2017, The Authors. The Journal of Clinical Pharmacology published by Wiley Periodicals, Inc. on behalf of American College of Clinical Pharmacology.
Figures


Similar articles
-
Target-mediated pharmacokinetic and pharmacodynamic model of exendin-4 in rats, monkeys, and humans.Drug Metab Dispos. 2012 May;40(5):990-7. doi: 10.1124/dmd.111.042291. Epub 2012 Feb 15. Drug Metab Dispos. 2012. PMID: 22338110 Free PMC article.
-
A thorough QT study to evaluate the effects of singledose exenatide 10 μg on cardiac repolarization in healthy subjects.Int J Clin Pharmacol Ther. 2011 Oct;49(10):594-604. doi: 10.5414/cp201462. Int J Clin Pharmacol Ther. 2011. PMID: 21961484 Clinical Trial.
-
Day-long subcutaneous infusion of exenatide lowers glycemia in patients with type 2 diabetes.Horm Metab Res. 2005 Oct;37(10):627-32. doi: 10.1055/s-2005-870529. Horm Metab Res. 2005. PMID: 16278786 Clinical Trial.
-
Pharmacokinetic drug evaluation of exenatide for the treatment of type 2 diabetes.Expert Opin Drug Metab Toxicol. 2018 Feb;14(2):207-217. doi: 10.1080/17425255.2018.1420160. Epub 2017 Dec 28. Expert Opin Drug Metab Toxicol. 2018. PMID: 29260924 Review.
-
Exenatide.Drugs Today (Barc). 2005 Sep;41(9):563-78. doi: 10.1358/dot.2005.41.9.893704. Drugs Today (Barc). 2005. PMID: 16341288 Review.
Cited by
-
A Comprehensive Review on the Pharmacokinetics and Drug-Drug Interactions of Approved GLP-1 Receptor Agonists and a Dual GLP-1/GIP Receptor Agonist.Drug Des Devel Ther. 2025 Apr 30;19:3509-3537. doi: 10.2147/DDDT.S506957. eCollection 2025. Drug Des Devel Ther. 2025. PMID: 40330819 Free PMC article. Review.
-
Influence of Meals and Glycemic Changes on QT Interval Dynamics.J Clin Pharmacol. 2017 Aug;57(8):966-976. doi: 10.1002/jcph.933. Epub 2017 May 22. J Clin Pharmacol. 2017. PMID: 28543601 Free PMC article. Clinical Trial.
-
Estimation of the Power of the Food Effect on QTc to Show Assay Sensitivity.J Clin Pharmacol. 2018 Jan;58(1):81-88. doi: 10.1002/jcph.975. Epub 2017 Aug 17. J Clin Pharmacol. 2018. PMID: 28833240 Free PMC article. Clinical Trial.
References
-
- US Department of Health and Human Services Food and Drug Administration , Center for Drug Evaluation and Research , Center for Biologics Evaluation and Research . Guidance for Industry. E14 Clinical Evaluation of QT/QTc Interval Prolongation and Proarrhythmic Potential for Non‐Antiarrhythmic Drugs . 2005. http://www.fda.gov/downloads/drugs/guidancecomplianceregulatoryinformati....
-
- Malik M. Problems of heart rate correction in assessment of drug‐induced QT interval prolongation. J Cardiovasc Electrophysiol. 2001;12(4):411–420. - PubMed
-
- Malik M, Garnett CE, Zhang J. Thorough QT studies: questions and quandaries. Drug Saf. 2010;33(1):1–14. - PubMed
-
- Garnett CE, Beasley N, Bhattaram VA, et al. Concentration‐QT relationships play a key role in the evaluation of proarrhythmic risk during regulatory review. J Clin Pharmacol. 2008;48(1):13–18. - PubMed
Publication types
MeSH terms
Substances
LinkOut - more resources
Full Text Sources
Other Literature Sources
Medical

