

LC-MS/MS isomeric profiling of permethylated N-glycans derived from serum haptoglobin of hepatocellular carcinoma (HCC) and cirrhotic patients
- PMID: 28543513
- PMCID: PMC5613657
- DOI: 10.1002/elps.201700025
LC-MS/MS isomeric profiling of permethylated N-glycans derived from serum haptoglobin of hepatocellular carcinoma (HCC) and cirrhotic patients
Abstract
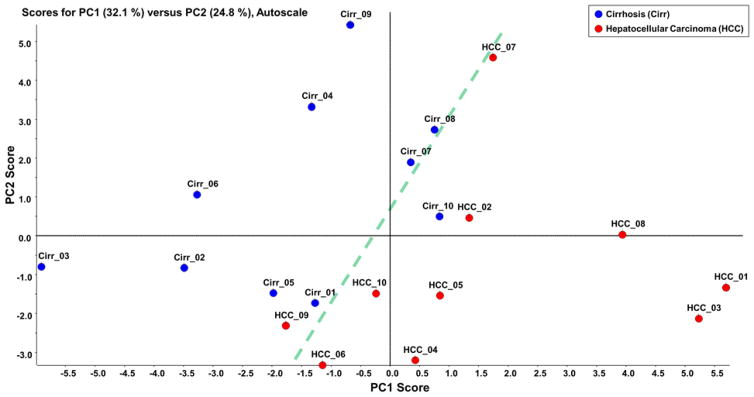
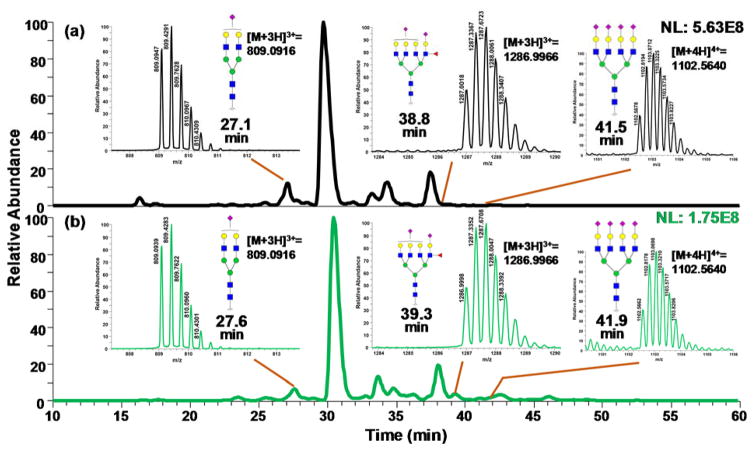
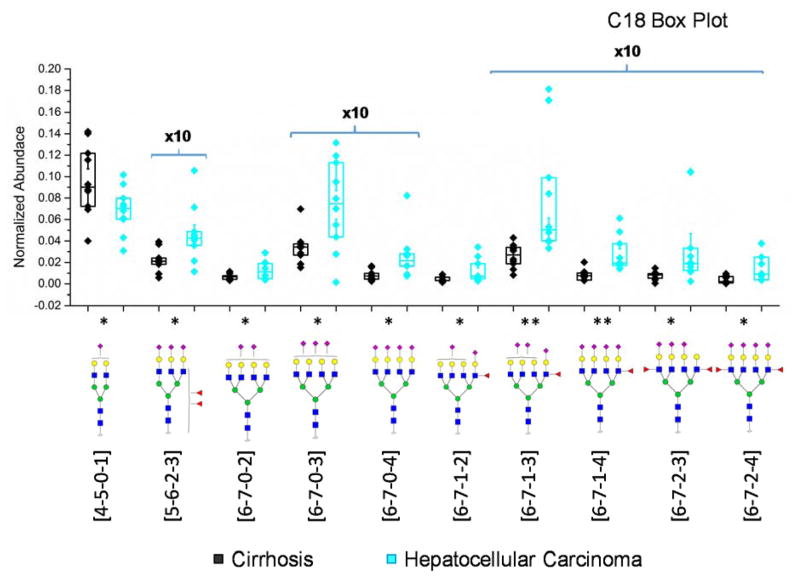
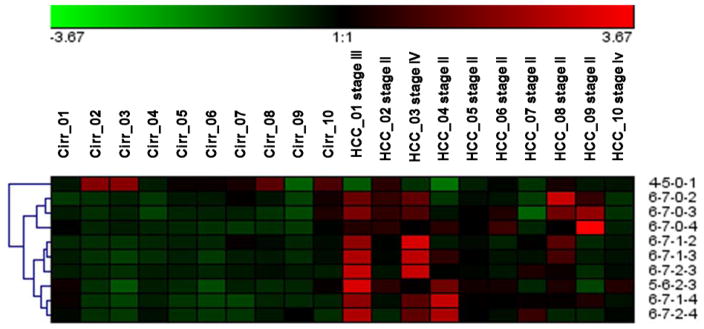
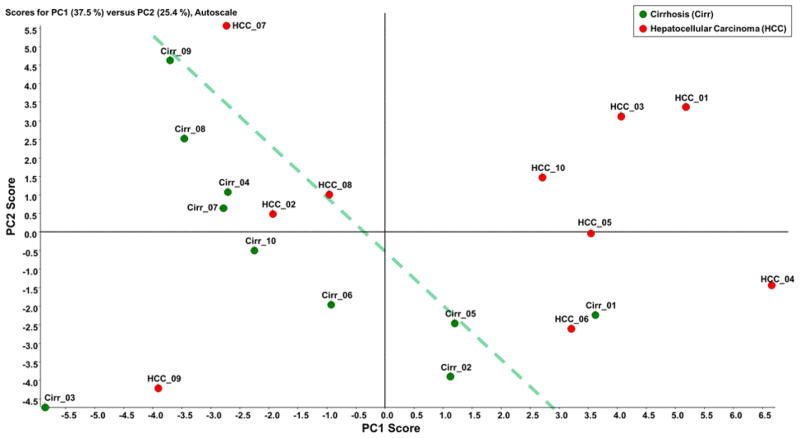
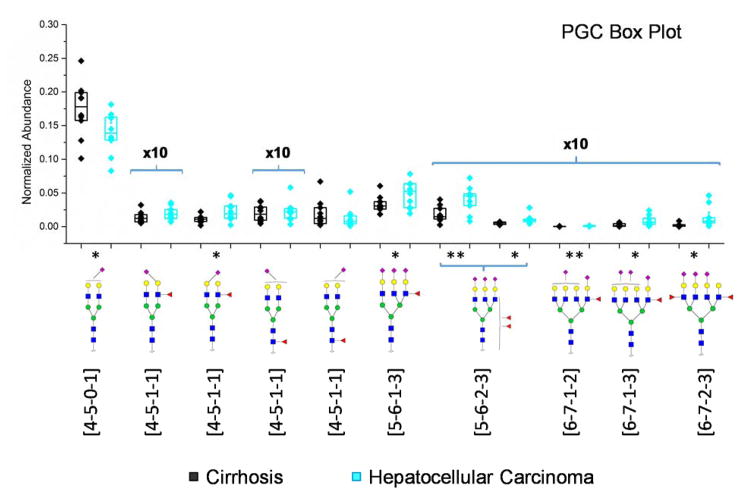
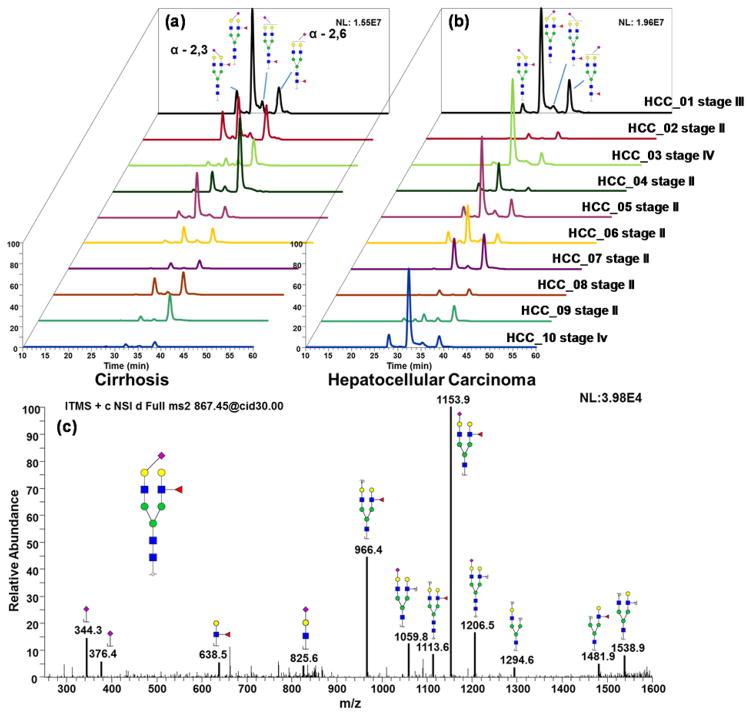
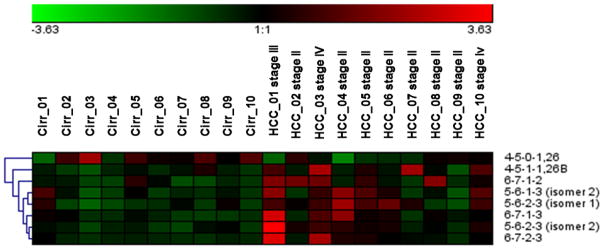
Early stage detection and cancer treatment demand the identification of reliable biomarkers. Over the past decades, efforts have been devoted to assess the variation of glycosylation level as well as the glycan structures of proteins in blood or serum, associated with the development and/or progression of several cancers, including liver. Herein, an LC-MS/MS-based analysis was conducted to define the glycosylation patterns of haptoglobin glycoprotein derived from sera collected from cirrhotic and hepatocellular carcinoma (HCC) patients. The haptoglobin samples were extracted from serum using an antibody-immobilized column prior to the release of N-glycans. A comparison of non-isomeric and isomeric permethylated glycan forms was achieved using C18 and porous graphitic carbon (PGC) columns, respectively. In the case of C18-LC-MS/MS analysis, 25 glycan structures were identified of which 10 sialylated structures were found to be statistically significant between the two cohorts. Also, 8 out of 34 glycan structures identified by PGC-LC-MS/MS were found to be statistically significant, suggesting that isomeric distributions of a particular glycan composition were different in abundances between the two cohorts. The glycan isoform patterns distinguished early stage HCC from cirrhotic patients. Both retention times and tandem mass spectra were utilized to determine the specific isomeric glycan structures. All of the glycan isomers, which were statistically significant, were either branch fucosylated or composed of α-2,6 linked sialic acid moieties. The result of this study demonstrates the potential importance of isomeric separation for defining disease prompted aberrant glycan changes. The levels of several glycan isoforms effectively distinguished early stage HCC from cirrhosis.
Keywords: Cirrhosis; Glycans biomarker discovery; Hepatocellular carcinoma; Isomeric separation; LC-MS/MS; Permethylated glycans.
© 2017 WILEY-VCH Verlag GmbH & Co. KGaA, Weinheim.
Figures
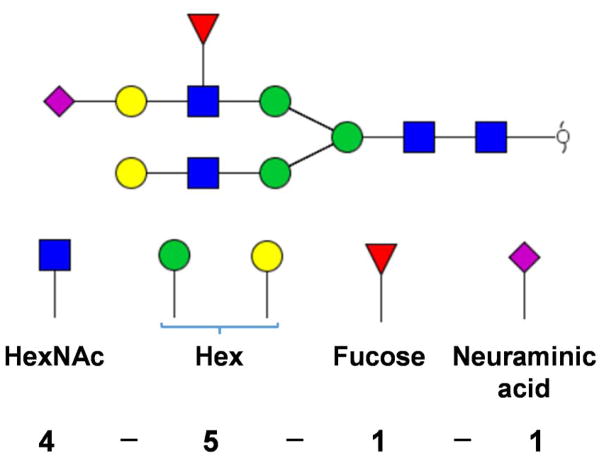
 , GlcNAc;
 , mannose;
 galactose;
 , fucose;
 , N-acetylneuraminic acid.
References
-
- Ferlay J, Shin HR, Bray F, Forman D, Mathers C, Parkin DM. Int J Cancer. 2010;127:2893–2917. - PubMed
-
- Kamangar F, Dores GM, Anderson WF. J Clin Oncol. 2006;24:2137–2150. - PubMed
-
- Yin X, Zheng SS, Zhang L, Xie XY, Wang Y, Zhang BH, Wu W, Qiu S, Ren ZG. Gene. 2017;596:53–88. - PubMed
-
- El-Serag HB. N Engl J Med. 2011;365:1118–1127. - PubMed
-
- Llovet JM, Bru C, Bruix J. Semin Liver Dis. 1999;19:329–338. - PubMed
Publication types
MeSH terms
Substances
Grants and funding
LinkOut - more resources
Full Text Sources
Other Literature Sources
Medical
Miscellaneous
