. 2017 Oct;66(4):1197-1218.
doi: 10.1002/hep.29284. Epub 2017 Aug 26.

TGR5 contributes to hepatic cystogenesis in rodents with polycystic liver diseases through cyclic adenosine monophosphate/Gαs signaling

Affiliations

TGR5 contributes to hepatic cystogenesis in rodents with polycystic liver diseases through cyclic adenosine monophosphate/Gαs signaling

Tatyana V Masyuk et al. Hepatology. 2017 Oct.

Abstract

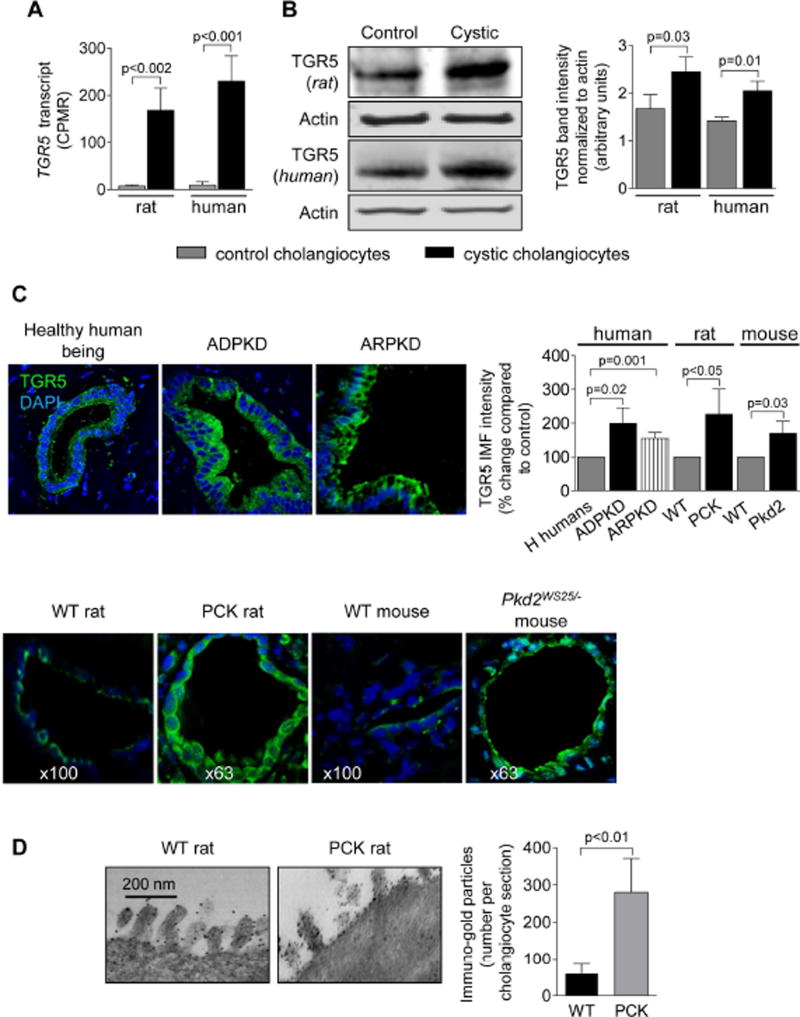
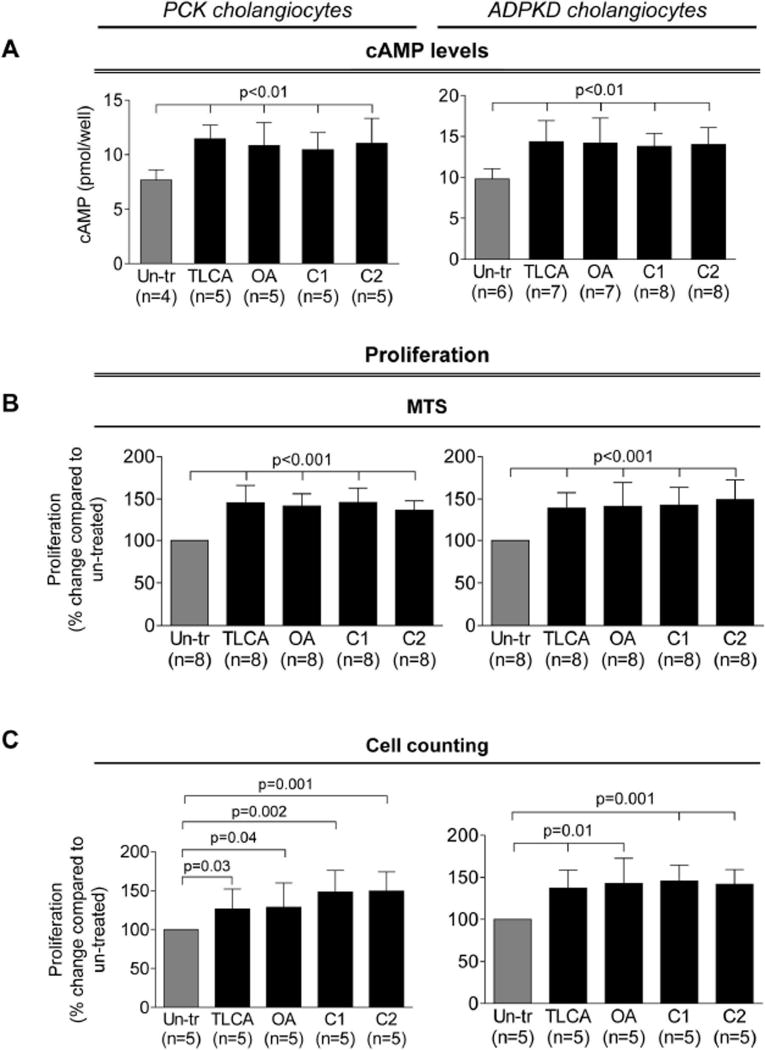
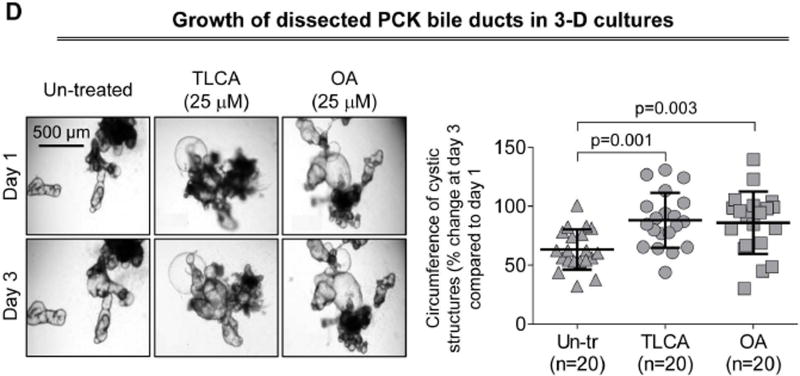
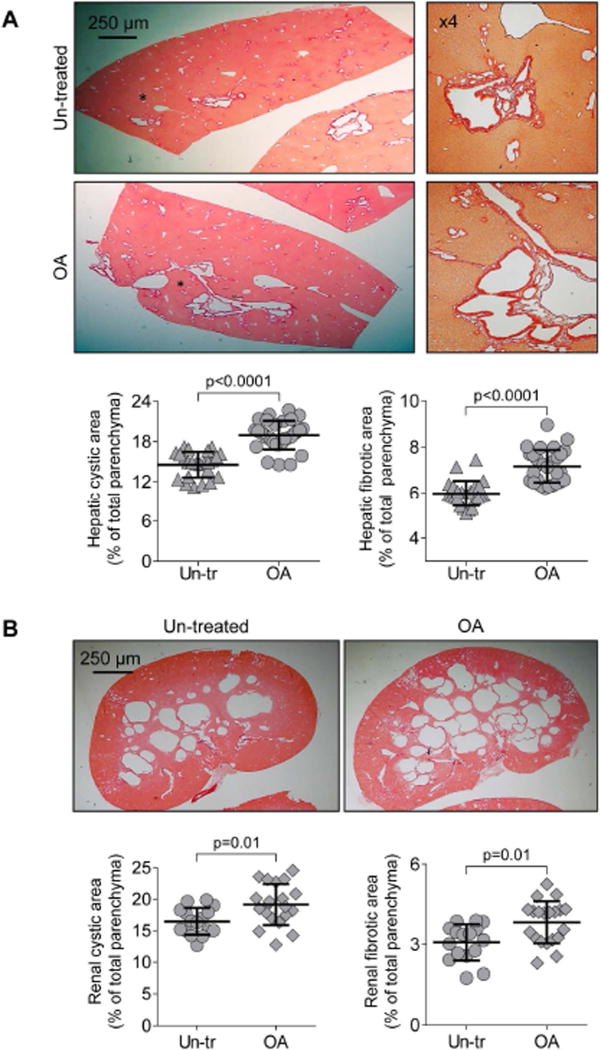
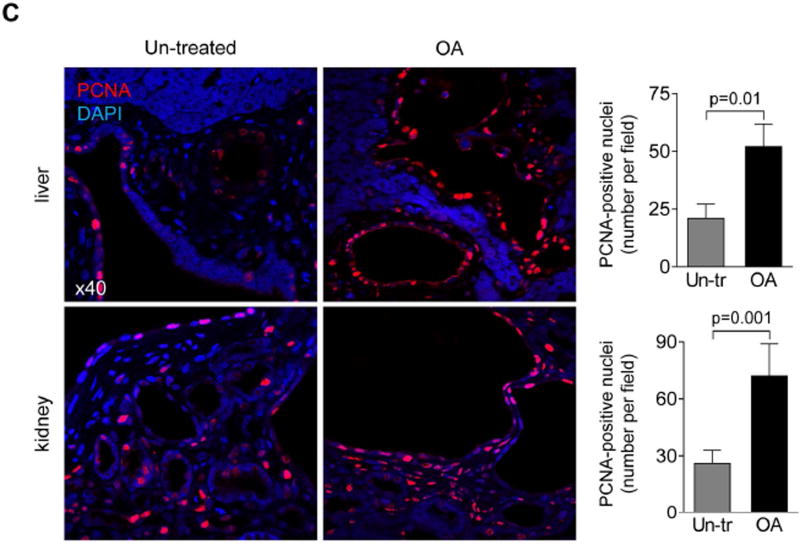
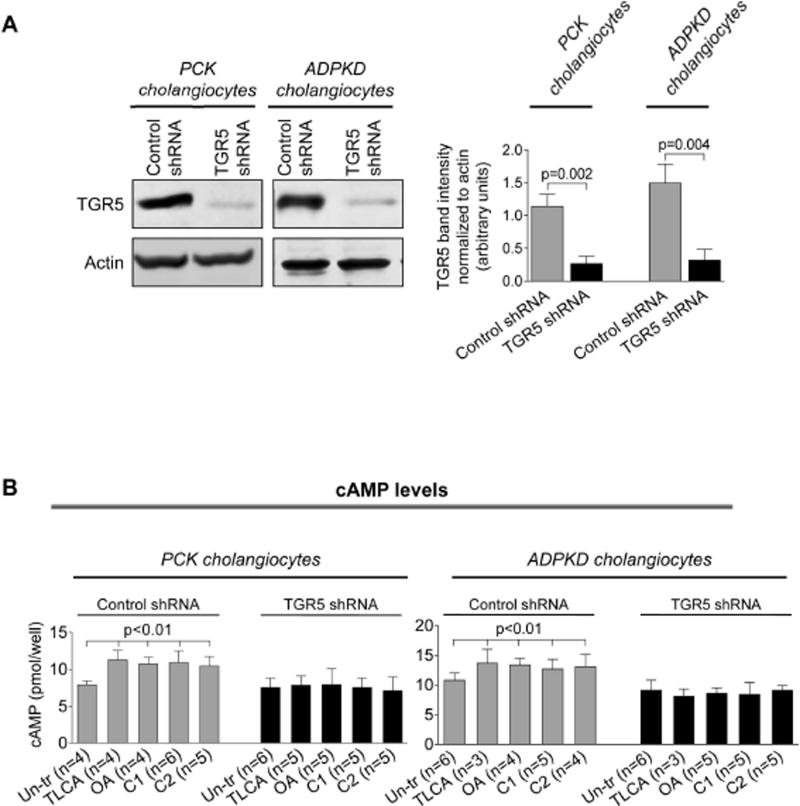
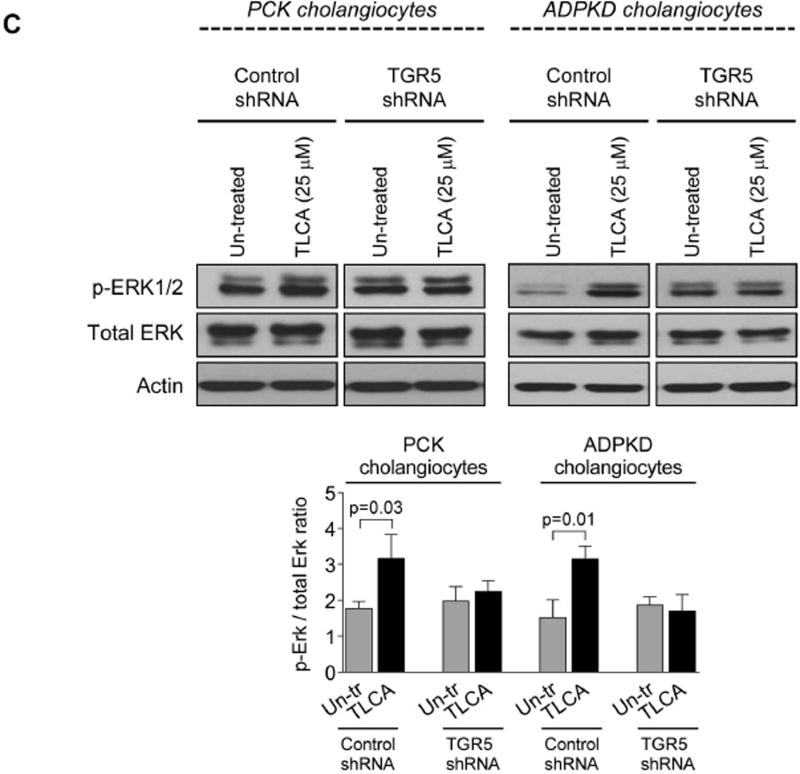
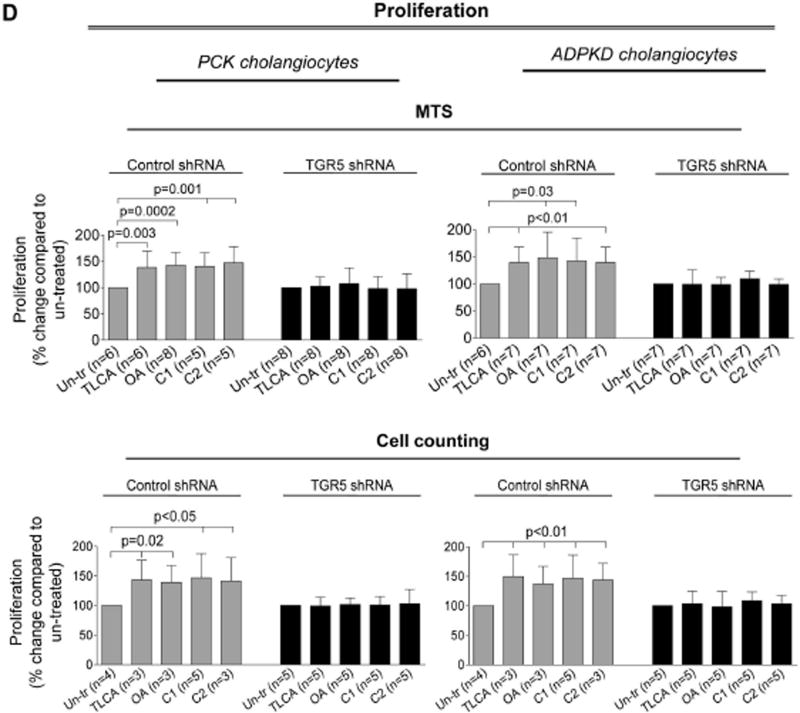
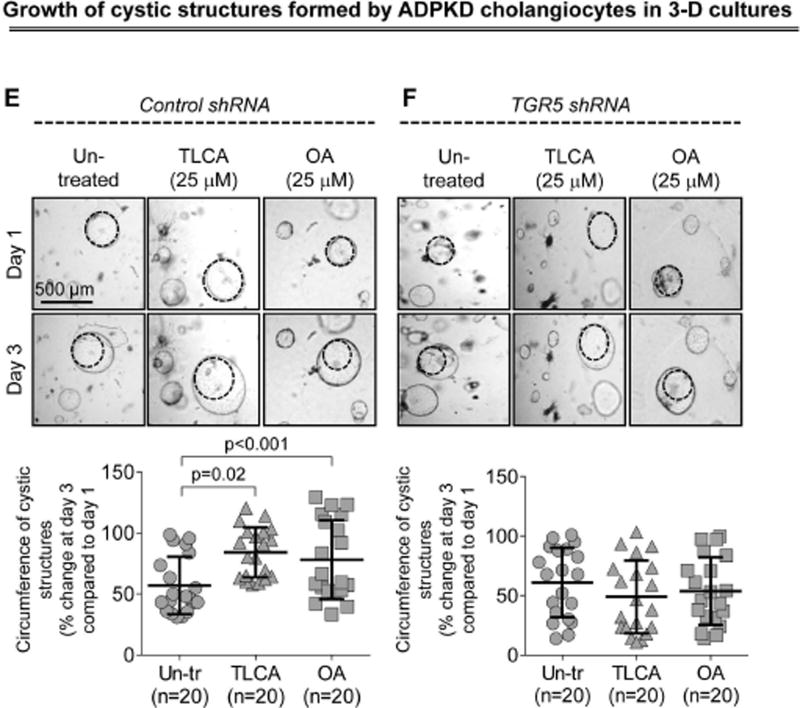
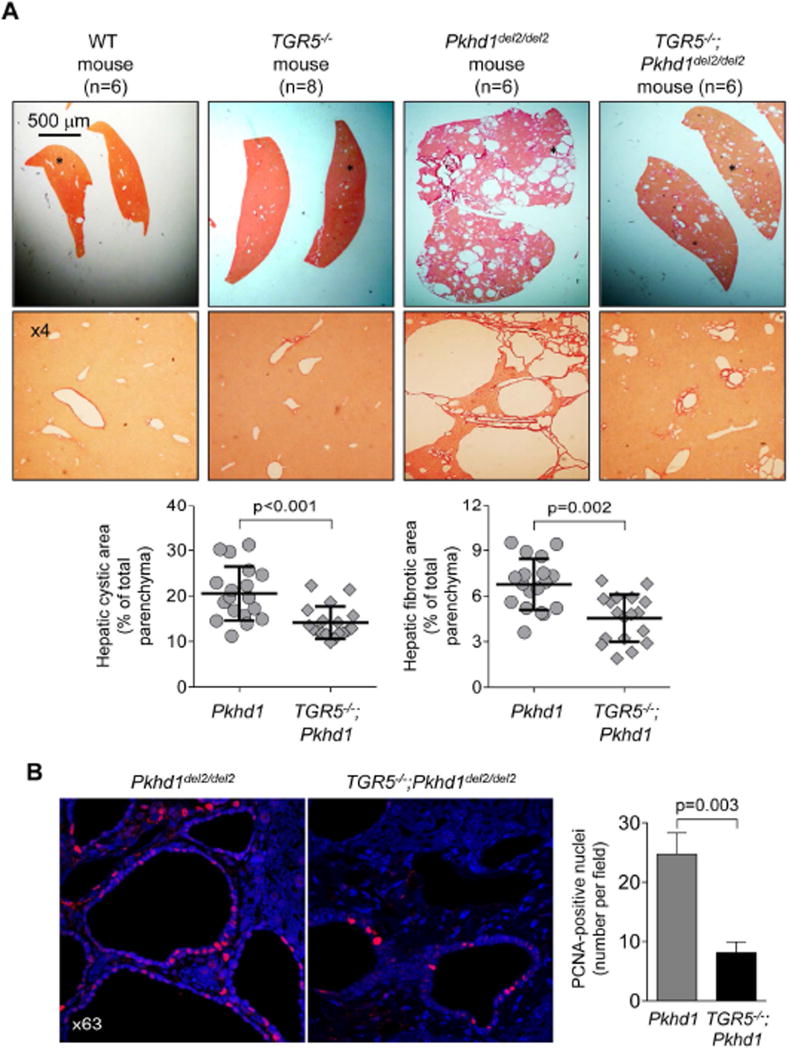
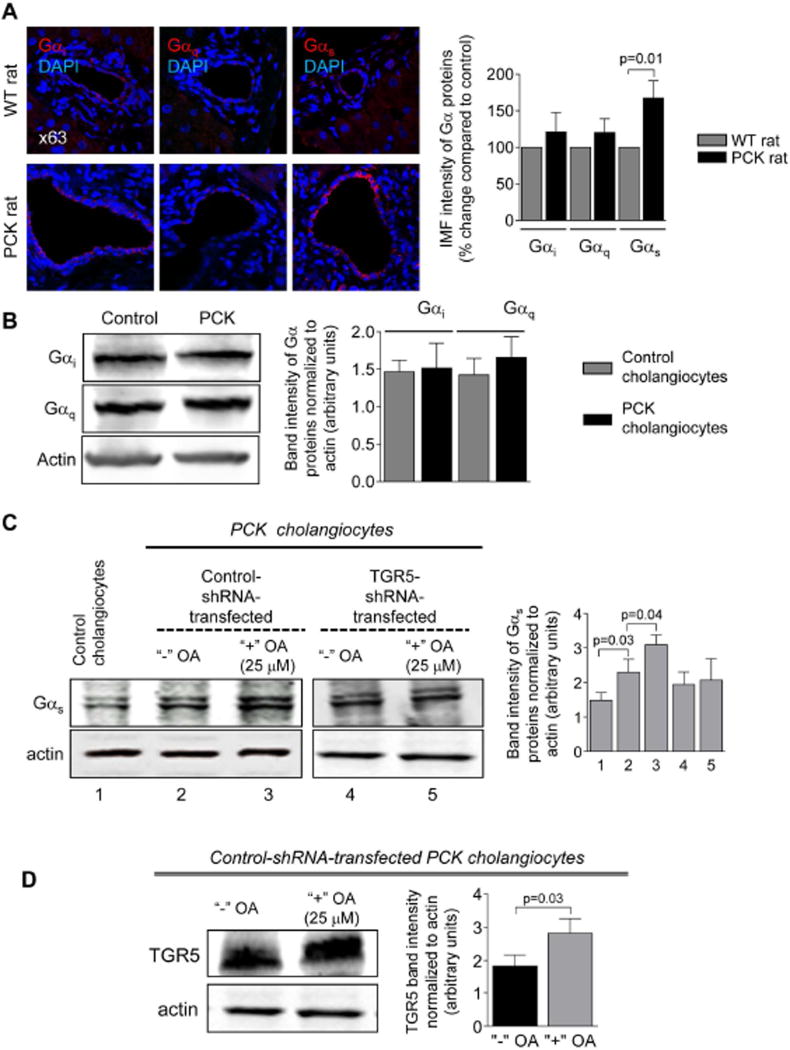
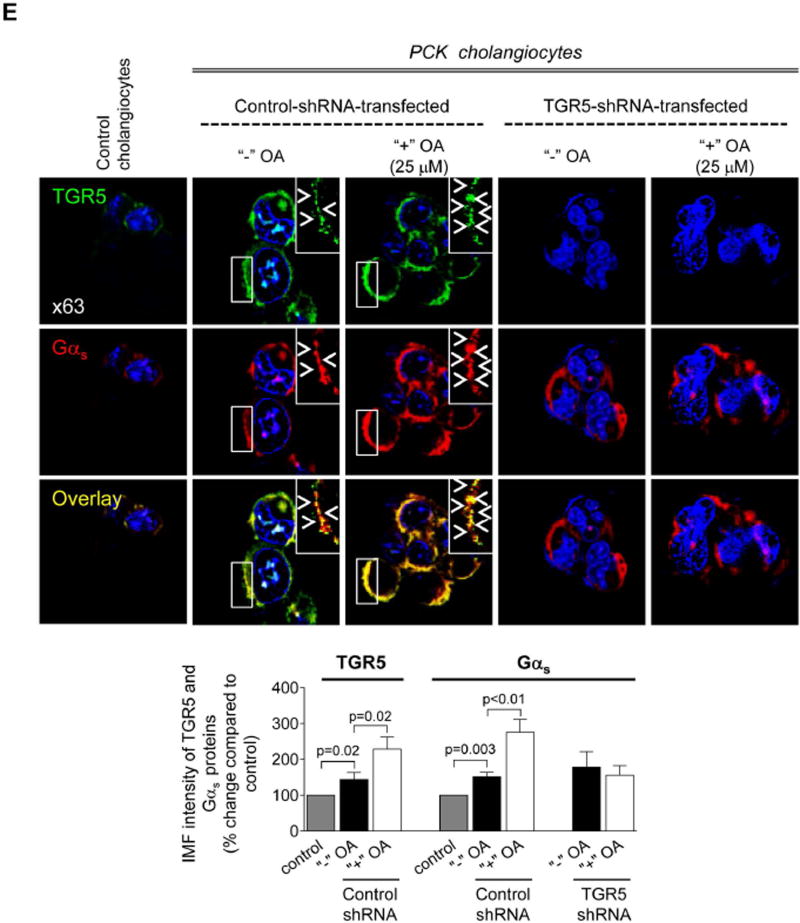
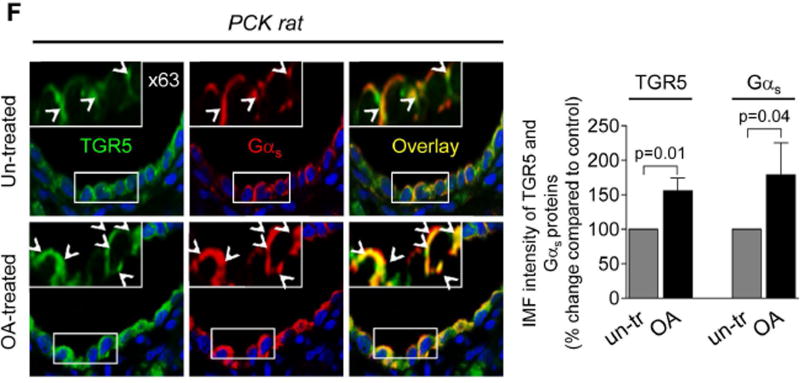
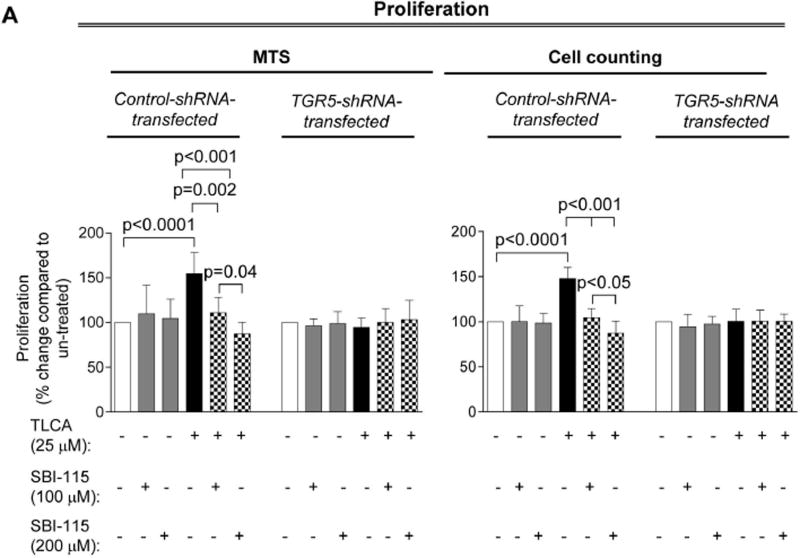
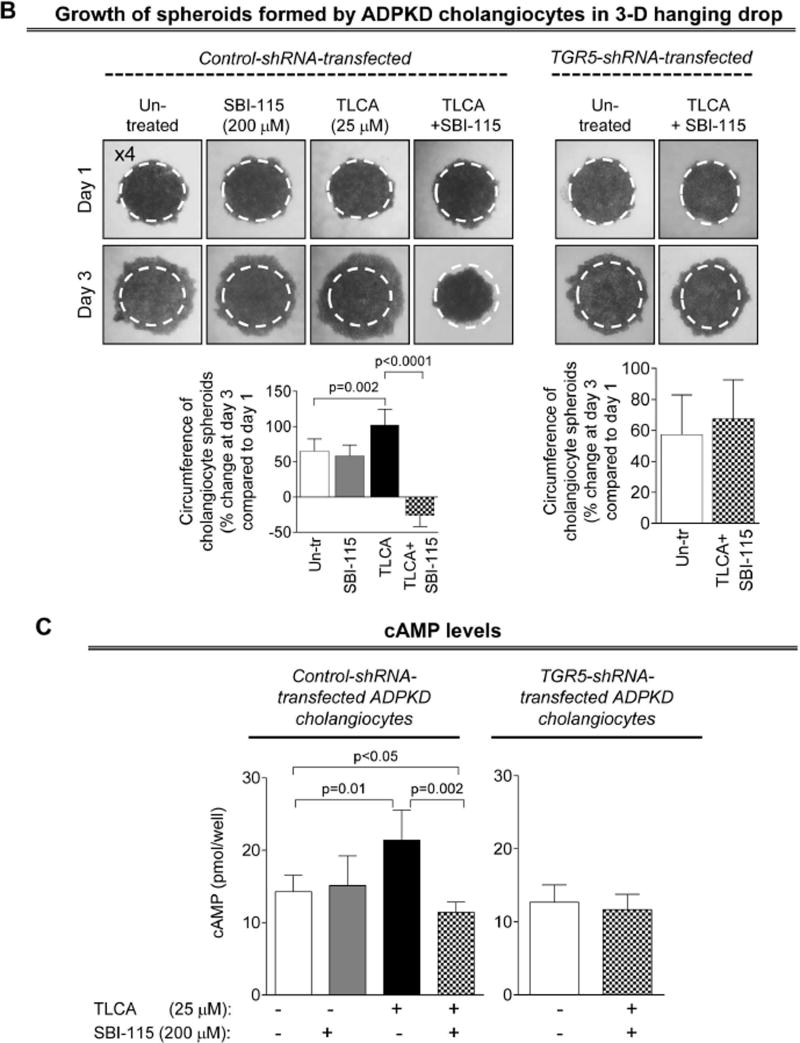
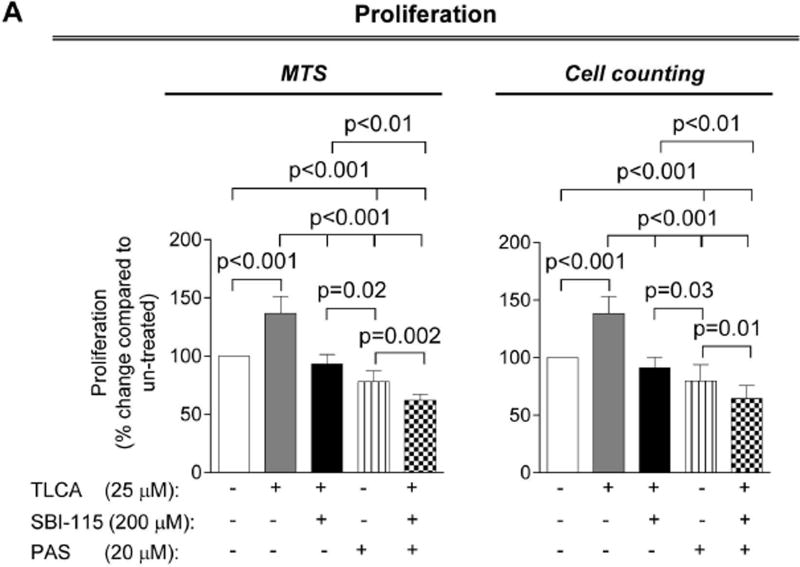
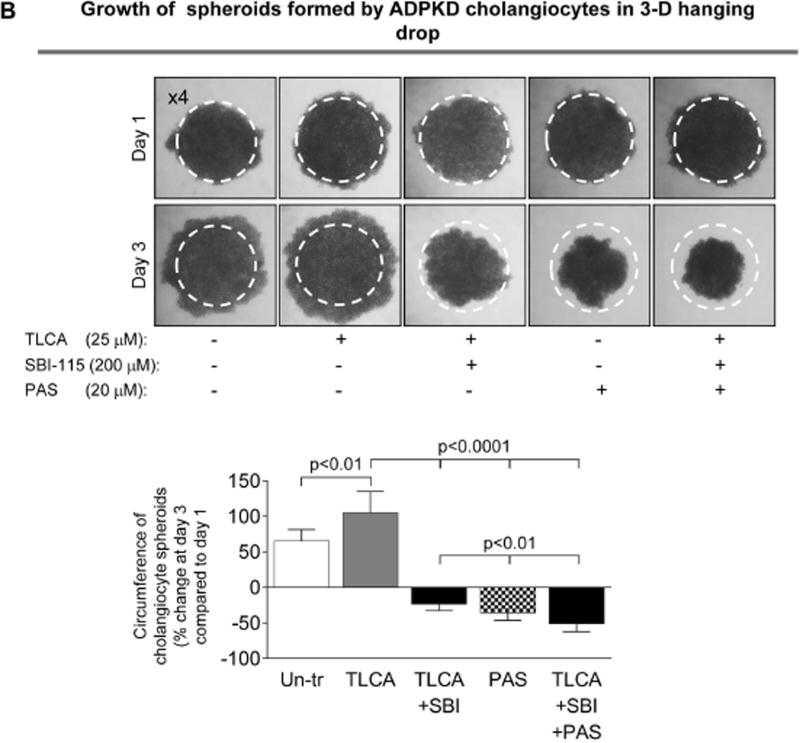
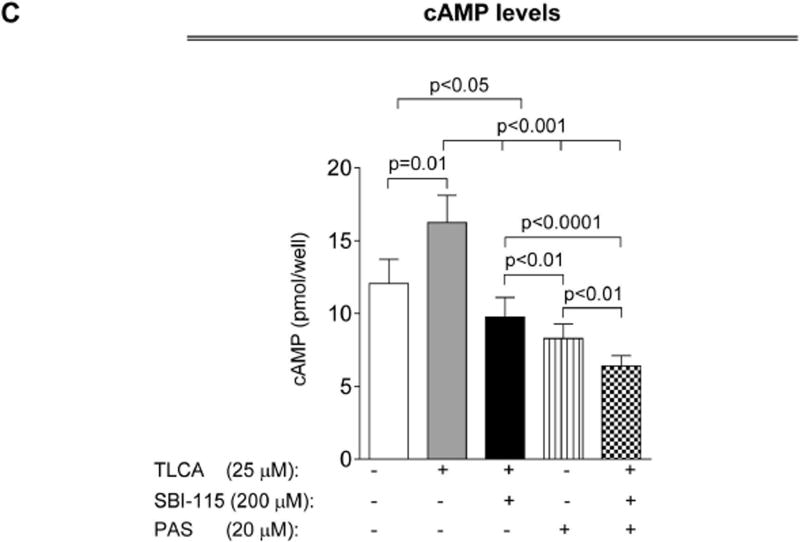
Hepatic cystogenesis in polycystic liver disease is associated with increased levels of cyclic adenosine monophosphate (cAMP) in cholangiocytes lining liver cysts. Takeda G protein receptor 5 (TGR5), a G protein-coupled bile acid receptor, is linked to cAMP and expressed in cholangiocytes. Therefore, we hypothesized that TGR5 might contribute to disease progression. We examined expression of TGR5 and Gα proteins in cultured cholangiocytes and in livers of animal models and humans with polycystic liver disease. In vitro, we assessed cholangiocyte proliferation, cAMP levels, and cyst growth in response to (1) TGR5 agonists (taurolithocholic acid, oleanolic acid [OA], and two synthetic compounds), (2) a novel TGR5 antagonist (m-tolyl 5-chloro-2-[ethylsulfonyl] pyrimidine-4-carboxylate [SBI-115]), and (3) a combination of SBI-115 and pasireotide, a somatostatin receptor analogue. In vivo, we examined hepatic cystogenesis in OA-treated polycystic kidney rats and after genetic elimination of TGR5 in double mutant TGR5-/- ;Pkhd1del2/del2 mice. Compared to control, expression of TGR5 and Gαs (but not Gαi and Gαq ) proteins was increased 2-fold to 3-fold in cystic cholangiocytes in vitro and in vivo. In vitro, TGR5 stimulation enhanced cAMP production, cell proliferation, and cyst growth by ∼40%; these effects were abolished after TGR5 reduction by short hairpin RNA. OA increased cystogenesis in polycystic kidney rats by 35%; in contrast, hepatic cystic areas were decreased by 45% in TGR5-deficient TGR5-/- ;Pkhd1del2/del2 mice. TGR5 expression and its colocalization with Gαs were increased ∼2-fold upon OA treatment. Levels of cAMP, cell proliferation, and cyst growth in vitro were decreased by ∼30% in cystic cholangiocytes after treatment with SBI-115 alone and by ∼50% when SBI-115 was combined with pasireotide.

Conclusion: TGR5 contributes to hepatic cystogenesis by increasing cAMP and enhancing cholangiocyte proliferation; our data suggest that a TGR5 antagonist alone or concurrently with somatostatin receptor agonists represents a potential therapeutic approach in polycystic liver disease. (Hepatology 2017;66:1197-1218).


Conflict of interest statement

Conflict of interest: The authors have declared no conflicts of interest exist.

Figures

Figure 1
Figure 1
TGR5 is over-expressed in PLD. (A) Higher copy numbers of TGR5 transcript per million reads (CPMR) were observed in cultured cystic cholangiocytes. n=3 for each cell line. (B) Representative western blotting and quantitation of TGR5 band density show increased levels of TGR5 protein in cystic cholangiocytes. n=3 for each cell line. (C) Representative images and quantitation of relative TGR5 IMF intensity confirm up-regulation of TGR5 protein in humans and rodents with PLD. n=5 livers for each condition. Nuclei stained with DAPI. (D) IG-EM images and quantitation analysis show the increased numbers of TGR5-positive immuno-gold particles along apical membrane and microvilli of cholangiocytes in PCK rats. n=10 cholangiocyte sections per group. Data are presented as MEAN±SD. Abbreviation: IMF – immunofluorescence, H humans – healthy humans, WT – wild type.
Figure 2
Figure 2
TGR5 agonists increases cAMP levels, cell proliferation and cyst growth in 3-D cultures. (A) TLCA, OA, C1 and C2 (all, 25 µM) enhanced cAMP production in rat and human cystic cholangiocytes compared to un-treated cholangiocytes. (B) All four TGR5 agonists increase cholangiocyte proliferation assessed by MTS absorbance and (C) cell counting. (D) Representative images and scatter plots demonstrate accelerated expansion of freshly dissected PCK bile ducts upon treatment with TLCA and OA. All data are presented as MEAN±SD. Abbreviation: Un-tr – un-treated.
Figure 2
Figure 2
TGR5 agonists increases cAMP levels, cell proliferation and cyst growth in 3-D cultures. (A) TLCA, OA, C1 and C2 (all, 25 µM) enhanced cAMP production in rat and human cystic cholangiocytes compared to un-treated cholangiocytes. (B) All four TGR5 agonists increase cholangiocyte proliferation assessed by MTS absorbance and (C) cell counting. (D) Representative images and scatter plots demonstrate accelerated expansion of freshly dissected PCK bile ducts upon treatment with TLCA and OA. All data are presented as MEAN±SD. Abbreviation: Un-tr – un-treated.
Figure 3
Figure 3
Oleanolic acid (OA) increases hepatic and renal cystogenesis in PCK rats. Drug-treated rats (n=5 females; n=5 males) received daily injection of OA (25 mg/kg) and control group (n=4 females, n=4 males) were injected with equal doses of DMSO for 6 weeks. (A) Representative images of picrosirius red stained liver and (B) kidney sections of un-treated and OA-treated PCK rats. Area depicted by asterisk (A, left panels) is shown at higher magnification on right. Scatter plots depict cystic and fibrotic areas of individual liver lobes (three liver lobes from each rat) and kidneys (two kidneys from each rat) analyzed. (C) Representative images of liver and kidney section from un-treated and OA-treated PCK rats stained with PCNA antibody and quantitative analysis show a greater number of PCNA-positive nuclei after OA treatment. n=15 microscopic fields for each organ and group. Abbreviation: Un-tr – un-treated. All data are presented as MEAN±SD.
Figure 3
Figure 3
Oleanolic acid (OA) increases hepatic and renal cystogenesis in PCK rats. Drug-treated rats (n=5 females; n=5 males) received daily injection of OA (25 mg/kg) and control group (n=4 females, n=4 males) were injected with equal doses of DMSO for 6 weeks. (A) Representative images of picrosirius red stained liver and (B) kidney sections of un-treated and OA-treated PCK rats. Area depicted by asterisk (A, left panels) is shown at higher magnification on right. Scatter plots depict cystic and fibrotic areas of individual liver lobes (three liver lobes from each rat) and kidneys (two kidneys from each rat) analyzed. (C) Representative images of liver and kidney section from un-treated and OA-treated PCK rats stained with PCNA antibody and quantitative analysis show a greater number of PCNA-positive nuclei after OA treatment. n=15 microscopic fields for each organ and group. Abbreviation: Un-tr – un-treated. All data are presented as MEAN±SD.
Figure 4
Figure 4
Depletion of TGR5 abolishes effects of its agonists on cAMP levels, Erk1/2 phosphorylation, cell proliferation and cyst growth. (A) Representative western blots and quantitation of TGR5 band density demonstrate reduced expression of TGR5 in cystic cholangiocytes stably transfected with TGR5 shRNA compared to control-shRNA-transfected cholangiocytes. n=3 for each cell line. (B) Levels of cAMP were increased in response to treatment with TGR5 agonists (all, 25 µM) in cholangiocytes transfected with control shRNA but not TGR5 shRNA. (C) Representative western blots and quantitation analysis demonstrate that TLCA increased Erk phosphorylation in control-shRNA-transfected rat and human cystic cholangiocytes but not in TGR5-shRNA depleted cells. n=3 for each cell line. (D) Stimulation of control-shRNA-transfected cholangiocytes with TGR5 agonists (all, 25 µM) accelerated their proliferation; these effects were abolished in TGR5-depleted cells. (E) Representative images and scatter plots show that growth of cysts formed by control-shRNA-transfected ADPKD cholangiocytes is increased in response to TGR5 agonists compared to un-treated controls. (F) No differences in circumference of cystic structures formed by cholangiocytes transfected with TGR5 shRNA were observed in the absence or presence of TGR5 agonists. All data are presented as MEAN±SD. Abbreviation: Un-tr – un-treated.
Figure 4
Figure 4
Depletion of TGR5 abolishes effects of its agonists on cAMP levels, Erk1/2 phosphorylation, cell proliferation and cyst growth. (A) Representative western blots and quantitation of TGR5 band density demonstrate reduced expression of TGR5 in cystic cholangiocytes stably transfected with TGR5 shRNA compared to control-shRNA-transfected cholangiocytes. n=3 for each cell line. (B) Levels of cAMP were increased in response to treatment with TGR5 agonists (all, 25 µM) in cholangiocytes transfected with control shRNA but not TGR5 shRNA. (C) Representative western blots and quantitation analysis demonstrate that TLCA increased Erk phosphorylation in control-shRNA-transfected rat and human cystic cholangiocytes but not in TGR5-shRNA depleted cells. n=3 for each cell line. (D) Stimulation of control-shRNA-transfected cholangiocytes with TGR5 agonists (all, 25 µM) accelerated their proliferation; these effects were abolished in TGR5-depleted cells. (E) Representative images and scatter plots show that growth of cysts formed by control-shRNA-transfected ADPKD cholangiocytes is increased in response to TGR5 agonists compared to un-treated controls. (F) No differences in circumference of cystic structures formed by cholangiocytes transfected with TGR5 shRNA were observed in the absence or presence of TGR5 agonists. All data are presented as MEAN±SD. Abbreviation: Un-tr – un-treated.
Figure 5
Figure 5
Hepatic cystogenesis and cholangiocyte proliferation is decreased in double mutant TGR5−/−;Pkhd1del2/del2 mice. (A) Representatives liver section stained with picrosirius red show that cysts were absent in age- (5–7 month old) and sex-matched wild type (WT; n=3 males, n=3 females) and TGR5−/− (n=3 males, n=5 females) rodents but present in Pkhd1del2/del2 mice (n=3 males, n=3 females); TGR5−/−;Pkhd1del2/del2 mice (n=3 males, n=3 females) have reduced hepatic cystogenesis. Asterisks in upper panel depict areas shown underneath with higher power. Scatter plots demonstrate that cystic and fibrotic areas are decreased in TGR5−/−;Pkhd1del2/del2 mice compared to Pkhd1del2/del2 littermates. Three liver lobes from each mouse were analyzed. (B) Number of PCNA-positive nuclei were greater in cholangiocytes of TGR5−/−;Pkhd1del2/del2 mice compared to Pkhd1del2/del2 rodents. n=20 microscopic cholangiocyte fields per group. All data are presented as MEAN±SD.
Figure 6
Figure 6
Expression of Gαs is increased in cystic cholangiocytes. (A) Representative images and quantitation of relative IMF intensity of Gα proteins demonstrate that levels of Gαi and Gαq were comparable in cholangiocytes of wild type (WT) and PCK rats while Gαs expression was increased in cystic cholangiocytes of PCK rats. n=5 livers for each group. (B) Representative western blots and quantitation of band intensity of Gα proteins further confirmed that Gαi and Gαq are equally expressed in cultured control (i.e., cholangiocytes derived from wild type rat) and cystic cholangiocytes. n=3 for each cell line. (C) Expression of Gαs protein was higher in PCK cholangiocytes compared to control as demonstrated by representative western blots (protein bands were numbered from 1 to 5) and quantitation of Gαs band intensity in the absence of TGR5 agonists (line 1 versus line 2). OA treatment increased Gαs levels in cholangiocytes transfected with control shRNA (line 2 versus line 3) but not in TGR5-shRNA-transfected cholangiocytes (line 4 versus line 5). No differences in Gαs expression was noticed between cholangiocytes transfected with control shRNA or TGR5 shRNA in the absence of treatment (line 2 versus line 4 and line 5). n=3 for each condition. (D) Representative western blots and quantitation of TGR5 band intensity show that OA treatment increases expression of TGR5 in cholangiocytes. n=3 for each condition. (E) Representative confocal images and quantitation of IMF intensity of Gαs and TGR5 confirmed that both proteins are over-expressed in cystic cholangiocytes and their immunoreactivity is further increases upon stimulation with OA. Co-localization of TGR5 with Gαs also increases after OA application. The arrows highlight some examples of co-localization. The upper right insets show higher power of the areas outlined in the main panel. n=5 for each condition. (F) OA treatment also increased immunoreactivity of TGR5 and Gαs and their co-localization in cholangiocytes of PCK rats. The arrows highlight some examples of co-localization. The upper left insets show higher power of the areas outlined in the main panel. Representative of 4–5 rats per group. All data are presented as MEAN±SD.
Figure 6
Figure 6
Expression of Gαs is increased in cystic cholangiocytes. (A) Representative images and quantitation of relative IMF intensity of Gα proteins demonstrate that levels of Gαi and Gαq were comparable in cholangiocytes of wild type (WT) and PCK rats while Gαs expression was increased in cystic cholangiocytes of PCK rats. n=5 livers for each group. (B) Representative western blots and quantitation of band intensity of Gα proteins further confirmed that Gαi and Gαq are equally expressed in cultured control (i.e., cholangiocytes derived from wild type rat) and cystic cholangiocytes. n=3 for each cell line. (C) Expression of Gαs protein was higher in PCK cholangiocytes compared to control as demonstrated by representative western blots (protein bands were numbered from 1 to 5) and quantitation of Gαs band intensity in the absence of TGR5 agonists (line 1 versus line 2). OA treatment increased Gαs levels in cholangiocytes transfected with control shRNA (line 2 versus line 3) but not in TGR5-shRNA-transfected cholangiocytes (line 4 versus line 5). No differences in Gαs expression was noticed between cholangiocytes transfected with control shRNA or TGR5 shRNA in the absence of treatment (line 2 versus line 4 and line 5). n=3 for each condition. (D) Representative western blots and quantitation of TGR5 band intensity show that OA treatment increases expression of TGR5 in cholangiocytes. n=3 for each condition. (E) Representative confocal images and quantitation of IMF intensity of Gαs and TGR5 confirmed that both proteins are over-expressed in cystic cholangiocytes and their immunoreactivity is further increases upon stimulation with OA. Co-localization of TGR5 with Gαs also increases after OA application. The arrows highlight some examples of co-localization. The upper right insets show higher power of the areas outlined in the main panel. n=5 for each condition. (F) OA treatment also increased immunoreactivity of TGR5 and Gαs and their co-localization in cholangiocytes of PCK rats. The arrows highlight some examples of co-localization. The upper left insets show higher power of the areas outlined in the main panel. Representative of 4–5 rats per group. All data are presented as MEAN±SD.
Figure 7
Figure 7
SBI-115 decreases proliferation, growth of cholangiocyte spheroids in vitro and cAMP levels in ADPKD cholangiocytes. (A) SBI-115 alone had no effect on cholangiocyte proliferation. In contrast, proliferation triggered by pre-treatment of cystic cholangiocytes with TLCA was inhibited in response to SBI-115 in a dose-dependent fashion. n=15 for each condition. (B) Representative images of cholangiocyte spheroids and quantitative assessment show that SBI-115 alone did not affect their growth while TLCA-induced spheroid expansion was decreased upon treatment with TGR5 antagonist. n=8 for each condition. (C) Levels of cAMP in ADPKD cholangiocytes stimulated with TLCA were inhibited by SBI-115. n=8 for each condition. The effects of SBI-115 were absent in TGR5-depleted ADPKD cholangiocytes. All data are presented as MEAN±SD.
Figure 7
Figure 7
SBI-115 decreases proliferation, growth of cholangiocyte spheroids in vitro and cAMP levels in ADPKD cholangiocytes. (A) SBI-115 alone had no effect on cholangiocyte proliferation. In contrast, proliferation triggered by pre-treatment of cystic cholangiocytes with TLCA was inhibited in response to SBI-115 in a dose-dependent fashion. n=15 for each condition. (B) Representative images of cholangiocyte spheroids and quantitative assessment show that SBI-115 alone did not affect their growth while TLCA-induced spheroid expansion was decreased upon treatment with TGR5 antagonist. n=8 for each condition. (C) Levels of cAMP in ADPKD cholangiocytes stimulated with TLCA were inhibited by SBI-115. n=8 for each condition. The effects of SBI-115 were absent in TGR5-depleted ADPKD cholangiocytes. All data are presented as MEAN±SD.
Figure 8
Figure 8
Concurrent treatment of ADPKD cholangiocytes by SBI-115 and pasireotide decreased cell proliferation, cholangiocyte spheroid growth and cAMP levels. Bar graphs, representative images of cholangiocyte spheroids and quantitative assessment demonstrate that SBI-115 alone and pasireotide alone or in combination decreased (A) proliferation of ADPKD cholangiocytes, (B) spheroid growth in 3-D and (C) cAMP levels. SBI-115 and pasireotide combination affected these processes to a higher extend than each drug alone. n=8 for each experimental condition. All data are presented as MEAN±SD.
Figure 8
Figure 8
Concurrent treatment of ADPKD cholangiocytes by SBI-115 and pasireotide decreased cell proliferation, cholangiocyte spheroid growth and cAMP levels. Bar graphs, representative images of cholangiocyte spheroids and quantitative assessment demonstrate that SBI-115 alone and pasireotide alone or in combination decreased (A) proliferation of ADPKD cholangiocytes, (B) spheroid growth in 3-D and (C) cAMP levels. SBI-115 and pasireotide combination affected these processes to a higher extend than each drug alone. n=8 for each experimental condition. All data are presented as MEAN±SD.

Similar articles

Cited by

References

    1. Wills ES, Roepman R, Drenth JP. Polycystic liver disease: ductal plate malformation and the primary cilium. Trends in molecular medicine. 2014 - PubMed
    1. Masyuk TV, Masyuk AI, La Russo NF. Therapeutic Targets In Polycystic Liver Disease. Current drug targets. 2015 - PMC - PubMed
    1. Perugorria MJ, Masyuk TV, Marin JJ, et al. Polycystic liver diseases: advanced insights into the molecular mechanisms. Nature reviews. Gastroenterology & hepatology. 2014 - PMC - PubMed
    1. Masyuk TV, Masyuk AI, Torres VE, et al. Octreotide inhibits hepatic cystogenesis in a rodent model of polycystic liver disease by reducing cholangiocyte adenosine 3',5'-cyclic monophosphate. Gastroenterology. 2007;132:1104–16. - PubMed
    1. Banales JM, Masyuk TV, Gradilone SA, et al. The cAMP effectors Epac and protein kinase a (PKA) are involved in the hepatic cystogenesis of an animal model of autosomal recessive polycystic kidney disease (ARPKD) Hepatology. 2009;49:160–74. - PMC - PubMed

Publication types

MeSH terms

Supplementary concepts