

Influence of Meals and Glycemic Changes on QT Interval Dynamics
- PMID: 28543601
- PMCID: PMC5518218
- DOI: 10.1002/jcph.933
Influence of Meals and Glycemic Changes on QT Interval Dynamics
Abstract
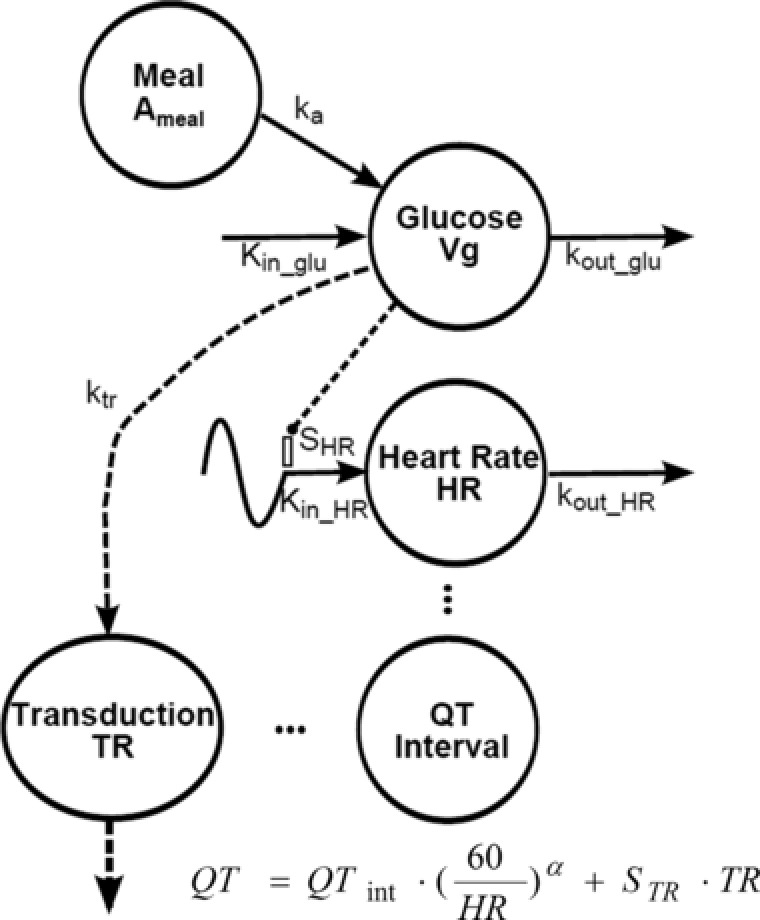
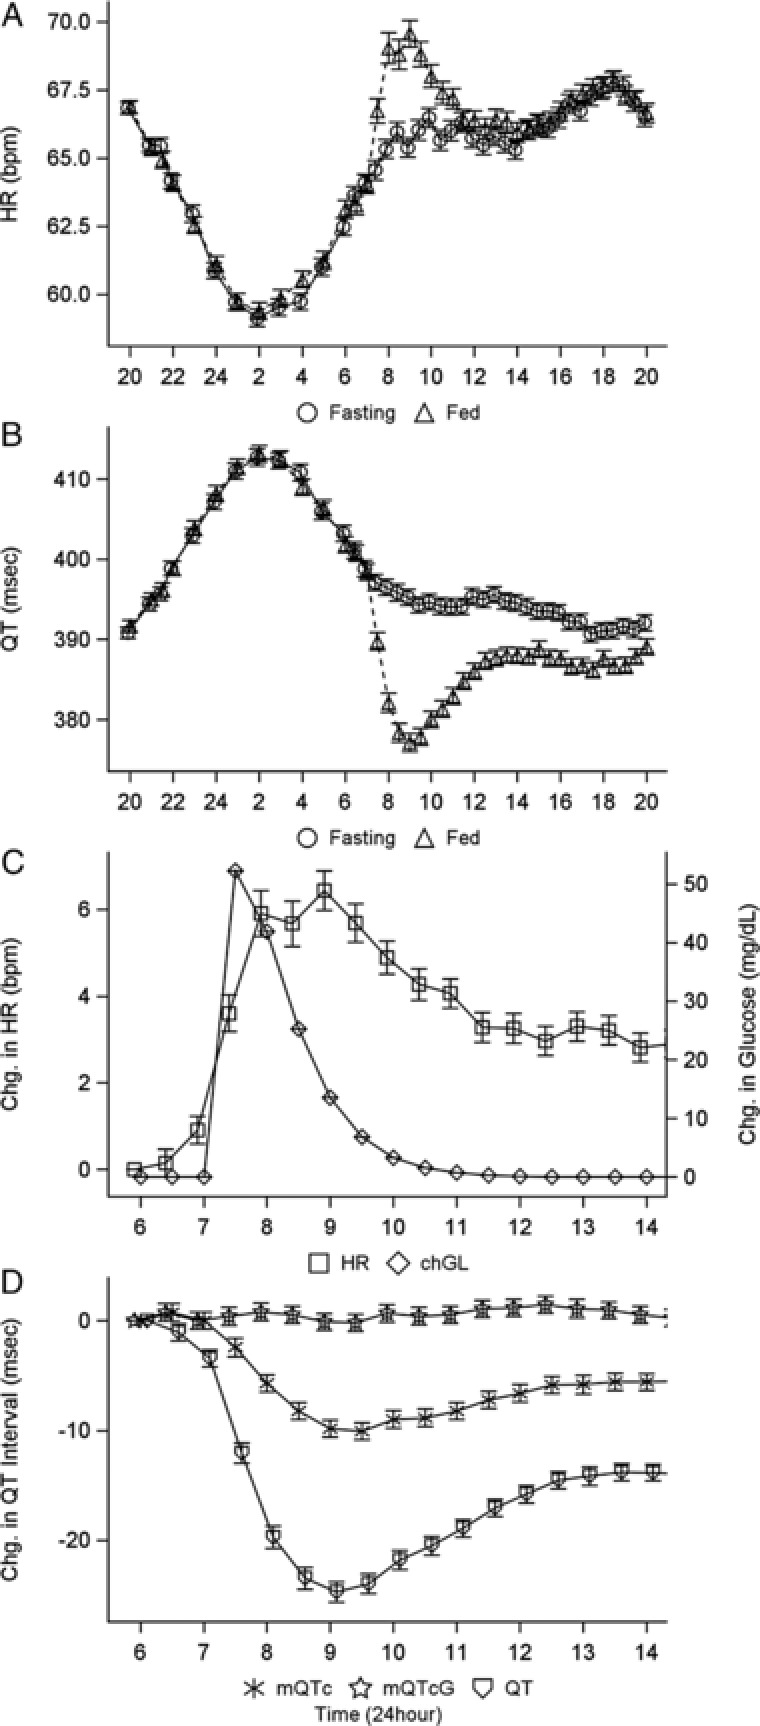
Thorough QT/QTc studies have become an integral part of early drug development programs, with major clinical and regulatory implications. This analysis expands on existing pharmacodynamic models of QT interval analysis by incorporating the influence of glycemic changes on the QT interval in a semimechanistic manner. A total of 21 healthy subjects enrolled in an open-label phase 1 pilot study and provided continuous electrocardiogram monitoring and plasma glucose and insulin concentrations associated with a 24-hour baseline assessment. The data revealed a transient decrease in QTc, with peak suppression occurring approximately 3 hours after the meal. A semimechanistic modeling approach was applied to evaluate temporal delays between meals and subsequent changes that might influence QT measurements. The food effect was incorporated into a model of heart rate dynamics, and additional delayed effects of the meal on QT were incorporated using a glucose-dependent hypothetical transit compartment. The final model helps to provide a foundation for the future design and analysis of QT studies that may be confounded by meals. This study has significant implications for QT study assessment following a meal or when a cohort is receiving a medication that influences postprandial glucose concentrations.
Keywords: QT interval; glucose; heart rate; mathematical modeling.
© 2017, The Authors. The Journal of Clinical Pharmacology published by Wiley Periodicals, Inc. on behalf of American College of Clinical Pharmacology.
Figures

Similar articles
-
Model-Based Evaluation of Exenatide Effects on the QT Interval in Healthy Subjects Following Continuous IV Infusion.J Clin Pharmacol. 2017 Aug;57(8):956-965. doi: 10.1002/jcph.882. Epub 2017 May 22. J Clin Pharmacol. 2017. PMID: 28543393 Free PMC article. Clinical Trial.
-
Insulin at normal physiological levels does not prolong QT(c) interval in thorough QT studies performed in healthy volunteers.Br J Clin Pharmacol. 2013 Feb;75(2):392-403. doi: 10.1111/j.1365-2125.2012.04376.x. Br J Clin Pharmacol. 2013. PMID: 22775199 Free PMC article. Clinical Trial.
-
Lack of effect of perampanel on QT interval duration: Results from a thorough QT analysis and pooled partial seizure Phase III clinical trials.Epilepsy Res. 2015 Aug;114:122-30. doi: 10.1016/j.eplepsyres.2015.04.010. Epub 2015 May 1. Epilepsy Res. 2015. PMID: 26088895 Clinical Trial.
-
Thorough QT study of the effect of oral moxifloxacin on QTc interval in the fed and fasted state in healthy Japanese and Caucasian subjects.Br J Clin Pharmacol. 2014 Jan;77(1):170-9. doi: 10.1111/bcp.12168. Br J Clin Pharmacol. 2014. PMID: 23713767 Free PMC article. Clinical Trial.
-
Effect of single doses of maraviroc on the QT/QTc interval in healthy subjects.Br J Clin Pharmacol. 2008 Apr;65 Suppl 1(Suppl 1):68-75. doi: 10.1111/j.1365-2125.2008.03138.x. Br J Clin Pharmacol. 2008. PMID: 18333868 Free PMC article. Clinical Trial.
Cited by
-
A Phase 1 Study to Investigate the Effects of Cortexolone 17α-Propionate, Also Known as Clascoterone, on the QT Interval Using the Meal Effect to Demonstrate ECG Assay Sensitivity.Clin Pharmacol Drug Dev. 2021 Jun;10(6):572-581. doi: 10.1002/cpdd.935. Epub 2021 May 3. Clin Pharmacol Drug Dev. 2021. PMID: 33942574 Free PMC article. Clinical Trial.
-
Estimation of the Power of the Food Effect on QTc to Show Assay Sensitivity.J Clin Pharmacol. 2018 Jan;58(1):81-88. doi: 10.1002/jcph.975. Epub 2017 Aug 17. J Clin Pharmacol. 2018. PMID: 28833240 Free PMC article. Clinical Trial.
-
Dasiglucagon Effects on QTc in Healthy Volunteers: A Randomized, Placebo-Controlled, Dose-Escalation, Double-Blind Study.Curr Ther Res Clin Exp. 2022 Mar 29;96:100668. doi: 10.1016/j.curtheres.2022.100668. eCollection 2022. Curr Ther Res Clin Exp. 2022. PMID: 35464292 Free PMC article.
-
Confirmation of the Cardiac Safety of PGF2α Receptor Antagonist OBE022 in a First-in-Human Study in Healthy Subjects, Using Intensive ECG Assessments.Clin Pharmacol Drug Dev. 2018 Nov;7(8):889-900. doi: 10.1002/cpdd.447. Epub 2018 Feb 28. Clin Pharmacol Drug Dev. 2018. PMID: 29489066 Free PMC article. Clinical Trial.
-
The Effect of Lower and Higher Calorie Meal on the Parameters of Ventricular Repolarization in Healthy Subjects.Open Access Maced J Med Sci. 2019 Jan 22;7(3):329-335. doi: 10.3889/oamjms.2019.084. eCollection 2019 Feb 15. Open Access Maced J Med Sci. 2019. PMID: 30833996 Free PMC article.
References
-
- Guidance for Industry . E14 Clinical evaluation of QT/QTc interval prolongation and proarrhythmic potential for non‐antiarrhythmic drugs. Rockville, MD: US Food and Drug Administration; 2005. http://www.fda.gov/downloads/Drugs/GuidanceComplianceRegulatoryInformati.... Accessed October 17, 2014. - PubMed
-
- Garnett CE, Beasley N, Bhattaram VA, et al. Concentration‐QT relationships play a key role in the evaluation of proarrhythmic risk during regulatory review. J Clin Pharmacol. 2008;48(1):13–18. - PubMed
-
- Malik M. Problems of heart rate correction in assessment of drug‐induced QT interval prolongation. J Cardiovasc Electrophysiol. 2001;12(4):411–420. - PubMed
-
- Malik M, Garnett CE, Zhang J. Thorough QT studies: questions and quandaries. Drug Saf. 2010;33(1):1–14. - PubMed
Publication types
MeSH terms
Substances
LinkOut - more resources
Full Text Sources
Other Literature Sources
Medical
