. 2018 Feb;47(2):418-424.
doi: 10.1002/jmri.25748. Epub 2017 May 25.

Cross-sectional correlation between hepatic R2* and proton density fat fraction (PDFF) in children with hepatic steatosis

Affiliations

Cross-sectional correlation between hepatic R2* and proton density fat fraction (PDFF) in children with hepatic steatosis

Adrija Mamidipalli et al. J Magn Reson Imaging. 2018 Feb.

Abstract

Purpose: To determine the relationship between hepatic proton density fat fraction (PDFF) and R2* in vivo.

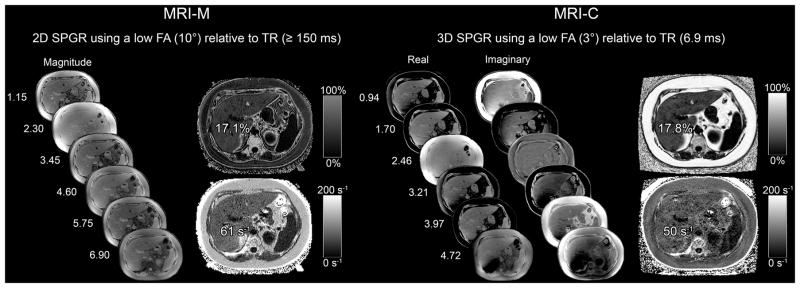
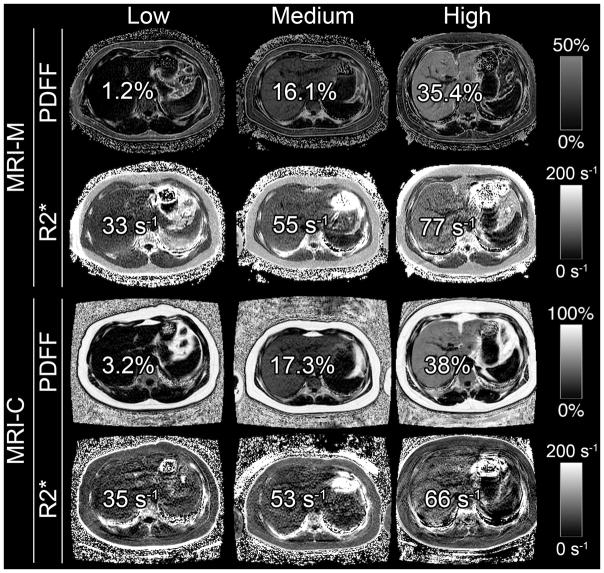
Materials and methods: In this Health Insurance Portability and Accountability Act (HIPAA)-compliant, Institutional Review Board (IRB)-approved, cross-sectional study, we conducted a secondary analysis of 3T magnetic resonance imaging (MRI) exams performed as part of prospective research studies in children in whom conditions associated with iron overload were excluded clinically. Each exam included low-flip-angle, multiecho magnitude (-M) and complex (-C) based chemical-shift-encoded MRI techniques with spectral modeling of fat to generate hepatic PDFF and R2* parametric maps. For each technique and each patient, regions of interest were placed on the maps in each of the nine Couinaud segments, and composite whole-liver PDFF and R2* values were calculated. Pearson's correlation coefficients between PDFF and R2* were computed for each MRI technique. Correlations were compared using Steiger's test.

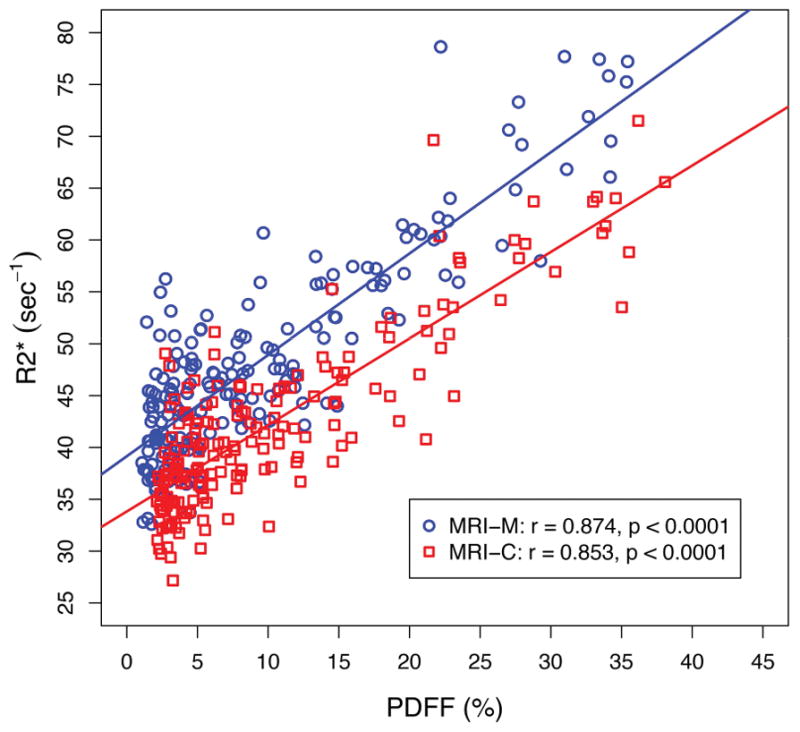
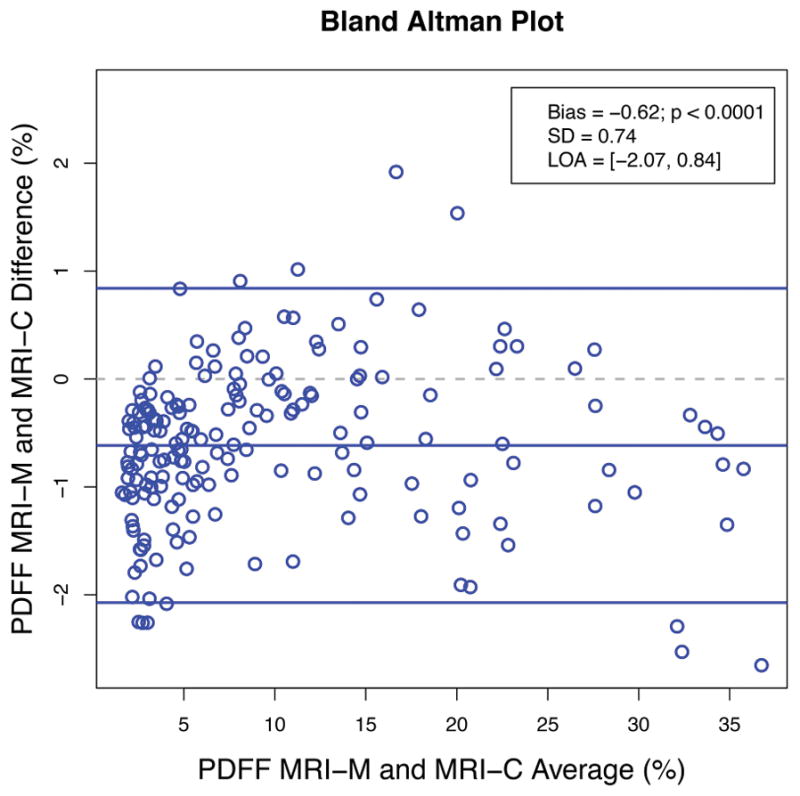
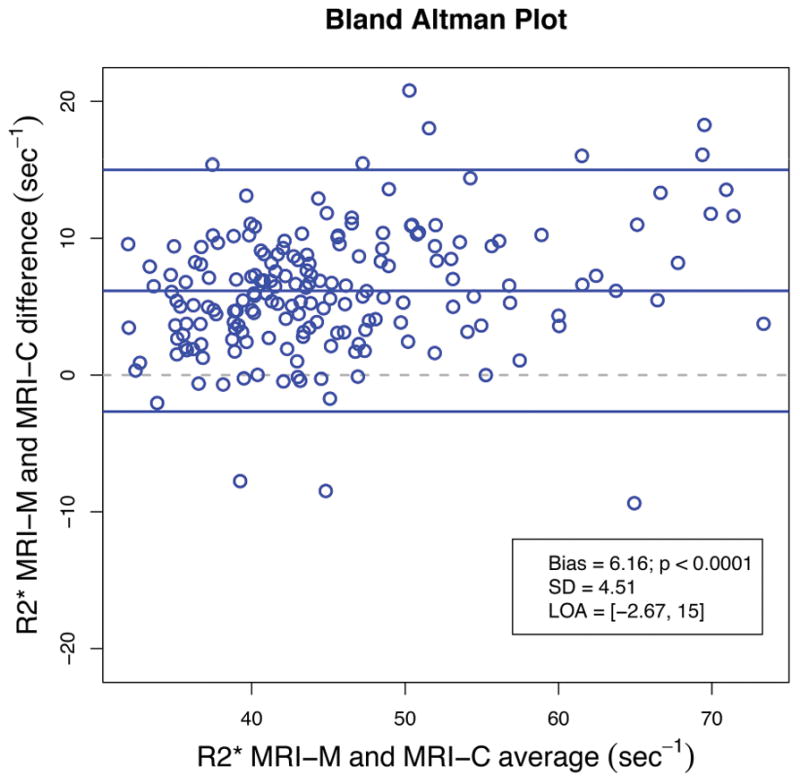
Results: In all, 184 children (123 boys, 61 girls) were included in this analysis. PDFF estimated by MRI-M and MRI-C ranged from 1.1-35.4% (9.44 ± 8.76) and 2.1-38.1% (10.1 ± 8.7), respectively. R2* estimated by MRI-M and MRI-C ranged from 32.6-78.7 s-1 (48.4 ± 9.8) and 27.2-71.5 s-1 (42.2 ± 8.6), respectively. There were strong and significant correlations between hepatic PDFF and R2* values estimated by MRI-M (r = 0.874; P < 0.0001) and MRI-C (r = 0.853; P < 0.0001). The correlation coefficients (0.874 vs. 0.853) were not significantly different (P = 0.15).

Conclusion: Hepatic PDFF and R2* are strongly correlated with each other in vivo. This relationship was observed using two different MRI techniques.

Level of evidence: 2 Technical Efficacy: Stage 1 J. Magn. Reson. Imaging 2018;47:418-424.

Keywords: MRI; PDFF (proton density fat fraction); R2*; children; hepatic steatosis; iron overload.


Figures

Figure 1
Figure 1
6-echo 2D-SPGR MRI-M (right) and 6-echo 3D SPGR MRI-C (left) acquisitions in a 17yo male adolescent. Hepatic PDFF and R2* were estimated using real and imaginary data in MRI-C and magnitude data in MRI-M. Co-localized PDFF and R2* values estimated with both MRI-M and MRI-C are overlain; dynamic scale for parametric PDFF map is 0–50% for MRI-M and 0–100% for MRI-C; dynamic scale for parametric R2* map is 0–200 s−1 for both MRI-M and MRI-C.
Figure 2
Figure 2
Hepatic PDFF and R2* maps of three representative pediatric research participants with low, medium, and high PDFF and R2* values (values overlain) on MRI-M and MRI-C. PDFF and R2* were estimated in co-localized regions of interest. These images illustrate the relationship between hepatic PDFF and R2*. Dynamic scale for parametric PDFF map is 0–50% for MRI-M and 0–100% for MRI-C; dynamic scale for parametric R2* map is 0–200 s−1 for both MRI-M and MRI-C.
Figure 3
Figure 3
Linear regression between hepatic proton density fat fraction (PDFF) and R2* estimated by magnitude-based MRI (MRI-M) and complex-based MRI (MRI-C). Regression parameters are overlain.
Figure 4
Figure 4
Figure 4a: Bland-Altman plot illustrating the difference between hepatic PDFF estimated by MRI-M and MRI-C as a function of average PDFF. Bias (the middle blue line which is the mean of MRI-M and MRI-C differences) and its p-value, standard deviation (SD) of the MRI-M and MRI-C differences, and limits of agreement (LOA) are overlain. This plot demonstrates close agreement between the two MRI techniques across a wide range of PDFF. Figure 4b: Bland-Altman plot illustrating the difference between hepatic R2* estimated by MRI-M and MRI-C as a function of average R2*. Bias (the middle blue line which is the mean of MRI-M and MRI-C differences) and its p-value, standard deviation (SD) of the MRI-M and MRI-C differences, and limits of agreement (LOA) are overlain. This plot demonstrates close agreement between the two MRI techniques across a wide range of R2*.
Figure 4
Figure 4
Figure 4a: Bland-Altman plot illustrating the difference between hepatic PDFF estimated by MRI-M and MRI-C as a function of average PDFF. Bias (the middle blue line which is the mean of MRI-M and MRI-C differences) and its p-value, standard deviation (SD) of the MRI-M and MRI-C differences, and limits of agreement (LOA) are overlain. This plot demonstrates close agreement between the two MRI techniques across a wide range of PDFF. Figure 4b: Bland-Altman plot illustrating the difference between hepatic R2* estimated by MRI-M and MRI-C as a function of average R2*. Bias (the middle blue line which is the mean of MRI-M and MRI-C differences) and its p-value, standard deviation (SD) of the MRI-M and MRI-C differences, and limits of agreement (LOA) are overlain. This plot demonstrates close agreement between the two MRI techniques across a wide range of R2*.

Similar articles

Cited by

References

    1. Reeder SB, Hu HH, Sirlin CB. Proton density fat-fraction: a standardized MR-based biomarker of tissue fat concentration. J Magn Reson Imaging. 2012;36(5):1011–1014. - PMC - PubMed
    1. Reeder SB, Sirlin CB. Quantification of liver fat with magnetic resonance imaging. Magn Reson Imaging Clin N Am. 2010;18(3):337–357. ix. - PMC - PubMed
    1. Hines CD, Frydrychowicz A, Hamilton G, et al. T(1) independent, T(2) (*) corrected chemical shift based fat-water separation with multi-peak fat spectral modeling is an accurate and precise measure of hepatic steatosis. J Magn Reson Imaging. 2011;33(4):873–881. - PMC - PubMed
    1. Zand KA, Shah A, Heba E, et al. Accuracy of multiecho magnitude-based MRI (M-MRI) for estimation of hepatic proton density fat fraction (PDFF) in children. J Magn Reson Imaging. 2015 - PMC - PubMed
    1. Kuhn JP, Hernando D, Mensel B, et al. Quantitative chemical shift-encoded MRI is an accurate method to quantify hepatic steatosis. J Magn Reson Imaging. 2014;39(6):1494–1501. - PMC - PubMed

Publication types