Review
. 2017 Sep;38(9):1072-1084.
doi: 10.1002/humu.23266. Epub 2017 Jun 21.

Objective assessment of the evolutionary action equation for the fitness effect of missense mutations across CAGI-blinded contests

Affiliations
Review

Objective assessment of the evolutionary action equation for the fitness effect of missense mutations across CAGI-blinded contests

Panagiotis Katsonis et al. Hum Mutat. 2017 Sep.

Abstract

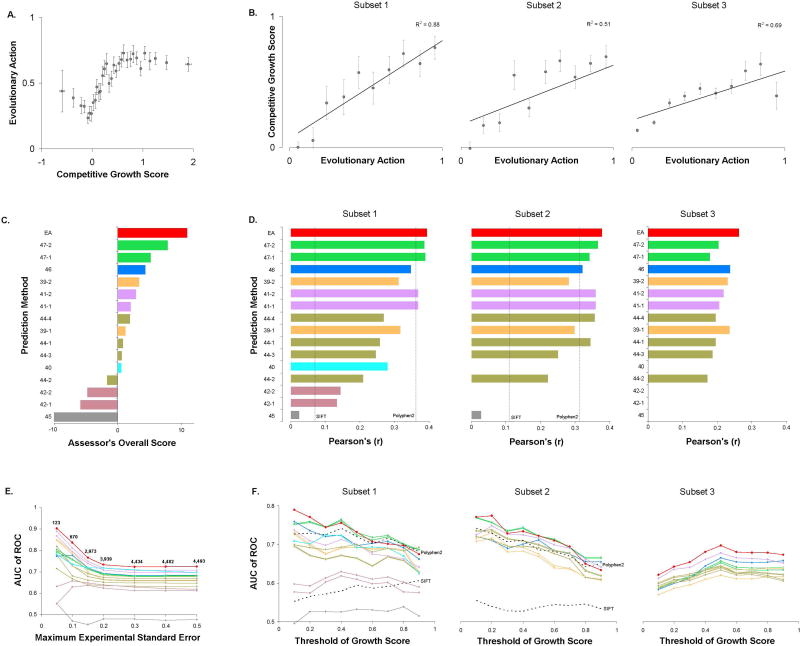
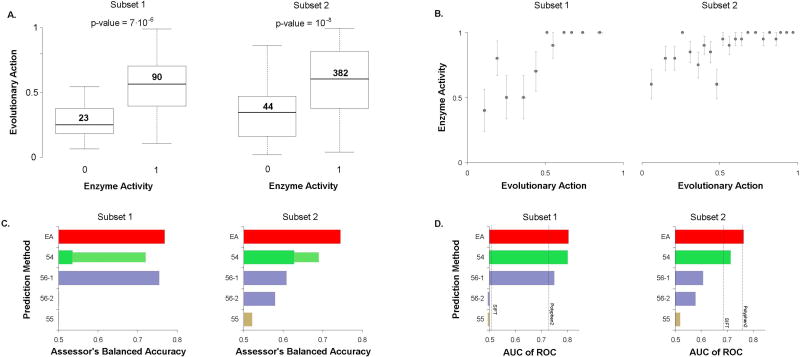
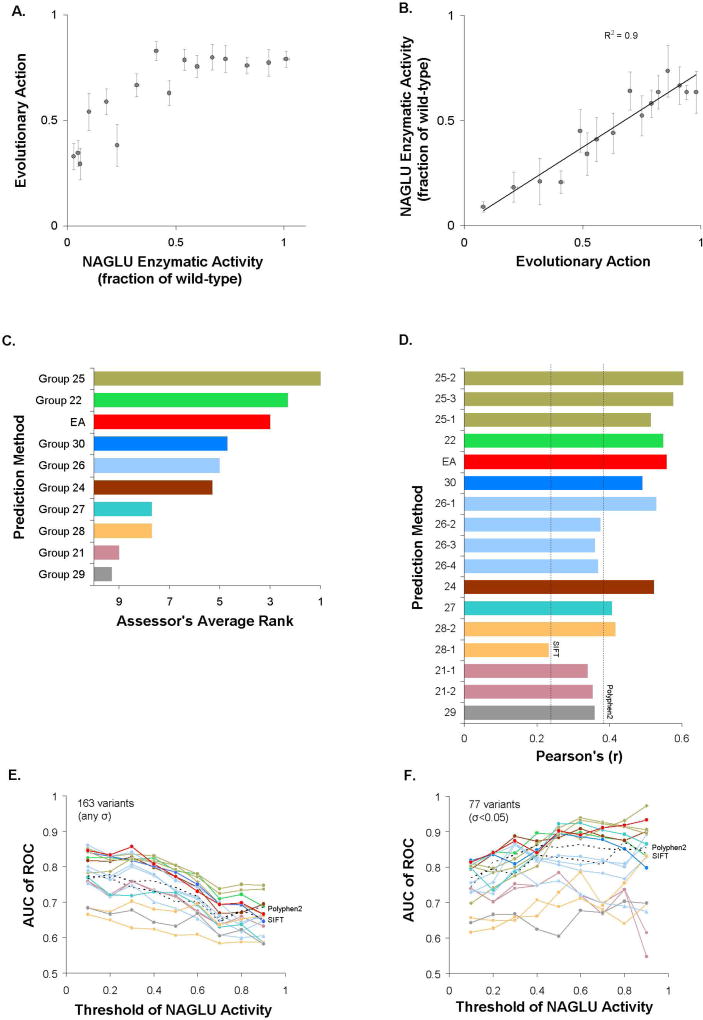
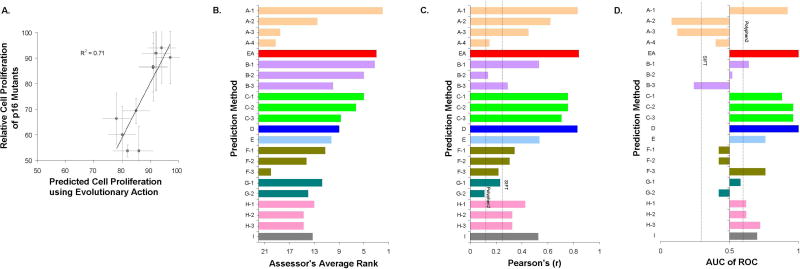
A major challenge in genome interpretation is to estimate the fitness effect of coding variants of unknown significance (VUS). Labor, limited understanding of protein functions, and lack of assays generally limit direct experimental assessment of VUS, and make robust and accurate computational approaches a necessity. Often, however, algorithms that predict mutational effect disagree among themselves and with experimental data, slowing their adoption for clinical diagnostics. To objectively assess such methods, the Critical Assessment of Genome Interpretation (CAGI) community organizes contests to predict unpublished experimental data, available only to CAGI assessors. We review here the CAGI performance of evolutionary action (EA) predictions of mutational impact. EA models the fitness effect of coding mutations analytically, as a product of the gradient of the fitness landscape times the perturbation size. In practice, these terms are computed from phylogenetic considerations as the functional sensitivity of the mutated site and as the magnitude of amino acid substitution, respectively, and yield the percentage loss of wild-type activity. In five CAGI challenges, EA consistently performed on par or better than sophisticated machine learning approaches. This objective assessment suggests that a simple differential model of evolution can interpret the fitness effect of coding variations, opening diverse clinical applications.

Keywords: deleterious and neutral; genetic variation fitness; mutation effect prediction; pathogenic and benign; single-nucleotide polymorphism (SNP); unbiased performance comparison.


Conflict of interest statement

DISCLOSURE DECLARATION

The authors declare no competing financial interests.

Figures

Figure 1
Figure 1. SUMO ligase: Competitive growth of 5,109 alleles in a high-throughput yeast-based complementation assay
(A) The average EA score for the 682 alleles that each carries a single amino acid variant (subsets 1 and 2), in groups of 20 alleles with similar growth scores. The error bars note the standard error of the mean. (B) The average competitive growth score of the SUMO ligase alleles, in deciles of EA score. The data were divided in three subsets, according to the CAGI 4 challenge description. Subset 1 was the high-accuracy subset of 219 single amino acid variants for which at least three independent barcoded clones were represented. Subset 2 was the remaining 463 single amino acid variants. Subset 3 was 4,427 alleles corresponding to clones containing two or more amino acid variants. The error bars note the standard error of the mean. (C) The performance of the 16 submitted predictions, according to the overall score calculated by the CAGI assessor. The assessor calculated 54 primary scores for each submission, which included Kendall rank, Spearman's rank, Pearson's, and Matthews Correlation Coefficients, F-score, value differences, Root-Mean-Square Deviation, and Receiver Operating Characteristic, amongst others, for the three subsets. The assessor integrated those scores to rank the original predictions, the ranks of the predictions, and a transformation guided by experimental values for each of the three subsets. The CAGI assessor calculated the overall score based on these 9 values. (D) The Pearson's Correlation Coefficients for each subset, calculated by the authors. In addition to the submitted predictions which are shown as colored bars, we calculated Pearson's Correlation Coefficients for the methods PolyPhen2 and SIFT, which are shown as dashed lines. We did not used PolyPhen2 and SIFT in subset 3, since integrating the effect of multiple mutations per allele is ambiguous and submissions followed different approaches. (E) The area under the Receiver Operating Characteristic curve (AUC) as function of the maximum experimental standard error, for all 5,109 alleles (subsets 1, 2 and 3). The variants were divided into deleterious and neutral if they had competitive growth scores less and more than 50, respectively. (F) The AUC as function of the threshold of the competitive growth score to separate deleterious and neutral variants, for each subset. The dashed lines correspond to predictions from PolyPhen2 and SIFT. The lines of the plots in (E) and (F) were colored according to the colors of the bars in (C) and (D).
Figure 2
Figure 2. Liver pyruvate kinase: Enzymatic activity of 543 missense variants measured in a binary assay in E. coli
(A) Whisker diagram of the distributions of EA scores for non-functional (0) and functional (1) mutants, divided into two subsets according to the challenge description. The horizontal lines note the median values, the box dimensions note the quartiles, and the error bars note the extremes. The number of variants in each box is shown above its median. Four variants had no enzymatic activity data available. The p-values for the significance of the median differences between non-functional and functional mutants were calculated using the Mann-Whitney U test. (B) The fraction of enzymatic active pyruvate kinase mutants, when every 20 mutants were binned sorted by EA, for each subset. The error bars note the standard error of the mean. (C) The performance of the 5 submitted predictions in the two subsets of pyruvate kinase mutations, according to the balanced accuracy score, which was used by the CAGI assessor to rank the performance of the predictions. The thinner bars correspond to the improvement gained when the CAGI assessor optimized the separation cutoffs. (D) The area under the Receiver Operating Characteristic curve (AUC) for each subset of pyruvate kinase mutations, calculated by the authors. In addition to the submitted predictions which are shown as colored bars, we calculated AUC for PolyPhen2 and SIFT, which are shown as dashed lines.
Figure 3
Figure 3. N-acetyl-glucosaminidase (NAGLU): 165 missense mutants were transfected into HEK293 cells and the NAGLU activity was assessed using a fluorogenic substrate
(A) The average EA scores for groups of 10 mutants with similar NAGLU activity. Two of the 165 mutants had no experimental assessment and they were omitted. The error bars note the standard error of the mean. (B) The average enzymatic activity of NAGLU for groups of 10 mutants with similar EA scores. The error bars note the standard error of the mean. (C) The performance of the submitted predictions, according to the overall rank of the CAGI assessor. The assessor used three tests for the overall assessment, the Root-Mean-Square Deviation, the Pearson's Correlation Coefficient, and the Spearman's Rank Correlation Coefficient. The CAGI assessor reported only the best performing method from each research group, since often multiple submissions from the same groups were based on the same original values using different scaling factors. This choice may favor groups with multiple submissions. (D) The Pearson's Correlation Coefficients for each submission, calculated by the authors. In addition to the submitted predictions which are shown as colored bars, we calculated Pearson's Correlation Coefficients for PolyPhen2 and SIFT, shown as dashed lines. (E) The area under the Receiver Operating Characteristic curve (AUC) for the submitted predictions as function of the threshold of NAGLU activity to separate into deleterious and neutral all 163 mutations or (F) the 77 mutations with an experimental standard deviation of σ=0.05 and less. The AUC values were calculated by the authors and they were colored according to the colors of the bars in (D). The dashed lines correspond to predictions from PolyPhen2 and SIFT.
Figure 4
Figure 4. p16 tumor suppressor protein: The proliferation rate of 10 p16-null human cell lines transfected with p16 mutant proteins was estimated relative to the proliferation of cell with wild-type p16
(A) The experimentally determined proliferation of the 10 cells as function of the EA scores for the 10 p16 variants. The y-axis error bars note the experimental standard deviation and the x-axis error bars correspond to a fixed confidence range of 10 EA score units. (B) The performance of the 22 submitted predictions, according to the overall score calculated by the CAGI assessor. This score was the average rank of the performance of the submissions in 4 tests: Kendall's tau Coefficient, Root-Mean-Square Deviation, Receiver Operating Characteristic, and the count of mutants within 10% overlap between experimental and predicted values. (C) The Pearson's Correlation Coefficients calculated by the authors. In addition to the submitted predictions which are shown as colored bars, we calculated Pearson's Correlation Coefficients for PolyPhen2 and SIFT, shown as dashed lines. (D) The area under the Receiver Operating Characteristic curve (AUC). The variants were divided into deleterious and neutral if they had cell proliferation rate more and less than 50, respectively. The dashed lines correspond to predictions from PolyPhen2 and SIFT.
Figure 5
Figure 5. Cystathionine beta-Synthase (CBS): The function of 84 mutants of the human CBS was measured in vivo as the growth rate, relative to wild-type, in a yeast complementation assay in high and low co-factor concentrations
(A) Whisker diagrams of the distributions of EA scores for four functional groups of the CBS mutations, at the two co-factor concentrations. The functional groups were defined as mutants with a relative growth rate of null (0), detectable but less than 50% (0–50), between 50% and 100% (50–100), and more than 100% (100<) of the wild-type growth rate. The horizontal lines note the median values, the box dimensions note the quartiles, and the error bars note the extremes. The number of variants in each box is shown above or below its median. Six mutants had non-defined growth rate at low co-factor concentration. (B) The average relative growth rate for groups of 10 CBS mutants with similar EA score, for each co-factor concentration. The error bars note the standard error of the mean. (C) The performance of the 20 submitted predictions, according to the average rank in all nine statistical tests used by the CAGI assessor to judge the performance of the predictions to match the experimental data at each co-factor concentration. Amongst others, these tests included Precision, Recall, Accuracy, Root-Mean-Square Deviation, Spearman's Rank Correlation Coefficient, F-score, and Receiver Operating Characteristic. The average rank was calculated by the authors, since the assessor did not provide an overall rank of the submitted predictions. (D) The Pearson's Correlation Coefficients for each subset, calculated by the authors. In addition to the submitted predictions which are shown as colored bars, we calculated Pearson's Correlation Coefficients for SIFT, shown as dashed lines. The PolyPhen2 dashed line (in panels D, E, and F) corresponds to a submission by PolyPhen2 developer group at the time of submission. An up-to-date PolyPhen2 calculation yielded equivalent performance, but slightly different predictions from the submitted version (data not shown) (E) The area under the Receiver Operating Characteristic curve (AUC) as function of the threshold of CBS growth rate to separate deleterious and neutral variants, at low co-factor concentration. (F) The AUC as function of the maximum experimental standard deviation, for the 84 CBS mutants at low co-factor concentration. The lines of panels (E) and (F) were colored according to the colors of the bars in (C) and (D), while the dashed lines correspond to predictions from PolyPhen2 and SIFT.

References

    1. Adzhubei I, Schmidt S, Peshkin L, Ramensky V, Gerasimova A, Bork P, Kondrashov A, Sunyaev S. A method and server for predicting damaging missense mutations. Nature Methods. 2010;7(4):248–249. - PMC - PubMed
    1. Amin S, Erdin S, Ward R, Lua R, Lichtarge O. Prediction and Experimental Validation of Enzyme Substrate Specificity in Protein Structures. PNAS. 2013 (in press) - PMC - PubMed
    1. Breen MS, Kemena C, Vlasov PK, Notredame C, Kondrashov FA. Epistasis as the primary factor in molecular evolution. Nature. 2012;490(7421):535–538. - PubMed
    1. Bromberg Y, Rost B. SNAP: predict effect of non-synonymous polymorphisms on function. Nucleic acids research. 2007;35(11):3823–3835. - PMC - PubMed
    1. Buckland M, Gey F. The relationship between recall and precision. Journal of the American society for information science. 1994;45(1):12.

Publication types

LinkOut - more resources