. 2017 Aug;38(8):4125-4156.
doi: 10.1002/hbm.23653. Epub 2017 May 23.

Challenges in measuring individual differences in functional connectivity using fMRI: The case of healthy aging

Affiliations

Challenges in measuring individual differences in functional connectivity using fMRI: The case of healthy aging

Linda Geerligs et al. Hum Brain Mapp. 2017 Aug.

Abstract

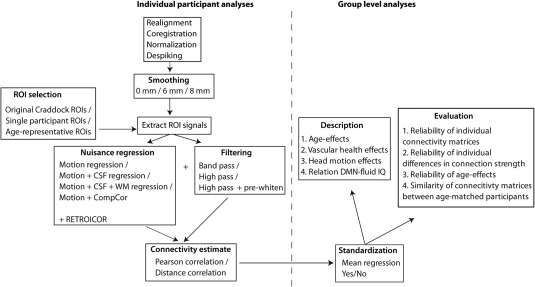
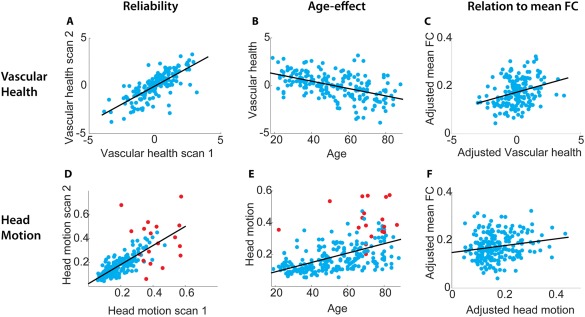
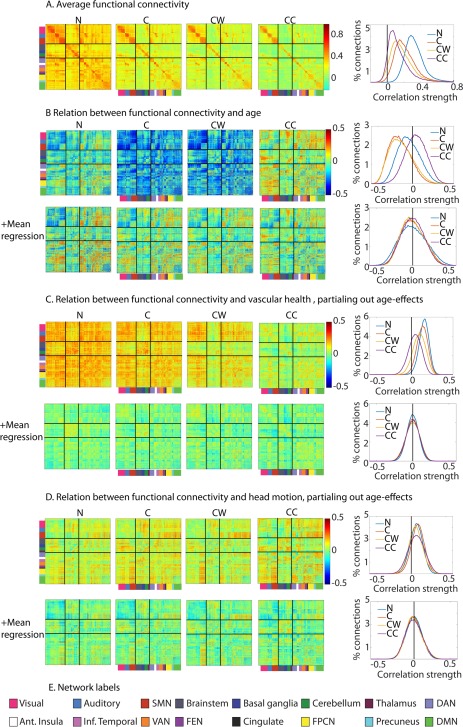
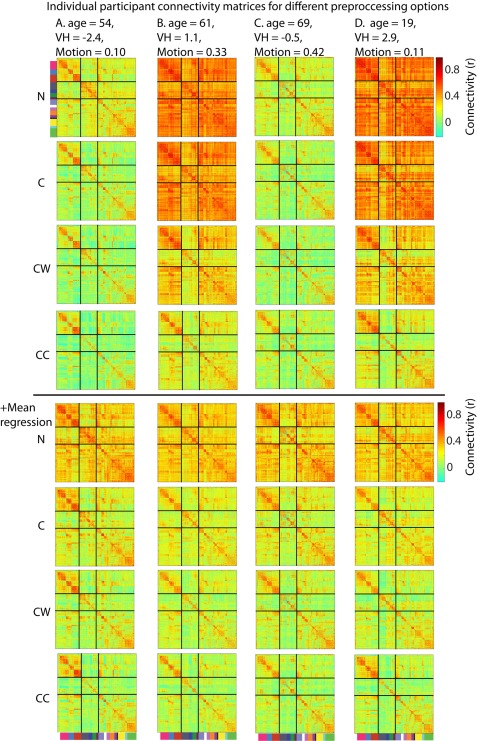
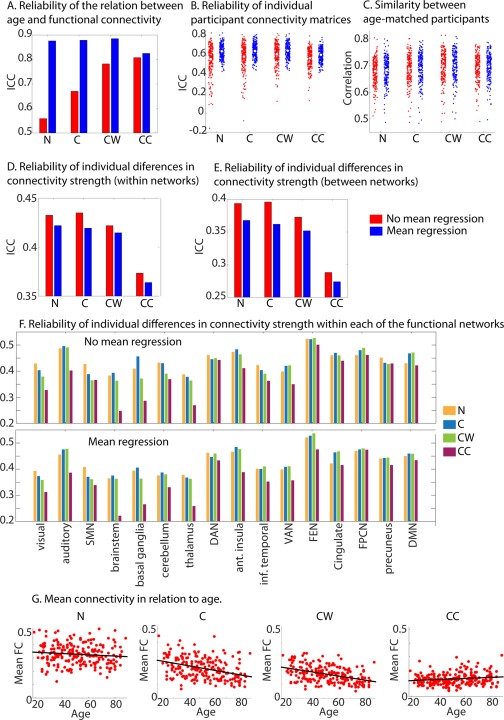
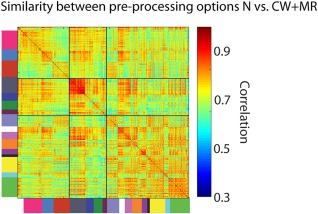
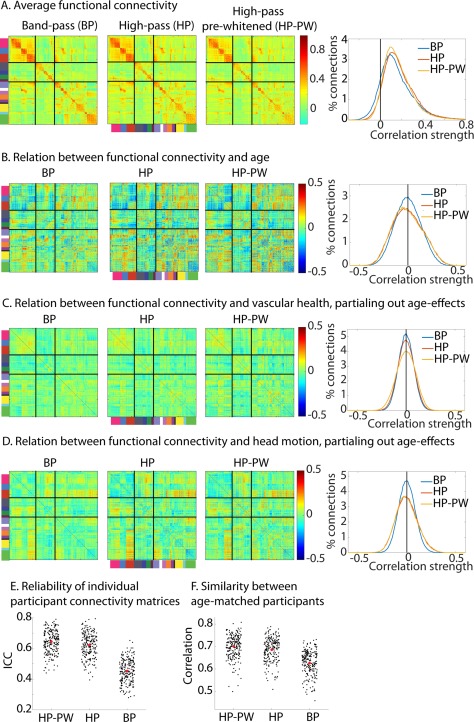
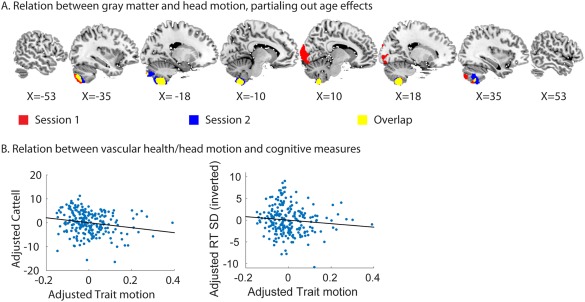
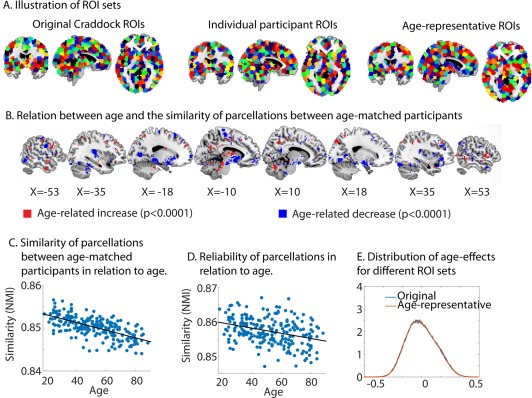
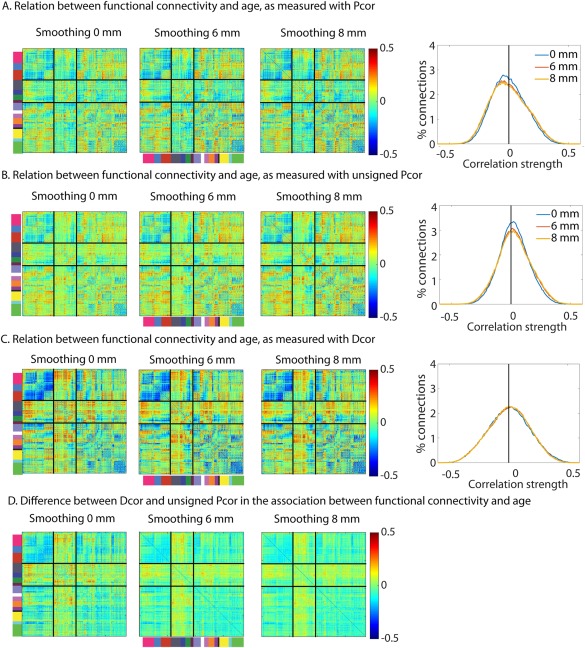
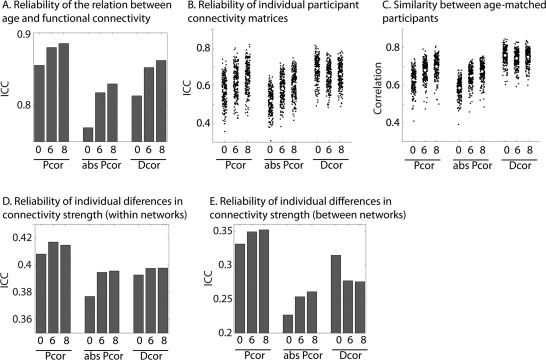
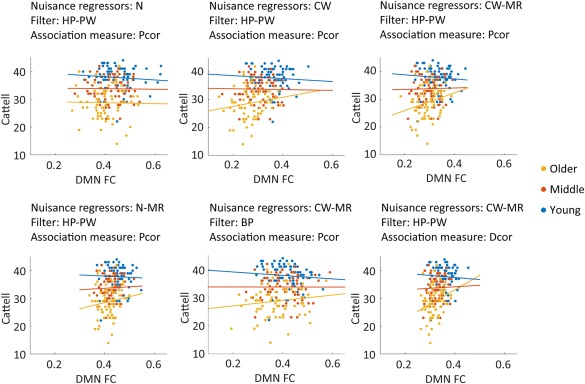
Many studies report individual differences in functional connectivity, such as those related to age. However, estimates of connectivity from fMRI are confounded by other factors, such as vascular health, head motion and changes in the location of functional regions. Here, we investigate the impact of these confounds, and pre-processing strategies that can mitigate them, using data from the Cambridge Centre for Ageing & Neuroscience (www.cam-can.com). This dataset contained two sessions of resting-state fMRI from 214 adults aged 18-88. Functional connectivity between all regions was strongly related to vascular health, most likely reflecting respiratory and cardiac signals. These variations in mean connectivity limit the validity of between-participant comparisons of connectivity estimates, and were best mitigated by regression of mean connectivity over participants. We also showed that high-pass filtering, instead of band-pass filtering, produced stronger and more reliable age-effects. Head motion was correlated with gray-matter volume in selected brain regions, and with various cognitive measures, suggesting that it has a biological (trait) component, and warning against regressing out motion over participants. Finally, we showed that the location of functional regions was more variable in older adults, which was alleviated by smoothing the data, or using a multivariate measure of connectivity. These results demonstrate that analysis choices have a dramatic impact on connectivity differences between individuals, ultimately affecting the associations found between connectivity and cognition. It is important that fMRI connectivity studies address these issues, and we suggest a number of ways to optimize analysis choices. Hum Brain Mapp 38:4125-4156, 2017. © 2017 Wiley Periodicals, Inc.

Keywords: aging; filtering; functional connectivity; functional magnetic resonance imaging; head motion; nuisance regression; pre-processing; resting state; smoothing; vascular health.


Figures

Figure 1
Figure 1
Illustration of the analysis pipelines and the various pre‐ and post‐processing steps that were compared.
Figure 2
Figure 2
Scatterplots of the associations between (A) age and vascular health (scan 1), (B) vascular health in scans 1 and 2 (reliability), (C) vascular health and mean functional connectivity (FC), adjusted for effect of age, (D) age and head motion (scan 1), (E) head motion in scans 1 and 2, (F) head motion and mean FC, adjusted for effect of age. Red dots in the plots with head motion indicate the participants who were excluded from the functional connectivity analyses due to the high number of spikes removed by wavelet despiking.
Figure 3
Figure 3
Comparison of different nuisance regression options. (A) Average functional connectivity across participants ROIs are ordered by functional network, as indicated by the colors on the left side and bottom of the functional connectivity matrices, based on Geerligs et al. [2015b]. The network labels are shown below, in panel E. The solid black lines differentiate sensorimotor networks (top), subcortical networks (middle), and higher cortical networks (top). The histograms show the distributions of the effects in the figures on the left. (B) Relation between age and functional connectivity. (C) Relation between vascular health and functional connectivity, after adjusting for effects of age. (D) Relation between head motion and functional connectivity, after adjusting for effects of age. (E) Network labels. SMN = somato‐motor network (SMN), DAN = dorsal attention network, VAN = ventral attention network, FEN = fronto‐executive network, FPCN = fronto‐parietal control network, DMN= default mode network, Ant = anterior, Inf.=inferior. N = only motion regressors; C = motion regressors + CSF regressors; CW= motion regressors + CSF regressors + white matter regressors; CC = motion regressors +CompCor CSF and WM regressors.
Figure 4
Figure 4
(AD) Connectivity estimates across pre‐processing options for individual participants who vary in their age, vascular health and head motion. Participants B and D have relatively high vascular health estimates, while participants A and C have relatively low vascular health. Participants A and D have relatively high levels of head motion, while participants B and C have low levels of head motion. N = only motion regressors; C = motion regressors + CSF regressors; CW= motion regressors + CSF regressors + white matter regressors; CC = motion regressors +CompCor CSF and WM regressors.
Figure 5
Figure 5
Reliability and between participant similarity for the various methods used to correct for physiological noise. (A) Reliability of the age‐connectivity matrices. (B) Reliability of each participants connectivity matrix. (C) Similarity between age‐matched participants. (D) Reliability of individual differences in connectivity strength, averaged across all within network connections. (E) Reliability of individual differences in connectivity strength, averaged across all between network connections. (F) Reliability of individual differences in connectivity strength averaged across all connections within each of the functional networks. (G) Scatterplot of individual differences in mean connectivity in relation to age for different pre‐processing steps. This was not shown for the mean regression steps, because mean regression removes all variations in mean connectivity. N = only motion regressors; C = motion regressors + CSF regressors; CW= motion regressors + CSF regressors + white matter regressors; CC = motion regressors +CompCor CSF and WM regressors. SMN = somato‐motor network (SMN), DAN = dorsal attention network, VAN = ventral attention network, FEN = fronto‐executive network, FPCN = fronto‐parietal control network, DMN= default mode network, Ant = anterior, Inf.=inferior.
Figure 6
Figure 6
Sensitivity of the various within and between network connectivity estimates to changes in nuisance regression procedures. This figures shows for each ROI pair, the correlation across participants between the connectivity estimates of two different pre‐processing pipelines; the N (motion regressors only) connectivity estimates, and the CW + MR connectivity estimates (motion regressors +CSF and white matter regressors + mean regression).
Figure 7
Figure 7
Comparison of different filtering and pre‐whitening options. (A) Average functional connectivity. (B) Relation between age and functional connectivity. The histograms show the distributions of the effects in the figures on the left. (C) Relation between vascular health and functional connectivity, after adjusting for effects of age. (D) Relation between head motion and functional connectivity, after adjusting for effects of age. (E) Reliability of each participants connectivity matrix (F) Similarity between age‐matched participants. Note all results are after regression of motion, CSF and WM signals and mean connectivity (i.e., CW + MR condition in Figure 3). BP = band‐pass filtered; HP = high‐pass filtered; HP‐PW = high‐pass filtered and pre‐whitened.
Figure 8
Figure 8
(A) Relation between trait motion and gray matter volume, separately for the T1 images in session 1 and session 2. (B) Relation between trait motion and Cattell and trait motion and response time variability. The response time variability scores were inverted, therefore higher scores indicate lower variability. Values of cognitive performance and trait motion were adjusted for effects of age.
Figure 9
Figure 9
(A) Illustration of the different ROI sets. The individual ROIs are shown for one randomly‐selected participant. The colors of the ROIs are arbitrary. (B) Regions which show a change in the similarity of parcellations between age‐matched participants with age. (C) The relation between the similarity of parcellations between age‐matched participants and age. (D) Relation between the reliability of parcellations and age. (E) The distribution of age‐effects for the original ROI‐set and the age‐representative ROI‐set. NMI = normalized mutual information.
Figure 10
Figure 10
Association between age and functional connectivity for different amounts of smoothing (left to right 0 mm, 6 mm and 8 mm) and various connectivity measures (A) Pcor, (B) unsigned Pcor (C) Dcor. (D) The difference in the association between age and functional connectivity between Dcor and unsigned Pcor. Pcor = Pearson correlation; Dcor = distance correlation; abs Pcor = absolute/unsigned Pearson correlation.
Figure 11
Figure 11
Reliability and between participant similarity for Pcor, Dcor, and unsigned (absolute value, abs) Pcor connectivity matrices with different levels of smoothing. (A) Reliability of the age‐connectivity matrices (B) Reliability of each participants connectivity matrix (C) Similarity between age‐matched participants (D) Reliability of individual differences in connectivity strength, averaged across all within network connections. (E) Reliability of individual differences in connectivity strength, averaged across all between network connections. Pcor = Pearson correlation; Dcor = distance correlation; abs Pcor = absolute/unsigned Pearson correlation. 0, 6, and 8 refer to the mm of smoothing that was applied to the data.
Figure 12
Figure 12
Association between DMN connectivity and performance on the Cattell task of fluid intelligence. Participants were split up into the youngest, middle and oldest third. Connectivity values were based on 8 mm smoothed data. The other nuisance regression and filtering options, as well as the choice of association measure are indicated on the top of each figure. N = only motion regressors; CW= motion regressors + CSF regressors + white matter regressors; HP = high pass filter; BP = band pass filter; PW = pre‐whitening. Pcor = Pearson correlation; Dcor = Distance correlation; MR = mean regression.

Similar articles

Cited by

References

    1. Andrews‐Hanna JR, Snyder AZ, Vincent JL, Lustig C, Head D, Raichle ME, Buckner RL (2007): Disruption of large‐scale brain systems in advanced aging. Neuron 56:924–935. - PMC - PubMed
    1. Arbabshirani MR, Damaraju E, Phlypo R, Plis S, Allen E, Ma S, Mathalon D, Preda A, Vaidya JG, Adali T, Calhoun VD (2014): Impact of autocorrelation on functional connectivity. Neuroimage 102:294–308. - PMC - PubMed
    1. Ashburner J, Friston KJ (2000): Voxel‐based morphometry ‐ The methods. Neuroimage 11:805–821. - PubMed
    1. Baddeley A, Emslie H, Nimmo‐Smith I (1993): The Spot‐the‐Word test: a robust estimate of verbal intelligence based on lexical decision. Br J Clin Psychol 32:55–65. - PubMed
    1. Behzadi Y, Restom K, Liau J, Liu TT (2007): A component based noise correction method (CompCor) for BOLD and perfusion based fMRI. Neuroimage 37:90–101. - PMC - PubMed

Publication types

MeSH terms