. 2017 Oct;37(10):1544-1553.
doi: 10.1111/liv.13451. Epub 2017 May 20.

Ultra-high-field magnetic resonance spectroscopy in non-alcoholic fatty liver disease: Novel mechanistic and diagnostic insights of energy metabolism in non-alcoholic steatohepatitis and advanced fibrosis

Affiliations

Ultra-high-field magnetic resonance spectroscopy in non-alcoholic fatty liver disease: Novel mechanistic and diagnostic insights of energy metabolism in non-alcoholic steatohepatitis and advanced fibrosis

Stefan Traussnigg et al. Liver Int. 2017 Oct.

Abstract

Background & aims: With the rising prevalence of non-alcoholic fatty liver disease (NAFLD) and steatohepatitis (NASH) non-invasive tools obtaining pathomechanistic insights to improve risk stratification are urgently needed. We therefore explored high- and ultra-high-field magnetic resonance spectroscopy (MRS) to obtain novel mechanistic and diagnostic insights into alterations of hepatic lipid, cell membrane and energy metabolism across the spectrum of NAFLD.

Methods: MRS and liver biopsy were performed in 30 NAFLD patients with NAFL (n=8) or NASH (n=22). Hepatic lipid content and composition were measured using 3-Tesla proton (1 H)-MRS. 7-Tesla phosphorus (31 P)-MRS was applied to determine phosphomonoester (PME) including phosphoethanolamine (PE), phosphodiester (PDE) including glycerophosphocholine (GPC), phosphocreatine (PCr), nicotinamide adenine dinucleotide phosphate (NADPH), inorganic phosphate (Pi), γ-ATP and total phosphorus (TP). Saturation transfer technique was used to quantify hepatic ATP flux.

Results: Hepatic steatosis in 1 H-MRS highly correlated with histology (P<.001) showing higher values in NASH than NAFL (P<.001) without differences in saturated or unsaturated fatty acid indices. PE/TP ratio increased with advanced fibrosis (F3/4) (P=.002) whereas GPC/PME+PDE decreased (P=.05) compared to no/mild fibrosis (F0-2). γ-ATP/TP was lower in advanced fibrosis (P=.049), while PCr/TP increased (P=.01). NADPH/TP increased with higher grades of ballooning (P=.02). Pi-to-ATP exchange rate constant (P=.003) and ATP flux (P=.001) were lower in NASH than NAFL.

Conclusions: Ultra-high-field MRS, especially saturation transfer technique uncovers changes in energy metabolism including dynamic ATP flux in inflammation and fibrosis in NASH. Non-invasive profiling by MRS appears feasible and may assist further mechanistic and therapeutic studies in NAFLD/NASH.

Keywords: saturation transfer; adenosine triphosphate flux; fatty liver; lipotoxicity; mitochondrial function.


Figures

Figure 1
Figure 1
Patient selection patients were invited to participate in this study if liver biopsy was planned in suspected non‐alcoholic fatty liver disease (NAFLD) patients and magnetic resonance eligibility was confirmed. After obtaining consent patients were further selected when liver biopsy showed NAFLD non‐alcoholic fatty liver or non‐alcoholic steatohepatitis as single diagnosis
Figure 2
Figure 2
Magnetic resonance spectroscopy (MRS) procedure and representative 1H and 31P spectra of patients with non‐alcoholic fatty liver disease (NAFL) and non‐alcoholic steatohepatitis (NASH). The Volume of Interest for 1H‐MRS was placed in the right lobe of the liver (A). The different amounts of hepatic fat are illustrated by 1H spectra from patient with NAFL and NASH (B, C respectively). The 2D chemical shift imaging (CSI) slice for 31P‐MRS was placed parallel to the RF surface coil carefully avoiding superficial skeletal muscle tissue (D). Signals from shaded voxels (4×4) were selected for processing and further analysis. The 31P spectra from patients with NAFL (no/mild fibrosis) and NASH (advanced fibrosis) are depicted in E and F respectively. For illustration purposes, the 31P spectra were filtered with 10 Hz Lorentzian filter. All amplitudes of the signals are in arbitrary units
Figure 3
Figure 3
Hepatic fat fraction in non‐alcoholic fatty liver disease (NAFL) and non‐alcoholic steatohepatitis (NASH) assessed with 1H‐MRS and liver histology. (A) High correlation of lipid content on liver histology as gold standard with 3 T 1H‐MRS (r=.716, P<.001). NASH patients show a higher hepatic fat fraction on (B) 3 T 1H‐MRS (P<.001), which was also confirmed by (C) histology (P<.001)
Figure 4
Figure 4
31P‐MRS: Phosphomonoesters and phosphodiesters uncover alterations in cell membrane metabolism in non‐alcoholic fatty liver disease (NAFLD). Phosphomonoesters like phosphoethanolamine (PE) were significantly higher in advanced fibrosis than no‐to‐mild fibrosis: (A) PE/phosphomonoester (PME)+phosphodiester(PDE) (P=.04), (B) PE/γ‐adenosine triphosphate (ATP) (P=.002) and (C) PME/γ‐ATP (P=.013). (D) This was reversed for phosphodiesters like glycerophosphocholine (GPC)/(PME+PDE) (P=.05). 31P‐MRS shows alterations in cell membrane metabolism in advanced NAFLD with higher degree of fibrosis
Figure 5
Figure 5
31P‐MRS: adenosine triphosphate (ATP), inorganic phosphate, phosphocreatine and nicotinamide adenine dinucleotide phosphate (NADPH) reflecting altered energy metabolism in non‐alcoholic fatty liver disease (NAFLD). 31P‐MRS data show an altered hepatic energy metabolism in higher grades of fibrosis in NAFLD patients. (A) Advanced fibrosis showed lower levels of γ‐adenosine triphosphate (ATP)/total phosphorus (TP) (P=.049). (B) Conversely phosphocreatine (PCr)/TP increased in advanced fibrosis (P=.014). (C) NADPH/TP ratios increased with higher grades of ballooning (no (0) vs many ballooned cells (2), P=.028; few (1) vs many ballooned cells (2), P=.05). Choice of spectroscopic field of view, which can be described as sagittal slab parallel to the surface coil, placed well within liver parenchyma (Figure 2D), acquisition frequency centred to PCr resonance position, leading to no chemical shift displacement artefact, and careful volume of interest (VOI) selection during signal processing, all supports the valid assumption, that our spectra are not contaminated by the signals from skeletal muscle
Figure 6
Figure 6
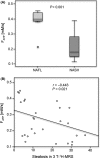
Saturation transfer 31P‐MRS: Higher adenosine triphosphate (ATP) fluxes in non‐alcoholic fatty liver disease (NAFLD) than non‐alcoholic steatohepatitis (NASH). (A) Forward exchange flux (FATP) was lower in patients with NASH (0.21±0.08 mM/s) than with non‐alcoholic fatty liver (NAFL) (0.38±0.08 mM/s) consistent with abnormal mitochondrial function (r=−.679; P<.001). (B) In addition a minor correlation was also found for FATP and steatosis in 3‐T 1H‐MRS (r=−.443; P=.021)

References

    1. Williams CD, Stengel J, Asike MI, et al. Prevalence of nonalcoholic fatty liver disease and nonalcoholic steatohepatitis among a largely middle‐aged population utilizing ultrasound and liver biopsy: a prospective study. Gastroenterology. 2011;140:124‐131. - PubMed
    1. Nalbantoglu I, Brunt EM. Role of liver biopsy in nonalcoholic fatty liver disease. World J Gastroenterol. 2014;20:9026‐9037. - PMC - PubMed
    1. Thomsen C, Becker U, Winkler K, Christoffersen P, Jensen M, Henriksen O. Quantification of liver fat using magnetic resonance spectroscopy. Magn Reson Imaging. 1994;12:487‐495. - PubMed
    1. Ruiz‐Cabello J, Cohen JS. Phospholipid metabolites as indicators of cancer cell function. NMR Biomed. 1992;5:226‐233. - PubMed
    1. Krssak M, Hofer H, Wrba F, et al. Non‐invasive assessment of hepatic fat accumulation in chronic hepatitis C by 1H magnetic resonance spectroscopy. Eur J Radiol. 2010;74:e60‐e66. - PubMed

Publication types

MeSH terms