. 2017 Nov;21(11):2909-2925.
doi: 10.1111/jcmm.13203. Epub 2017 May 24.

Fibroblast growth factor 2 protects against renal ischaemia/reperfusion injury by attenuating mitochondrial damage and proinflammatory signalling

Affiliations

Fibroblast growth factor 2 protects against renal ischaemia/reperfusion injury by attenuating mitochondrial damage and proinflammatory signalling

Xiao-Hua Tan et al. J Cell Mol Med. 2017 Nov.

Abstract

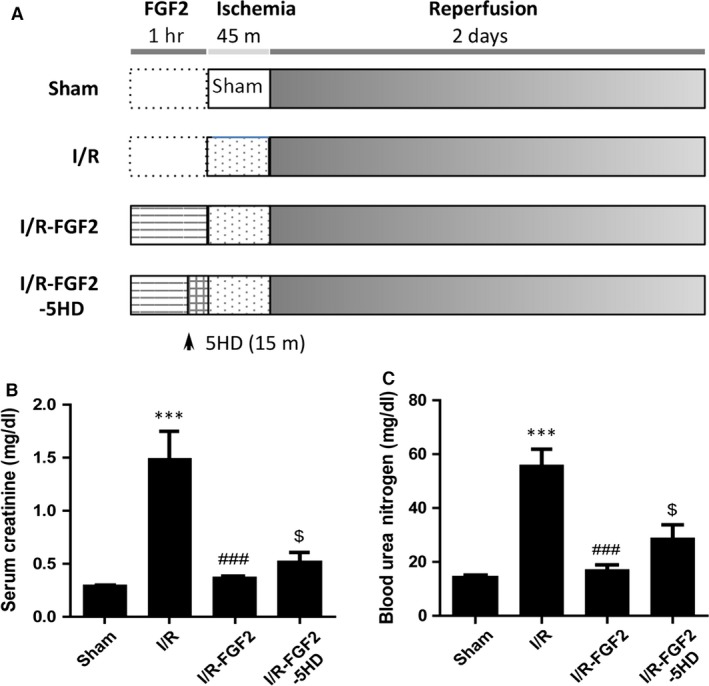
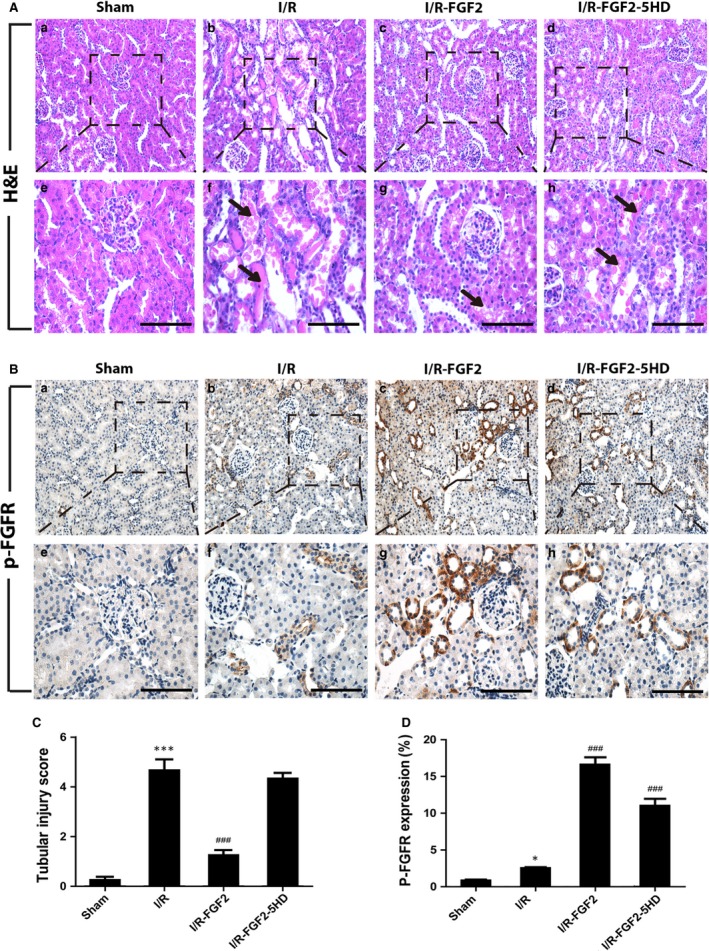
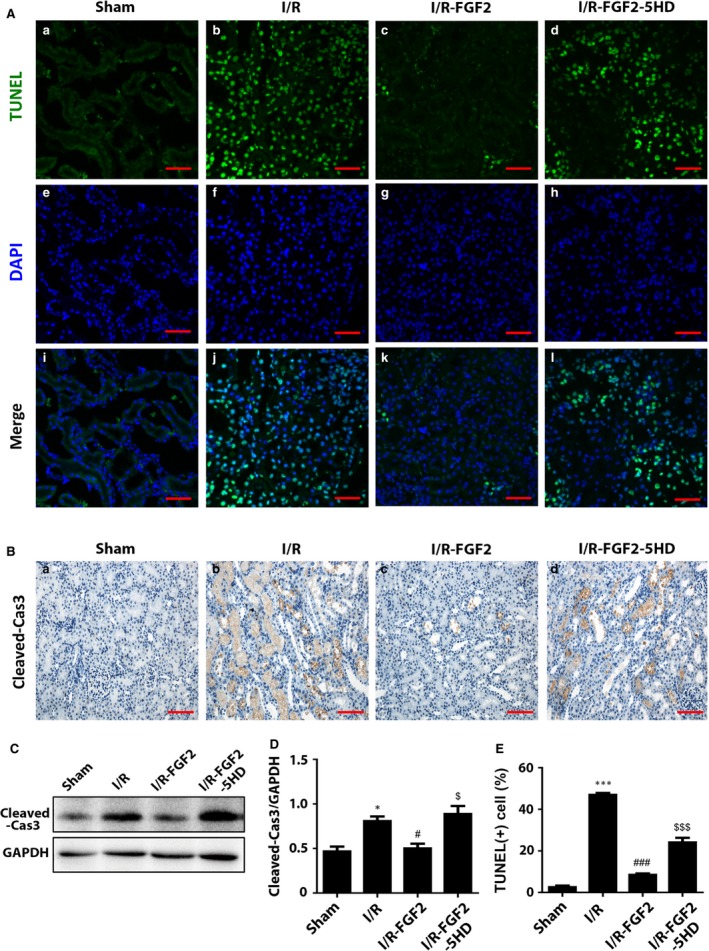
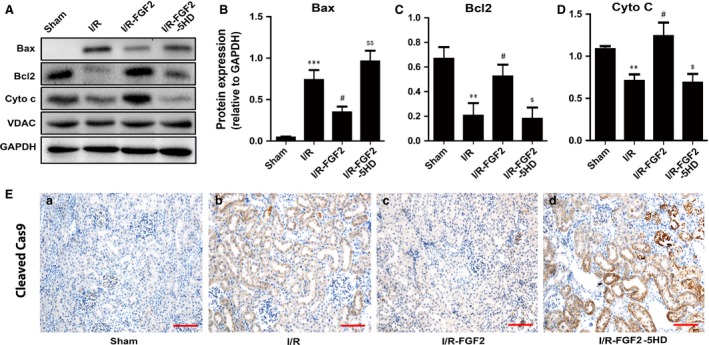
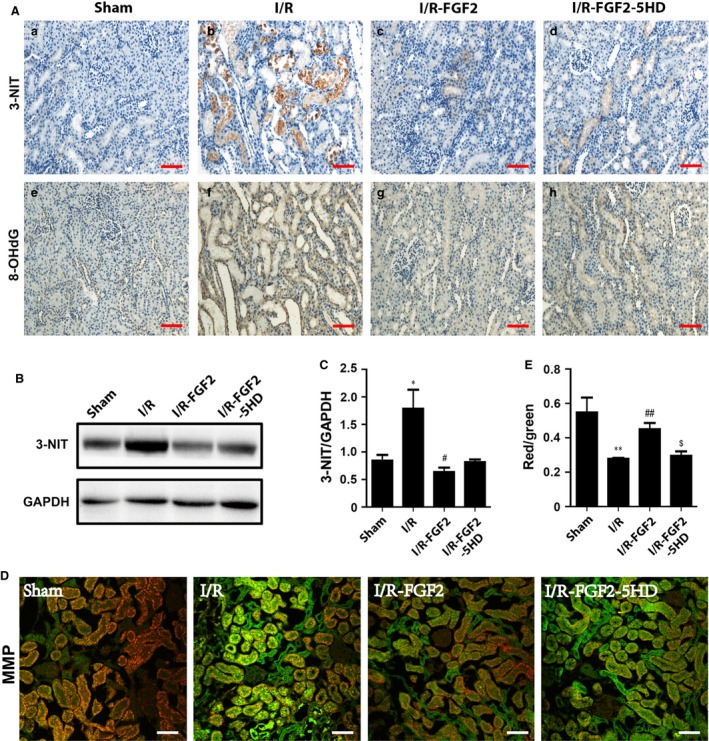
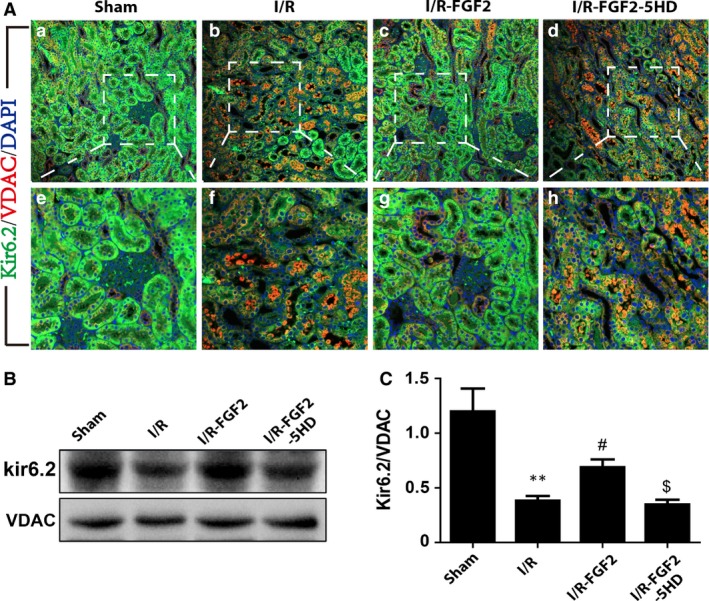
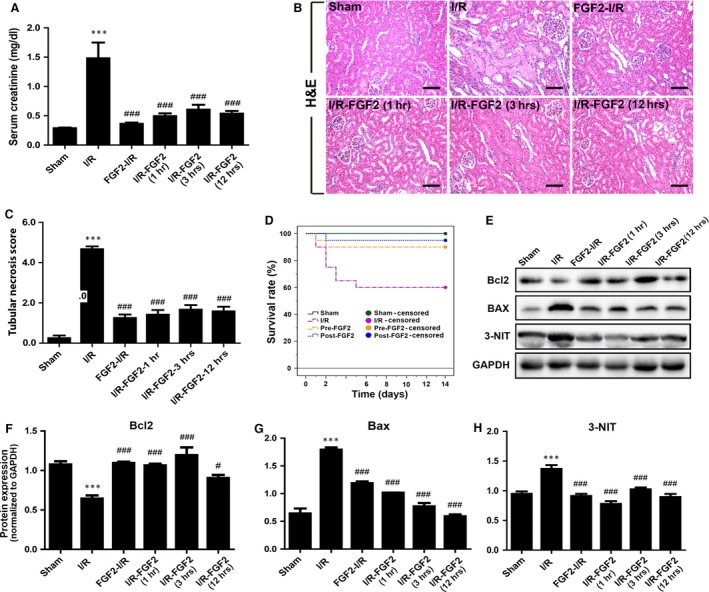
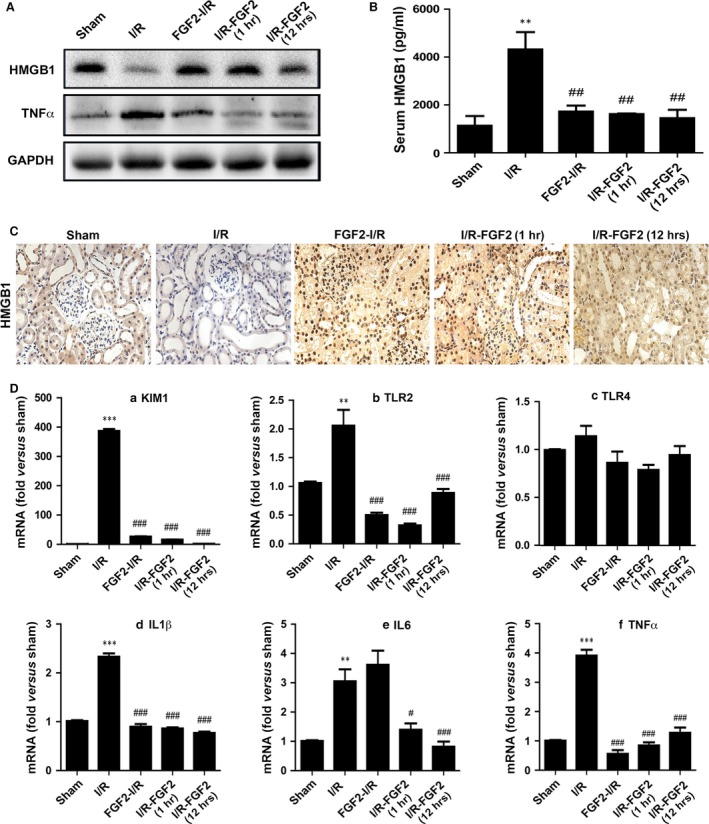
Ischaemia-reperfusion injury (I/RI) is a common cause of acute kidney injury (AKI). The molecular basis underlying I/RI-induced renal pathogenesis and measures to prevent or reverse this pathologic process remains to be resolved. Basic fibroblast growth factor (FGF2) is reported to have protective roles of myocardial infarction as well as in several other I/R related disorders. Herein we present evidence that FGF2 exhibits robust protective effect against renal histological and functional damages in a rat I/RI model. FGF2 treatment greatly alleviated I/R-induced acute renal dysfunction and largely blunted I/R-induced elevation in serum creatinine and blood urea nitrogen, and also the number of TUNEL-positive tubular cells in the kidney. Mechanistically, FGF2 substantially ameliorated renal I/RI by mitigating several mitochondria damaging parameters including pro-apoptotic alteration of Bcl2/Bax expression, caspase-3 activation, loss of mitochondrial membrane potential and KATP channel integrity. Of note, the protective effect of FGF2 was significantly compromised by the KATP channel blocker 5-HD. Interestingly, I/RI alone resulted in mild activation of FGFR, whereas FGF2 treatment led to more robust receptor activation. More significantly, post-I/RI administration of FGF2 also exhibited robust protection against I/RI by reducing cell apoptosis, inhibiting the release of damage-associated molecular pattern molecule HMBG1 and activation of its downstream inflammatory cytokines such as IL-1α, IL-6 and TNF α. Taken together, our data suggest that FGF2 offers effective protection against I/RI and improves animal survival by attenuating mitochondrial damage and HMGB1-mediated inflammatory response. Therefore, FGF2 has the potential to be used for the prevention and treatment of I/RI-induced AKI.

Keywords: High-mobility group box 1; acute kidney injury; fibroblast growth factor 2; inflammatory cytokine; ischaemia-reperfusion; mitochondrial dysfunction.


Figures

Figure 1
Figure 1
FGF2 sustains renal function after I/R injury. (A) Protocol for renal ischaemia/reperfusion injury model in rat. (B) Determination of serum Cr levels in indicated animal groups at 48 hrs after reperfusion (mean ± S.E.; n = 8). ***P < 0.001 versus Sham group, ###P < 0.001 versus I/R group; $P < 0.05 versus FGF2 + I/R group. (C) Determination of blood urea nitrogen (BUN) levels in indicated animal groups at 48 hrs after reperfusion (mean ± S.E.; n = 8). ***P < 0.001 versus sham group; ###P < 0.001 versus I/R group; $P < 0.05 versus FGF2 + I/R group.
Figure 2
Figure 2
FGF2 protects renal histological integrity and robustly activates FGFR. (A) Histological evaluations of renal tissue with H&E after 2 days of reperfusion (original magnification ×20 and ×40, respectively). Arrows show intraluminal necrotic cellular debris, interstitial congestion and oedema, and formation of proteinaceous casts. Scale bars represent 50 μm. (B) Immunohistochemical staining for phospho‐FGFR (p‐FGFR, original magnification ×20 and ×40, respectively). Scale bars represent 50 μm. (C) Renal tubular injury scores were calculated based on H&E staining using the criteria and procedure described in the material and methods. Results are representative of eight animals in each group. ***P < 0.001 versus sham group), ###P < 0.001 versus I/R group. Results are representative of eight animals in each group. (D) Quantification and statistical analysis of p‐FGFR positive cells in the kidney. Data are representative of five animals in each group. *P < 0.05 versus sham group.
Figure 3
Figure 3
FGF2 protects renal tubular cells from I/R‐induced apoptosis. (A) Representative sections of nuclear DNA fragmentation after 2 days of reperfusion. Staining was achieved by TdT‐mediated dUTP nick‐end labelling (TUNEL) immunofluorescence. Original magnification ×40, scale bars represent 50 μm. Results are representative of five animals in each group. (B) IHC staining for Cleaved caspase‐3 (Original magnification ×40, scale bars represent 50 μm). Data are representative of five animals in each group. (C) Western blot analyses of Cleaved caspase‐3 expression. GAPDH was used as a loading control. Representative data of three individual samples per group. (D) The optical density analysis of Cleaved caspase‐3 in the kidney. *P < 0.05 versus sham group, #P < 0.05 versus I/R group; $P < 0.05 versus I/R+FGF2 group. (E) The percentage of TUNEL‐positive cells was counted from five random 1 mm2 areas. Data are presented as the mean ± S.D. ***P < 0.001 versus sham group; ###P < 0.001 versus I/R group; $$$P < 0.001 versus I/R+FGF2 group.
Figure 4
Figure 4
FGF2 ameliorates pro‐apoptotic mitochondrial protein expression. (A) Immunoblot analysis of mitochondrial damage‐related proteins in the kidneys 2 days after reperfusion. (B‐D). Optical density analysis to quantify protein expression levels for Cytochrome C (Cyto‐C), Bax and Bcl2 in kidneys of sham rats, I/R rats, I/R+FGF2 rats and I/R+FGF2 + 5‐HD rats (mean ± S.E.; n = 5). **P < 0.01 and ***P < 0.001 versus sham group, #P < 0.01 versus I/R group, $P < 0.05 and $$P < 0.01 versus FGF2 + I/R group. (E) IHC staining of Cleaved caspase‐9 (original magnification ×20, scale bars represent 100 μm). Data are representative of five animals in each group.
Figure 5
Figure 5
FGF2 alleviates I/R‐induced mitochondrial oxidative damage. (A) Immunohistochemistry staining for 3‐nitrotyrosine and 8‐OHdG 2 days after reperfusion. Results show positive staining of 3‐nitrotyrosine and 8‐OHdG primarily localized in tubular epithelial cells. FGF2 treatment reduced 3‐nitrotyrosine and 8‐OHdG to levels similar to sham rats. Original magnification ×20, scale bars represent 100 μm. Renal tissue sections from 1 of 4 animals in each group are shown. (B) Western blot analysis of 3‐nitrotyrosine expression in the kidney. GAPDH was used as a loading control. (C) Optical density analysis to quantify protein expression for 3‐nitrotyrosine in the kidney (mean ± S.E.; n = 4). *P < 0.05 versus sham group, #P < 0.05 versus I/R group. (D) Detection of mitochondrial membrane potential (MMP) in kidney using the JC‐1 MMP detection Kit and confocal microscope imaging analysis. MMP declined in I/R kidney after 2 days of reperfusion as indicated by JC‐1 fluorescence shift from red towards green, a phenomenon reversed by FGF2 treatment. Original magnification ×20, scale bars represent 100 μm. Data are representative of five animals in each group. (E) MMP in freshly isolated kidney mitochondria was also measured by the JC‐1 MMP detection Kit. **P < 0.01 versus sham group, ##P < 0.01 versus I/R group, $P < 0.05 versus I/R+FGF2 group.
Figure 6
Figure 6
FGF2 contributes to maintain mitochondrial KATP channel expression and functional integrity. (A) Expression of mitochondrial ATP‐dependent potassium (KATP) channel subunit Kir6.2 was determined by immunofluorescence staining 2 days after reperfusion. Kir6.2 (in green) was widely distributed in renal tubular epithelial cells and was more abundant than VDAC (in red) in sham‐operated kidney, but Kir6.2 expression declined dramatically in I/R animals, which was largely reversed by FGF2 treatment. The effect of FGF2 in reversing the decrease of Kir6.2 expression is counteracted by 5‐HD co‐treatment. Results are representative of four animals from each group. (B) Western blot analysis of Kir6.2 protein expression. VDAC was used as an internal control. FGF2 treatment sustained Kir6.2 expression, but this effect was reversed by 5‐HD (mean ± S.E.; n = 4). **P < 0.01 versus sham group, #P < 0.05 versus I/R group, $P < 0.05 versus FGF2 + I/R group. (C) The optical density analysis of Kir6.2 in the kidney tissue sections.
Figure 7
Figure 7
Delayed FGF2 treatment exhibits potent protection against I/RI. Animals were divided into six groups, including sham‐operated control, I/RI group, and I/RI rat with FGF2 pre‐treatment or post‐I/R treatment at 1, 3 and 12 hrs, respectively, after reperfusion as indicated. Except for the animal survival analysis, which was carried out for 2 weeks, all other experiments were performed at 48 hrs after reperfusion. (A) The serum creatinine (Cr) levels of animals receiving indicated treatment, including sham‐operated (sham), ischaemia‐reperfusion (I/R), I/R pre‐treated with FGF2 (FGF2‐I/R), or I/R with delayed FGF2 treatment at 1, 3, or 12 hrs, respectively, after reperfusion as indicated. ***P < 0.001 versus sham group, ###P < 0.001 versus I/R group. (B) Representative H&E stained renal tissue sections. Original magnification ×20, scale bars represent 100 μm. (C) Histological evaluation and pathological scoring based on H&E staining. Renal tubular necrosis scores were calculated using the criteria and procedure described in the material and methods. Results are representative of eight animals in each group. ***P < 0.001 versus sham group), ###P < 0.001 versus I/R group. (D) Effect of FGF2 treatment on the survival of I/R rats. Twenty rats were assigned to each group as indicated and animal survival curves (Kaplan–Meier analysis) were constructed at 14 days after reperfusion. Upon 50 min. of ischaemic exposure, the survival rate of I/RI rats was 60% compared to 100% in sham‐operated control. Notably, FGF2 pre‐treatment (Pre‐FGF2) or delayed treatment (Post‐FGF2, 12 hrs after reperfusion) resulted in significantly increased animal survival rates (90% and 95%, respectively. P < 0.05 versus I/R alone group). There was no significant difference between pre‐ and post‐FGF2 group. (E) Renal protein extracts were subjected to Western blot analysis with indicated antibodies to determine the expression of Bcl2, Bax, 3‐NIT with GAPDH as loading control. (F–H) Optical density analysis to quantify the expression levels of Bax, Bcl‐2 and 3‐NIT, respectively, with indicated treatments. The data were shown as mean ± S.E. (n = 5). ***P < 0.001 versus sham group, ###P < 0.001 and #P < 0.05 versus I/R group.
Figure 8
Figure 8
FGF2 inhibits I/RI‐induced HMGB1 serum release and inflammatory response. Animals were divided into 5 groups (n = 4), including sham‐operated control, I/RI group, and I/RI with FGF2 pre‐treatment or delayed treatment at 1 and 12 hrs, respectively, after reperfusion as indicated. The samples were collected at 48 hrs following reperfusion for Western blot, ELISA, Immunohistochemistry staining (IHC) and qRT‐PCR analysis as detailed below. (A) Western blot analysis to determine the expression of HMGB1 and TNFα in renal tissues with GAPDH as loading control. (B) ELISA assay was used to determine the levels of HMGB1 in the serum of animals receiving indicated treatments. **P < 0.01 versus sham group, ##P < 0.01 versus I/R group. (C) IHC of kidney tissue sections for expression of HMGB1. Original magnification ×20. One representative area of renal tissue staining from 1 of 4 animals in each group is shown. (D) Real‐time PCR quantification of mRNA levels for KIM1, TLR2, TLR4, IL‐1α, IL‐6 and TNFα in the kidney, respectively. The result is normalized to GAPDH. The data are presented as mean ± S.E. (n = 4). ***P < 0.001, **P < 0.001 versus sham group; ###P < 0.001, #P < 0.05 versus I/R group.

References

    1. Schrier RW, Wang W, Poole B, et al Acute renal failure: definitions, diagnosis, pathogenesis, and therapy. J Clin Invest. 2004; 114: 5–14. - PMC - PubMed
    1. Chertow GM, Burdick E, Honour M, et al Acute kidney injury, mortality, length of stay, and costs in hospitalized patients. J Am Soc Nephrol. 2005; 16: 3365–70. - PubMed
    1. Ishani A, Xue JL, Himmelfarb J, et al Acute Kidney Injury Increases Risk of ESRD among Elderly. J Am Soc Nephrol. 2009; 20: 223–8. - PMC - PubMed
    1. Mehta RL. Outcomes research in acute renal failure. Semin Nephrol. 2003; 23: 283–94. - PubMed
    1. Bonventre JV, Yang L. Cellular pathophysiology of ischemic acute kidney injury. J Clin Invest. 2011; 121: 4210–21. - PMC - PubMed

MeSH terms

Associated data