Review
. 2017 Jun 1;109(10):758-770.
doi: 10.1002/bdr2.1051. Epub 2017 May 22.

Diverse application of MRI for mouse phenotyping

Affiliations
Review

Diverse application of MRI for mouse phenotyping

Yijen L Wu et al. Birth Defects Res. .

Abstract

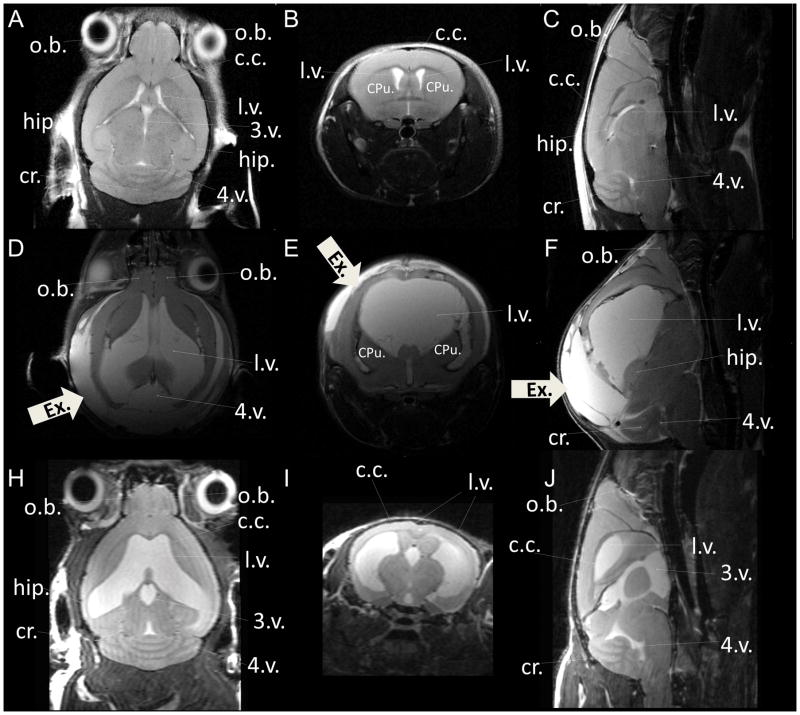
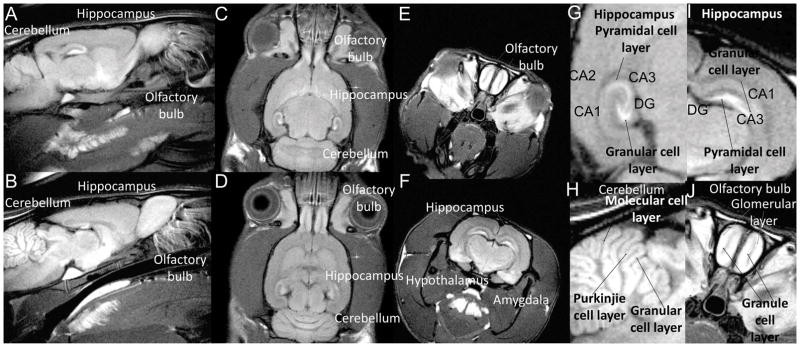
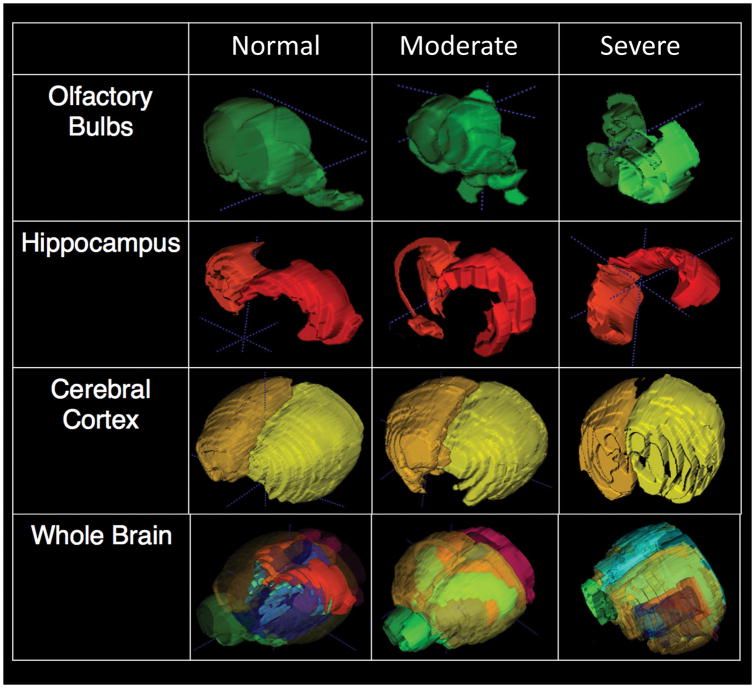
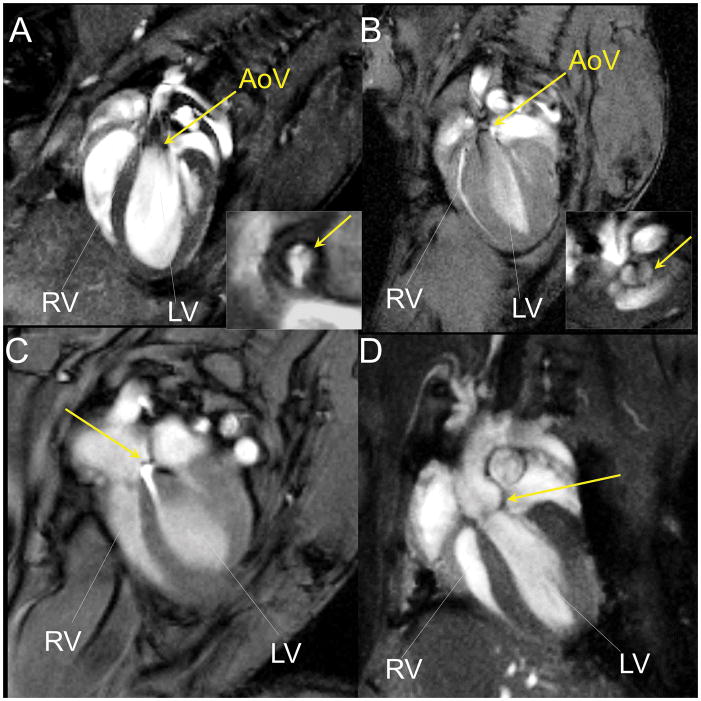
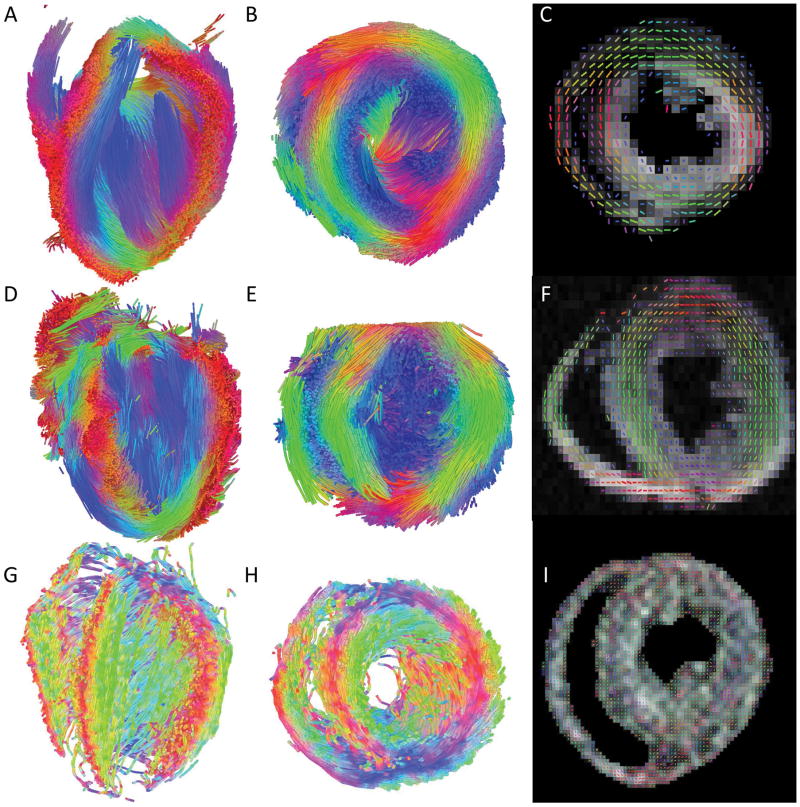
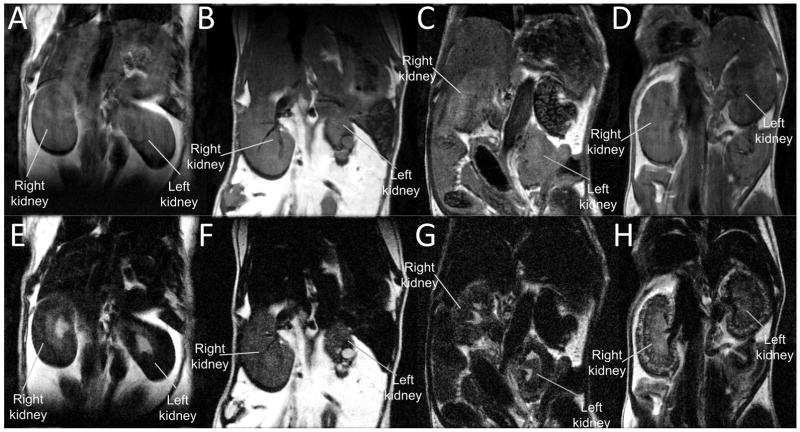
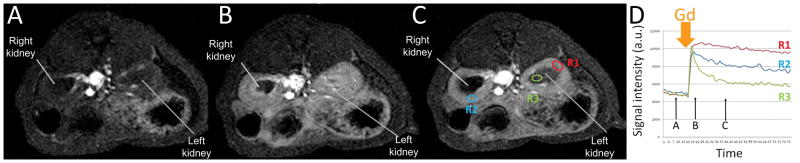
Small animal models, particularly mouse models, of human diseases are becoming an indispensable tool for biomedical research. Studies in animal models have provided important insights into the etiology of diseases and accelerated the development of therapeutic strategies. Detailed phenotypic characterization is essential, both for the development of such animal models and mechanistic studies into disease pathogenesis and testing the efficacy of experimental therapeutics. MRI is a versatile and noninvasive imaging modality with excellent penetration depth, tissue coverage, and soft tissue contrast. MRI, being a multi-modal imaging modality, together with proven imaging protocols and availability of good contrast agents, is ideally suited for phenotyping mutant mouse models. Here we describe the applications of MRI for phenotyping structural birth defects involving the brain, heart, and kidney in mice. The versatility of MRI and its ease of use are well suited to meet the rapidly increasing demands for mouse phenotyping in the coming age of functional genomics. Birth Defects Research 109:758-770, 2017. © 2017 Wiley Periodicals, Inc.

Keywords: MRI; brain; congenital malformation; diffusion tensor imaging; heart; kidney; magnetic resonance Imaging; mouse; mutant; tagging.


Figures

Figure 1
Figure 1
In vivo T2-weighted anatomical MRI of live mouse brain. (A–C) wild-type control mouse at 8 months of age; (D–F) homozygous mutant mouse with a single motile cilia gene mutation at 21 days of age; (H–J) homozygous mutant mouse with the same single motile cilia gene mutation at 13 months of age, showing a coronal view (A, D, H), an axial view (B, E, I), and a sagittal view (C, F, J) from the 3D volume stacks. The thick white arrowheads labeled with “Ex.” point to accumulation of extra-axial fluid in the hydrocephalus mutant. Images were acquired at 7-Tesla with in-plane resolution 66 μm and slice thickness 0.5 mm. o.b.= olfactory bulb; c.c.= corpus callosum; hip= hippocampus; cr.= cerebellum; l.v.= lateral ventricle; 3.v. = 3rd ventricle; 4.v. = 4th ventricle; CPu = caudate putamen.
Figure 2
Figure 2
3D maximum-intensity projection reconstruction of the in vivo 3D T2-weighted MRI, highlighting the ventricular systems and CSF in a WT control mouse. The 3D T2-weighted MRI was acquired at 7T with the voxel size: 98 μm x 98 μm x 156 μm. (A–F) Still shots of 3D rendering at different viewing angles, indicated by the 3D viewing orientation on the upper right corner of each panel. L: left; R: right; A: anterior; P: posterior; S: sagittal.
Figure 3
Figure 3
In vivo T1-weighted MRI 2 days after systemic Mn2+ administration of a WT control animal. (A, B) sagittal view; (C, D) axial view; (E, F) coronal view. (G, H) Enlarged partial view to show hippocampus; (H) enlarged partial view to show cerebellum; (J) enlarged partial view to show olfactory bulb. DG=dentate gyrus. [Taken from Yijen Lin Wu Ph.D. dissertation (Lin and Koretsky, 1997a).]
Figure 4
Figure 4
Volumetric and morphometric analysis of the brain from the in vivo T2-weighted MRI. (left) normal WT mouse; (middle) homozygous mutant mouse with moderate hydrocephalus; (right) homozygous mutant mouse with very severe hydrocephalus. Examples of segmentation of different regions of interest (ROS) are shown for olfactory bulb, hippocampus, cerebral cortex, and the combined ROIs of the whole brain.
Figure 5
Figure 5
Diffusion MRI tractography and network analysis of a WT control mouse (A, C) and a homozygous mutant mouse (B, D). (A, B) Diffusion MRI tractography showing neuronal tracks and projections. (C, D) The connectogram plots the overall connectivity to illustrates the connection strength. A total of 13 ROIs were manually assigned independently. The ROIs were used as the brain parcellation, and the connectivity matrix was calculated by using count of the connecting tracks. Brain regions: CTX -Cerebral cortex, STR –Striatum, PAL-Pallidum, BS-Brain stem, IB-Interbrain, TH-Thalamus, HY- Hypothalamus, MB-Midbrain, HB-Hindbrain, P-Pons, MY-Medulla, CB-Cerebellum.
Figure 6
Figure 6
Cine cardiac MRI (A–D) a WT control mouse and (E–H) a situs inverses totalis homozygous mutant mouse at ED (A, C, E, G) and ES (B, D, F, H), showing long-axis view (A, B, E, F) and short-axis view (C, D, G, H). WT: wild type; SIT: situs inverses totalis mutant; ED: end-diastole; ES: end-systole; LV: left ventricle; RV: right ventricle. The L/R with the double arrowheads indicates the left (L) and right (R) side of the body.
Figure 7
Figure 7
CMR of mutant mice with congenital heart anomaly. (A) A mouse with normal aortic outflow and tricuspid aortic valve (the insect). The yellow arrows point to the aortic valve. (B) A mutant mouse with aortic stenosis and bicuspid aortic valve (the insect). The yellow arrows point to the aortic valve. (C) A mutant mouse with atrial septal defect (ASD). The yellow arrow points to the jet of blood flowing from left atrium to the right atrium. (D) A mutant mouse with dilated aortic root. The yellow arrow points to the aortic root. Abbreviation: LV - left ventricle, RV - right ventricle, AoV - aortic valve.
Figure 8
Figure 8
Tagging MRI for regional wall motion and strain analysis of a mouse heart. (A) Short-axis tagging at the end diastole; (B) short-axis tagging at the end systole; (C) schematic drawing showing the directions of the radial strain (Err), circumferential strain (Ecc); and the longitudinal strain (Ell) on a short-axis view. (D) Temporal changes of mean Ecc of 18 animals with different degrees of wall motion capability. The X-axis is the time expressed in % of cardiac cycle. The y-axis is the mean Ecc values of the myocardium from each animal from the mid-level short-axis imaging plane. Each line with different color is from each individual animal. (E) American Heart Association 6-segment model of a short-axis view, dividing myocardium into 6 regions: R6, anterior; R5, anteriolateral; R4, lateral; R3, inferior; R2, inferioseptal; and R1, anterioseptal. LV: left ventricle; RV: left ventricle. (F) a bullseye view of Ecc values for 4 short-axis slices, each with 6 segments. The 4 circular rings represent 4 short-axis planes with the apical planes toward the middle and the basal planes on the outside. The black arrow indicates the intersecting point of RV and LV, the starting point of the septal wall. The 6 segment is divided as in E. The mean peak Ecc of each segment is shown, according to the color scales on the right.
Figure 9
Figure 9
DTI of a WT control heart (A–C) and 2 mutant (D–I) hearts. (A, B, D, E, G, H) Diffusion MRI tractography with the long-axis view (A, D, G) and a short-axis view (B, E, H) and (C, F, I) fiber orientation mapping.
Figure 10
Figure 10
In vivo T2-weighted MRI for kidneys. (A, E) WT control mouse; (B, F) mutant mouse with dysplastic kidneys; (C, G) mutant mouse with hydronephrosis; (D, H) mutant mouse with polycystic kidneys. (A–D) MRI with shorter echo time, TE = 10 msec; (E–H) MRI with longer echo time, TE = 84 msec, acquired at 7-Tesla.
Figure 11
Figure 11
Renal perfusion by dynamic contrast-enhanced MRI (DCE-MRI) in a WT control animal with temporal resolution 43 sec per frame. (A–C) T1-weighted MRI acquired at the time points indicated in D; (D) temporal evolution of signal obtained at 3 different regions of interest (ROI) as indicated in C. ROI 1(R1, red) is from the left cortex, ROI 2 (R2, blue) is from the right cortex; and ROI 3 (green R3) is from the left medulla. The Y axis is the mean signal intensity in each ROI with arbitrary unit (a.u.). The X axis is time in sec. The time for single intravenous Gd bolus injection (MultiHance, gadobenate dimeglumine, 0.2 mmol/kg body weight) is indicated by the thick orange arrow.

Similar articles

Cited by

References

    1. Ackerman JJH, Neil JJ. Biophysics of Diffusion in Cells. In: Jones DK, editor. Diffusion MRI: Theory, Methods and Applications. Oxford U. Press; Oxford: 2010. pp. 110–124.
    1. Ahrens ET, Laidlaw DH, Readhead C, Brosnan CF, Fraser SE, Jacobs RE. MR microscopy of transgenic mice that spontaneously acquire experimental allergic encephalomyelitis. Magnetic resonance in medicine. 1998;40:119–132. - PubMed
    1. Alexander AL, Lee JE, Lazar M, Field AS. Diffusion tensor imaging of the brain. Neurotherapeutics : the journal of the American Society for Experimental NeuroTherapeutics. 2007;4:316–329. - PMC - PubMed
    1. Alexander DC, Barker GJ. Optimal imaging parameters for fiber-orientation estimation in diffusion MRI. NeuroImage. 2005;27:357–367. - PubMed
    1. Allan TW, Besle J, Langers DR, Davies J, Hall DA, Palmer AR, Adjamian P. Neuroanatomical Alterations in Tinnitus Assessed with Magnetic Resonance Imaging. Front Aging Neurosci. 2016;8:221. - PMC - PubMed

LinkOut - more resources