. 2017 May 17;13(5):e1006391.
doi: 10.1371/journal.ppat.1006391. eCollection 2017 May.

Microbiota-induced peritrophic matrix regulates midgut homeostasis and prevents systemic infection of malaria vector mosquitoes

Affiliations

Microbiota-induced peritrophic matrix regulates midgut homeostasis and prevents systemic infection of malaria vector mosquitoes

Faye H Rodgers et al. PLoS Pathog. .

Abstract

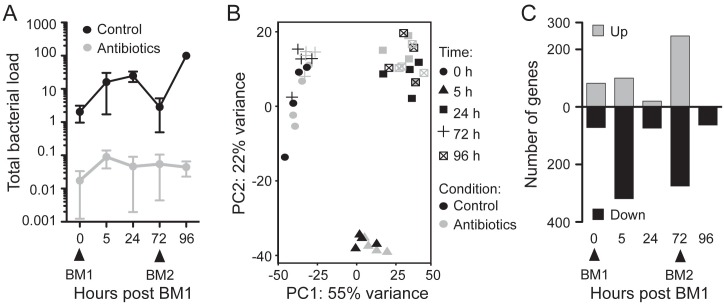
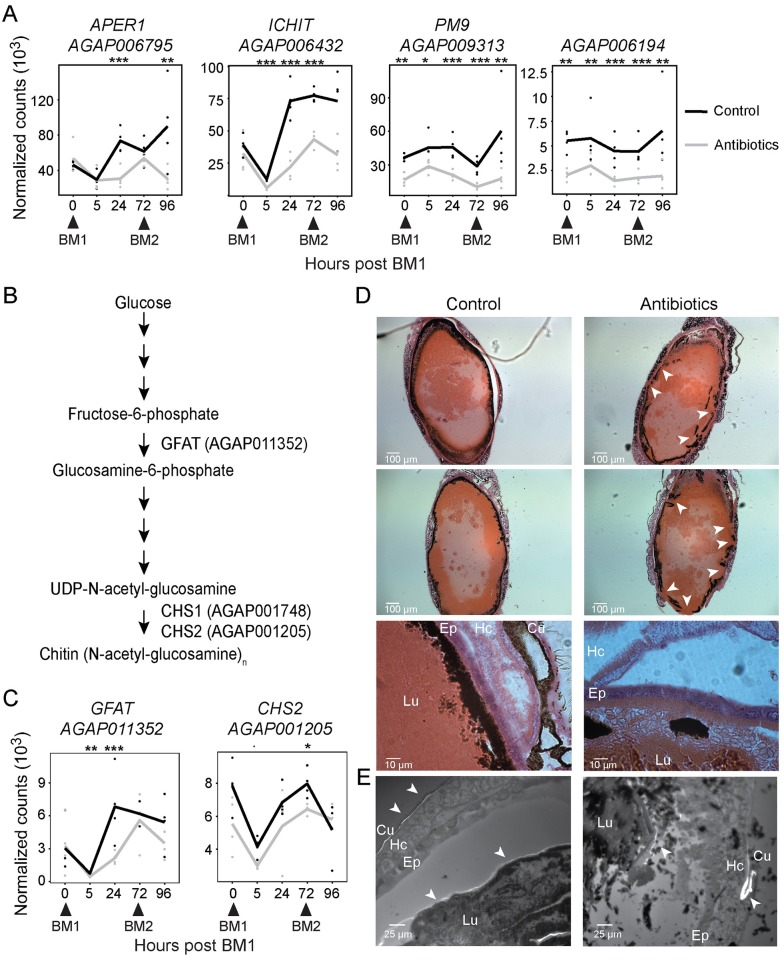
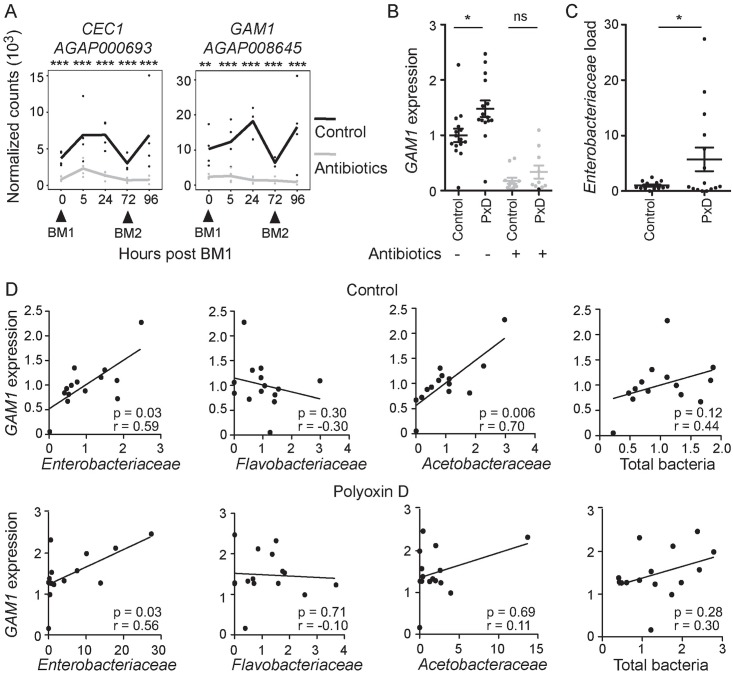
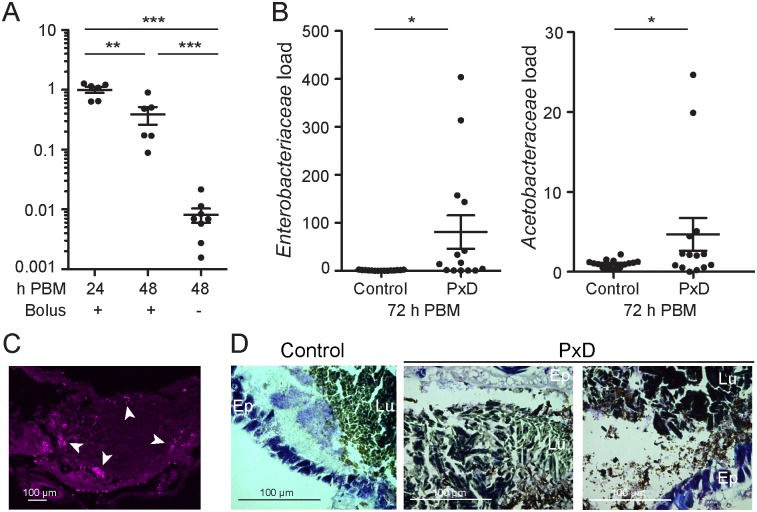
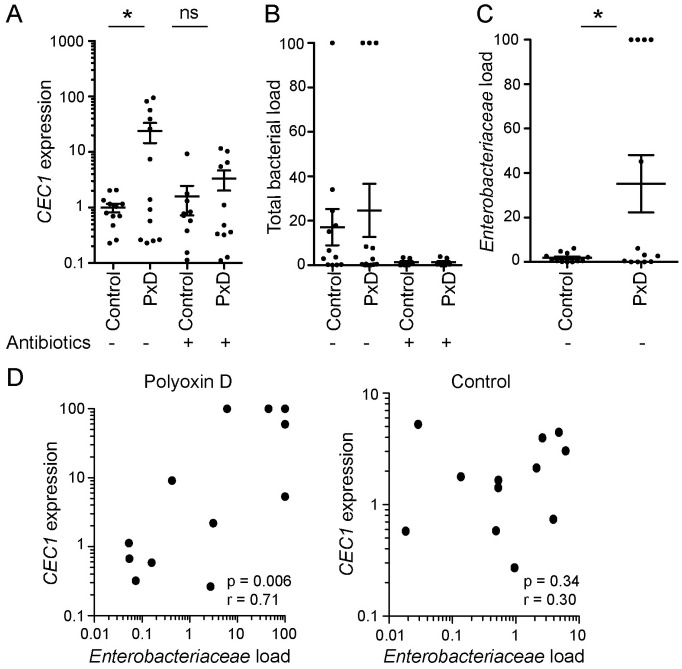
Manipulation of the mosquito gut microbiota can lay the foundations for novel methods for disease transmission control. Mosquito blood feeding triggers a significant, transient increase of the gut microbiota, but little is known about the mechanisms by which the mosquito controls this bacterial growth whilst limiting inflammation of the gut epithelium. Here, we investigate the gut epithelial response to the changing microbiota load upon blood feeding in the malaria vector Anopheles coluzzii. We show that the synthesis and integrity of the peritrophic matrix, which physically separates the gut epithelium from its luminal contents, is microbiota dependent. We reveal that the peritrophic matrix limits the growth and persistence of Enterobacteriaceae within the gut, whilst preventing seeding of a systemic infection. Our results demonstrate that the peritrophic matrix is a key regulator of mosquito gut homeostasis and establish functional analogies between this and the mucus layers of the mammalian gastrointestinal tract.


Conflict of interest statement

The authors have declared that no competing interests exist.

Figures

Fig 1
Fig 1. Effect of oral antibiotic treatment on the gene expression of the mosquito midgut.
(A) Bacterial load in the guts of 4 control and 4 antibiotic treated mosquito cohorts throughout a two blood meal (BM1 and BM2) time course assessed by qRT-PCR using universal 16S primers. Data were normalized within each biological replicate to the bacterial load in the control 96h sample. The mean plus/minus the standard error is shown. (B) Principal components analysis (PCA) plot of the 40 sequenced midgut samples after variance stabilizing transformation of count data. (C) Number of genes that were significantly upregulated (white bars) or downregulated (black bars) in each of the time points following antibiotic treatment. Genes showing an adjusted p-value <0.1 (Wald test with a Benjamini-Hochberg correction) were considered to be significantly regulated.
Fig 2
Fig 2. Antibiotic treatment compromises the production and integrity of the peritrophic matrix.
(A) Transcriptional profiles of four genes encoding putative components of the peritrophic matrix in the midguts of control (black line) and antibiotic-treated (grey line) mosquitoes over a course of two consecutive blood meals (BM1 and BM2). Dots indicate normalized counts of each of four biological replicates, with the lines connecting the means. Statistical significance of a pairwise comparison of counts at each time point using the Wald test with Benjamini-Hochberg correction is indicated: ‘.’ p<0.1; ‘*’ p<0.05; ‘**’ p<0.01; ‘***’ p<0.001 (B) Schematic of the chitin synthesis pathway in insects. Gene IDs indicate genes in the A. gambiae PEST genome annotated with the indicated enzyme activity. GFAT; glucosamine-fructose-6-phosphate aminotransferase, CHS1; chitin synthase 1, CHS2; chitin synthase 2. (C) Transcriptional profiles of the GFAT and CHS2 encoding genes during the course of two consecutive blood meals (BM1 and BM2) following antibiotic-treated (grey line) compared to non-treated (black line) controls. Dots and stars indicate counts and p-values as explained in (A). (D) H&E stained thin sections of engorged midguts 24h post blood feeding with or without antibiotic supplementation. Arrowheads indicate regions of apparent disruption of the PM integrity. (E) Calcofluor white stained thin sections of engorged mosquitoes 24h post blood feeding with or without antibiotic supplementation. Arrowheads indicate staining of the abdominal cuticle and the peritrophic matrix. For (D) and (E): “Lu” lumen; “Ep” epithelium; “Hc” hemocoel; “Cu” cuticle.
Fig 3
Fig 3. The peritrophic matrix regulates immune resistance to the microbiota.
(A) RNA-seq transcriptional profiles of CEC1 and GAM1 in the midgut of control (black lines) and antibiotic fed (grey lines) mosquitoes over a two blood meal (BM1 and BM2) time course. Dots indicate normalized counts in each of four biological replicates, with the line connecting the means. Statistical significance of a pairwise comparison of counts at each time point was assessed by a Wald test with a Benjamini-Hochberg correction. ‘*’ p<0.05; ‘**’ p<0.01; ‘***’ p<0.001 (B) GAM1 expression, relative to AgS7, in the midgut 24h after feeding with blood supplemented with 100μM polyoxin D (PxD) or an equal volume of water (control), plus or minus antibiotic treatment, as determined by qRT-PCR. Mean plus/minus standard error is indicated. Statistical significance was assessed by an ANOVA on a linear mixed effect regression model. Each dot represents a pool of 8–10 guts, derived from 4–5 independent experiments. Ratios are normalized within biological replicates to the mean of the control pools (no polyoxin D, no antibiotics). (C) Enterobacteriaceae load, relative to AgS7, as determined by qRT-PCR using Enterobacteriaceae specific 16S primers. Normalization and statistical analysis were performed as described for (B). (D) Scatter plots of the load of specific bacteria families commonly found in the mosquito gut against GAM1 expression in the midguts of control (top row) or polyoxin D-treated (bottom row) mosquitoes. Spearman’s rank correlation coefficient (r) and associated p-values (p) are indicated.
Fig 4
Fig 4. The peritrophic matrix promotes restoration of gut homeostasis after blood feeding.
(A) Midgut bacterial load at 24h and 48h after a blood meal, as determined by qRT-PCR. At 48h, midguts were pooled according to whether (+) or not (-) the blood bolus was present. Each dot represents a pool of 5 guts, derived from two independent experiments. Ratios are normalized within biological replicates to the mean of the 24h pools. Mean plus/minus standard error is indicated. Statistical significance was assessed by an ANOVA on a linear mixed effect regression model. ‘*’ p<0.05; ‘**’ p<0.01; ‘***’ p<0.001. (B) Enterobacteriaceae and Acetobacteraceae load in midguts 72h after feeding on blood supplemented with 100μM polyoxin D (PxD) or an equal volume of water (control), as determined by qRT-PCR. Each dot represents a pool of 8–10 guts, derived from 4 independent experiments. Ratios are normalized within biological replicates to the mean of the control pools. Mean plus/minus standard error is indicated. Statistical significance was assessed and is presented as described above. (C) Thin abdominal section 24h post blood meal stained with anti-LPS antibody. White arrowheads indicate LPS staining. (D) Gram-stained thin abdominal sections 24h post blood meal, with or without polyoxin D supplementation. Bacteria are stained light purple. “Lu” lumen; “Ep” epithelium.
Fig 5
Fig 5. The peritrophic matrix prevents microbiota dissemination and systemic immune induction.
(A-C) CEC1 expression (A), 16S rRNA quantification (B) and Enterobacteriaceae 16S rRNA quantification (C) in the carcass 72h after feeding with a blood meal supplemented with 100μM polyoxin D or water as a control, plus or minus antibiotic treatment, as determined by qRT-PCR. Each dot represents a pool of 8–10 carcasses, derived from 4 independent experiments. Data show mean and standard error. In A, ratios are normalized within biological replicates to the mean of the control pools (no polyoxin D, no antibiotics). In B-C, ratios are normalized within each biological replicate to the highest value across all conditions (‘100%’). In A-C, statistical significance was assessed by an ANOVA on a linear mixed effect regression model. (D) Scatter plots of relative Enterobacteriaceae load against CEC1 expression in the carcass at 72h post blood feeding. Each dot represents a pool of 8–10 carcasses, derived from 4 independent experiments; data are normalized as in B and C. Spearman’s rank correlation coefficient and associated p-values are indicated. ‘*’ p<0.05.

Similar articles

Cited by

References

    1. Dong Y, Manfredini F, Dimopoulos G. Implication of the mosquito midgut microbiota in the defense against malaria parasites. PLoS Pathog. 2009;5:e1000423 10.1371/journal.ppat.1000423 - DOI - PMC - PubMed
    1. Meister S, Agianian B, Turlure F, Relógio A, Morlais I, Kafatos FC, et al. Anopheles gambiae PGRPLC-mediated defense against bacteria modulates infections with malaria parasites. Schneider DS, editor. PLoS Pathog. Public Library of Science; 2009;5:e1000542. - PMC - PubMed
    1. Cirimotich CM, Ramirez JL, Dimopoulos G. Native Microbiota Shape Insect Vector Competence for Human Pathogens. Cell Host Microbe. 2011;10:307–10. 10.1016/j.chom.2011.09.006 - DOI - PMC - PubMed
    1. Bahia AC, Dong Y, Blumberg BJ, Mlambo G, Tripathi A, BenMarzouk-Hidalgo OJ, et al. Exploring Anopheles gut bacteria for Plasmodium blocking activity. Environ. Microbiol. 2014;16:2980–94. 10.1111/1462-2920.12381 - DOI - PMC - PubMed
    1. Wang S, Ghosh AK, Bongio N, Stebbings KA, Lampe DJ, Jacobs-Lorena M. Fighting malaria with engineered symbiotic bacteria from vector mosquitoes. Proc. Natl. Acad. Sci. U. S. A. 2012;109:12734–9. 10.1073/pnas.1204158109 - DOI - PMC - PubMed