. 2017 May 18;13(5):e1005457.
doi: 10.1371/journal.pcbi.1005457. eCollection 2017 May.

Transcriptomics technologies

Affiliations

Transcriptomics technologies

Rohan Lowe et al. PLoS Comput Biol. .

Abstract

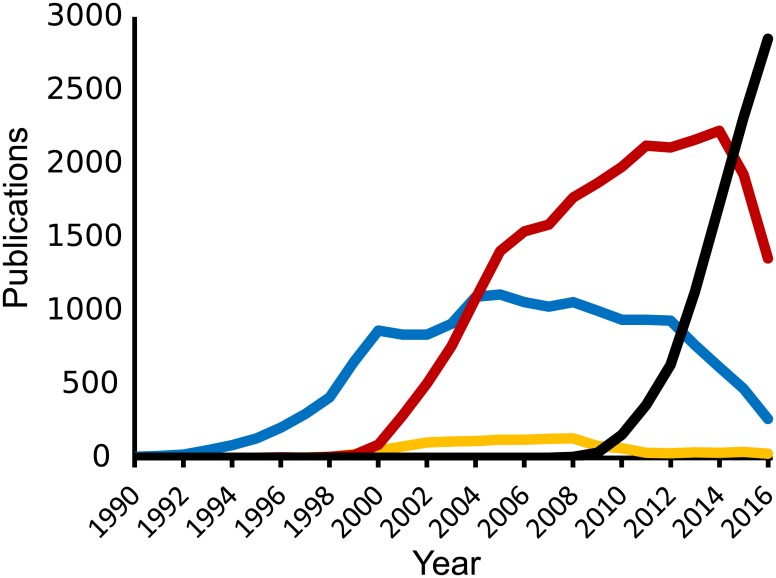
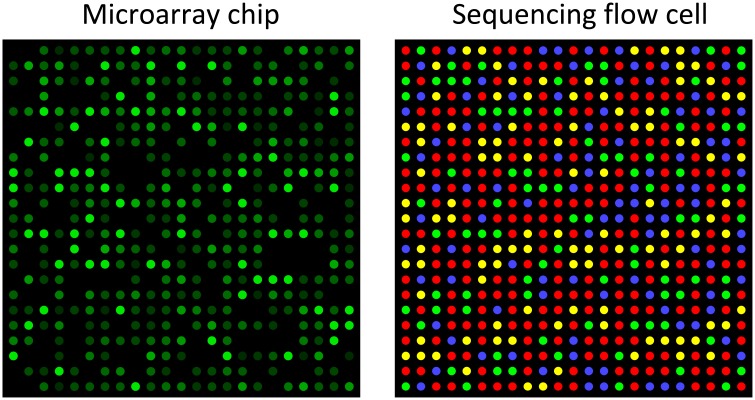
Transcriptomics technologies are the techniques used to study an organism's transcriptome, the sum of all of its RNA transcripts. The information content of an organism is recorded in the DNA of its genome and expressed through transcription. Here, mRNA serves as a transient intermediary molecule in the information network, whilst noncoding RNAs perform additional diverse functions. A transcriptome captures a snapshot in time of the total transcripts present in a cell. The first attempts to study the whole transcriptome began in the early 1990s, and technological advances since the late 1990s have made transcriptomics a widespread discipline. Transcriptomics has been defined by repeated technological innovations that transform the field. There are two key contemporary techniques in the field: microarrays, which quantify a set of predetermined sequences, and RNA sequencing (RNA-Seq), which uses high-throughput sequencing to capture all sequences. Measuring the expression of an organism's genes in different tissues, conditions, or time points gives information on how genes are regulated and reveals details of an organism's biology. It can also help to infer the functions of previously unannotated genes. Transcriptomic analysis has enabled the study of how gene expression changes in different organisms and has been instrumental in the understanding of human disease. An analysis of gene expression in its entirety allows detection of broad coordinated trends which cannot be discerned by more targeted assays.


Conflict of interest statement

The authors have declared that no competing interests exist.

Figures

Fig 1
Fig 1. Transcriptomics method use over time.
Published papers since 1990, referring to RNA sequencing (black), RNA microarray (red), expressed sequence tag (blue), and serial/cap analysis of gene expression (yellow)[12].
Fig 2
Fig 2. Summary of SAGE.
Within the organisms, genes are transcribed and spliced (in eukaryotes) to produce mature mRNA transcripts (red). The mRNA is extracted from the organism, and reverse transcriptase is used to copy the mRNA into stable double-stranded–cDNA (ds-cDNA; blue). In SAGE, the ds-cDNA is digested by restriction enzymes (at location “X” and “X”+11) to produce 11-nucleotide “tag” fragments. These tags are concatenated and sequenced using long-read Sanger sequencing (different shades of blue indicate tags from different genes). The sequences are deconvoluted to find the frequency of each tag. The tag frequency can be used to report on transcription of the gene that the tag came from.
Fig 3
Fig 3. Summary of DNA microarrays.
Within the organisms, genes are transcribed and spliced (in eukaryotes) to produce mature mRNA transcripts (red). The mRNA is extracted from the organism and reverse transcriptase is used to copy the mRNA into stable double-stranded–cDNA (ds-cDNA; blue). In microarrays, the ds-cDNA is fragmented and fluorescently labelled (orange). The labelled fragments bind to an ordered array of complementary oligonucleotides, and measurement of fluorescent intensity across the array indicates the abundance of a predetermined set of sequences. These sequences are typically specifically chosen to report on genes of interest within the organism's genome.
Fig 4
Fig 4. Summary of RNA sequencing.
Within the organisms, genes are transcribed and spliced (in eukaryotes) to produce mature mRNA transcripts (red). The mRNA is extracted from the organism, fragmented and copied into stable double-stranded–cDNA (ds-cDNA; blue). The ds-cDNA is sequenced using high-throughput, short-read sequencing methods. These sequences can then be aligned to a reference genome sequence to reconstruct which genome regions were being transcribed. These data can be used to annotate where expressed genes are, their relative expression levels, and any alternative splice variants.
Fig 5
Fig 5. Microarray and sequencing flow cell.
Microarrays and RNA sequencing (RNA-Seq) rely on image analysis in different ways. In a microarray chip, each spot on a chip is a defined oligonucleotide probe, and fluorescence intensity directly detects the abundance of a specific sequence (Affymetrix, Santa Clara, CA). In a high-throughput sequencing flow cell, spots are sequenced one nucleotide at a time, with the colour at each round indicating the next nucleotide in the sequence (Illumina Hiseq, San Diego, CA). Other variations of these techniques use more or fewer colour channels.
Fig 6
Fig 6. identification of gene co-expression patterns across different samples.
Heatmap Each column contains the measurements for gene expression change for a single sample. Relative gene expression is indicated by colour: high-expression (red), median-expression (white) and low-expression (blue). Genes and samples with similar expression profiles can be automatically grouped (left and top trees). Samples may be different individuals, tissues, environments, or health conditions. In this example, expression of gene set 1 is high and expression of gene set 2 is low in samples 1, 2, and 3.

References

    1. Adams MD, Kelley JM, Gocayne JD, Dubnick M, Polymeropoulos MH, Xiao H, et al. Complementary DNA sequencing: expressed sequence tags and human genome project. Science. 1991;252:1651–6. - PubMed
    1. Pan Q, Shai O, Lee LJ, Frey BJ & Blencowe BJ. Deep surveying of alternative splicing complexity in the human transcriptome by high-throughput sequencing. Nat. Genet. 2008;40:1413–5. 10.1038/ng.259 - DOI - PubMed
    1. Sultan M, Schulz MH, Richard H, Magen A, Klingenhoff A, Scherf M, et al. A global view of gene activity and alternative splicing by deep sequencing of the human transcriptome. Science. 2008;321:956–60. 10.1126/science.1160342 - DOI - PubMed
    1. Lappalainen T, Sammeth M, Friedländer MR, ‘t Hoen PA, Monlong J, Rivas MA, et al. Transcriptome and genome sequencing uncovers functional variation in humans. Nature. 2013;501:506–11. 10.1038/nature12531 - DOI - PMC - PubMed
    1. Melé M, Ferreira PG, Reverter F, DeLuca DS, Monlong J, Sammeth M, et al. Human genomics. The human transcriptome across tissues and individuals. Science. 2015;348:660–5. 10.1126/science.aaa0355 - DOI - PMC - PubMed

Publication types