. 2017 May 25;18(1):276.
doi: 10.1186/s12859-017-1688-7.

quantGenius: implementation of a decision support system for qPCR-based gene quantification

Affiliations

quantGenius: implementation of a decision support system for qPCR-based gene quantification

Špela Baebler et al. BMC Bioinformatics. .

Abstract

Background: Quantitative molecular biology remains a challenge for researchers due to inconsistent approaches for control of errors in the final results. Due to several factors that can influence the final result, quantitative analysis and interpretation of qPCR data are still not trivial. Together with the development of high-throughput qPCR platforms, there is a need for a tool allowing for robust, reliable and fast nucleic acid quantification.

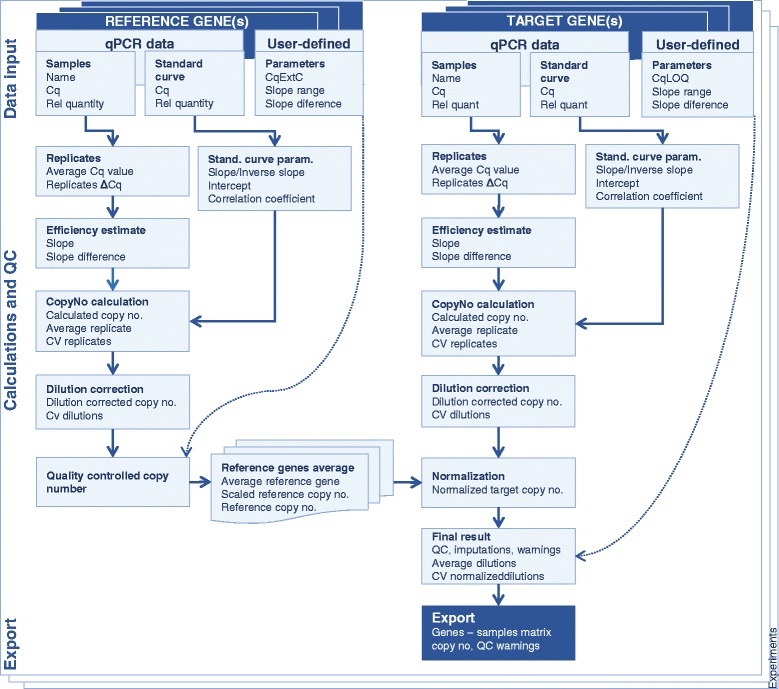
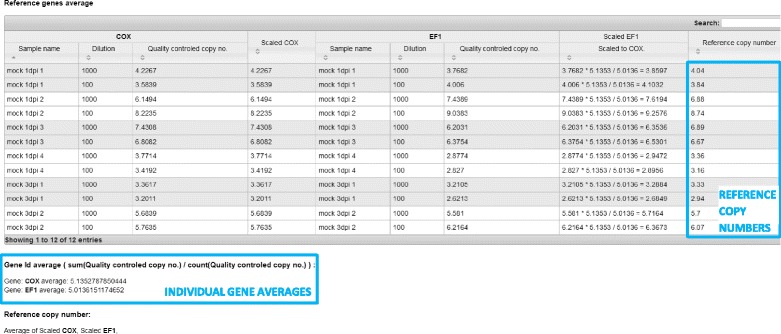
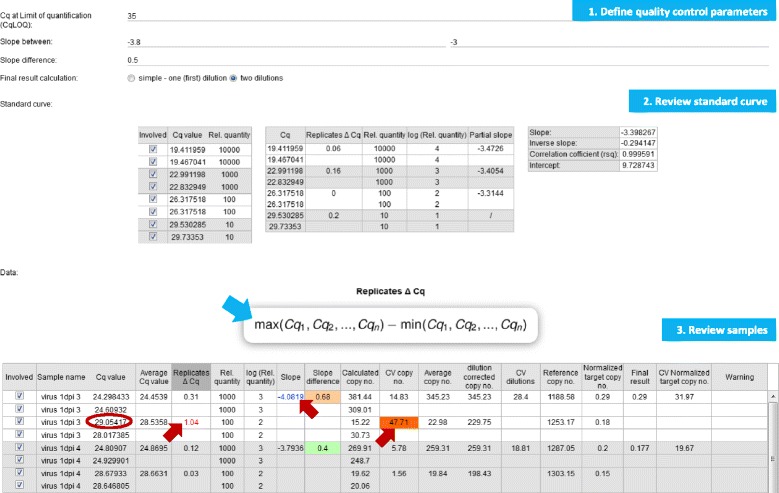
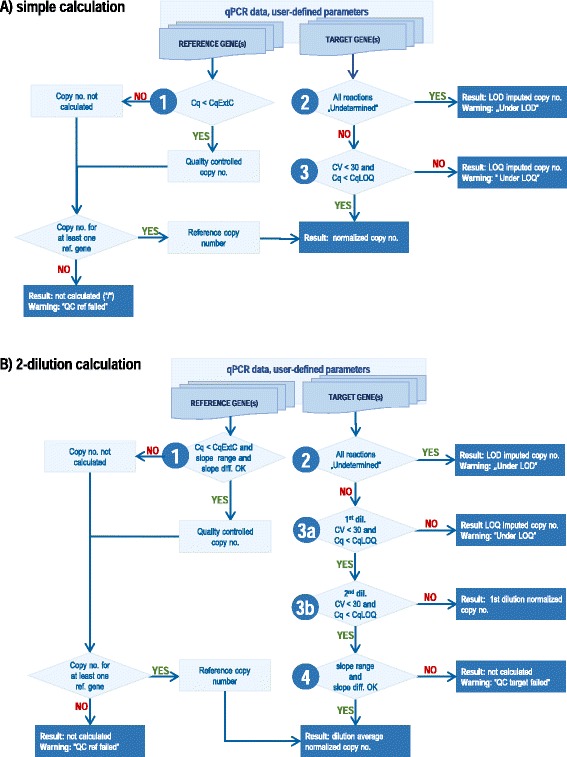
Results: We have developed "quantGenius" ( http://quantgenius.nib.si ), an open-access web application for a reliable qPCR-based quantification of nucleic acids. The quantGenius workflow interactively guides the user through data import, quality control (QC) and calculation steps. The input is machine- and chemistry-independent. Quantification is performed using the standard curve approach, with normalization to one or several reference genes. The special feature of the application is the implementation of user-guided QC-based decision support system, based on qPCR standards, that takes into account pipetting errors, assay amplification efficiencies, limits of detection and quantification of the assays as well as the control of PCR inhibition in individual samples. The intermediate calculations and final results are exportable in a data matrix suitable for further statistical analysis or visualization. We additionally compare the most important features of quantGenius with similar advanced software tools and illustrate the importance of proper QC system in the analysis of qPCR data in two use cases.

Conclusions: To our knowledge, quantGenius is the only qPCR data analysis tool that integrates QC-based decision support and will help scientists to obtain reliable results which are the basis for biologically meaningful data interpretation.

Keywords: Decision support system; Nucleic acid quantification; Quantitative PCR; Quantitative molecular biology; Web application.


Figures

Fig. 1
Fig. 1
quantGenius workflow. The data for the target and reference genes is imported and quality controlled. Relative copy numbers are calculated using standard curve parameters and normalized. The final results are exported as a gene-sample matrix. The calculation steps are marked with bold, while the calculated parameters are listed below with regular letters. All the formulas used for calculations (Equations 1–25) are available in the Additional file 2. Abbreviations: Cq – quantification cycle, Rel. - relative no.- number, Std. – standard, QC – quality control, CV - coefficient of variation, CqExtC – Cq value of the extraction control, CqLOQ – Cq value of the limit of quantification
Fig. 2
Fig. 2
Screenshot of the calculation of the reference copy numbers. An example of two reference genes (COX and EF-1) is shown. The second imported reference gene (EF-1) is scaled to the average of the first reference gene imported and the average of both values is calculated. The calculations are performed for each dilution separately
Fig. 3
Fig. 3
Screenshot of the individual gene calculations. The calculations are done in three steps. 1) QC parameters CqLOQ, CqExtC, slope range, and slope difference and calculation mode are defined by the user. 2) Standard curve is reviewed for possible outlier reactions. 3) Sample reactions are reviewed. The pipetting error (red circle) causes deviations from the predefined QC parameters (red arrows). All formulas used for the calculations can be viewed (blue arrow)
Fig. 4
Fig. 4
quantGenius quality control-based decision support system (DSS). Decision tree case of (a) simple (one-dilution) calculation and (b) two-dilution calculation. The following QC control steps are implemented hierarchically: 1) extraction control, 2) limit of detection 3) limit of quantification, and 4) individual sample efficiency of amplification control. Based on the DSS, the final result is calculated (blue boxes), modified (orange boxes) or not given (red boxes) and warnings are issued. Abbreviations: Cq – quantification cycle, CqExtC – Cq value of the extraction control, no. – number, CqLOQ – Cq value of the limit of quantification, dil. – dilution, QC – quality control, CV - coefficient of variation
Fig. 5
Fig. 5
Importance of implemented QC-DSS as shown in the gene expression use case. Expression of two target genes (PR1-b, upper panel and Glu-II, lower panel) was analysed in mock- and virus-inoculated potato plants at one, three and six days post infection (dpi). EF-1 and COX were used for normalization [16], (Additional file 6). Relative expression values obtained by quantGenius (cross) are compared to the ones obtained using standard curve quantification without QC performed (std curve, circle) and the ΔΔCq quantification approach (ΔΔCq, diamond). To get comparable values in the three approaches, the results of each approach were normalized to one of the samples (virus 3dpi 2) and then scaled to the average expression of the first experimental group (mock 1dpi). a arrows - examples of samples with Cq values near LOQ showing high variability among the quantification approaches used. b arrows - examples of outlier samples with an efficiency problem detected in either the target or the reference gene where results are not calculated in quantGenius

References

    1. Bustin SA, Benes V, Garson JA, Hellemans J, Huggett J, Kubista M, et al. The MIQE guidelines: minimum information for publication of quantitative real-time PCR experiments. Clin Chem. 2009;55:611–22. doi: 10.1373/clinchem.2008.112797. - DOI - PubMed
    1. Bustin S. Absolute quantification of mRNA using real-time reverse transcription polymerase chain reaction assays. J Mol Endocrinol. 2000;25:169–93. doi: 10.1677/jme.0.0250169. - DOI - PubMed
    1. Žel J, Milavec M, Morisset D, Plan D, Van den Eede G, Gruden K. How to reliably test for GMOs (SpringerBriefs in food, health, and nutrition) New York: Springer; 2012.
    1. Nolan T, Huggett J, Sanchez E. Good practice guide for the application of quantitative PCR (qPCR). LGC. 2013. http://www.gene-quantification.de/national-measurement-system-qpcr-guide.... Accessed 19 May 2017.
    1. Karlen Y, McNair A, Perseguers S, Mazza C, Mermod N. Statistical significance of quantitative PCR. BMC Bioinformatics. 2007;8:131. doi: 10.1186/1471-2105-8-131. - DOI - PMC - PubMed

MeSH terms