. 2017 Aug;222(8-9):900-912.
doi: 10.1016/j.imbio.2017.05.011. Epub 2017 May 16.

Macrophage-specific nanotechnology-driven CD163 overexpression in human macrophages results in an M2 phenotype under inflammatory conditions

Affiliations

Macrophage-specific nanotechnology-driven CD163 overexpression in human macrophages results in an M2 phenotype under inflammatory conditions

Perla Abigail Alvarado-Vazquez et al. Immunobiology. 2017 Aug.

Abstract

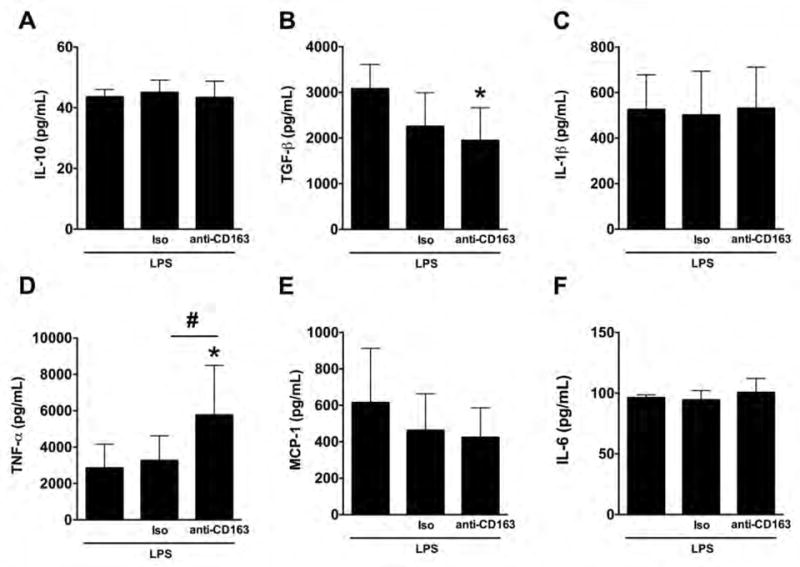
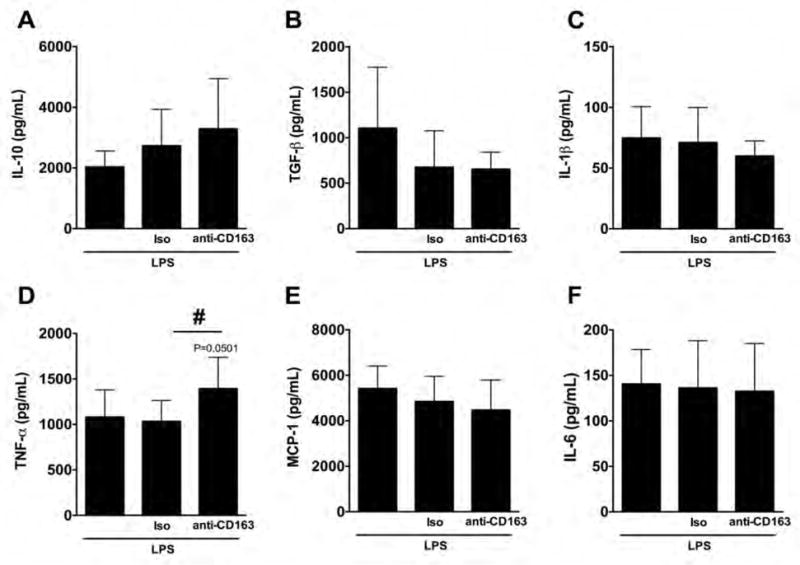
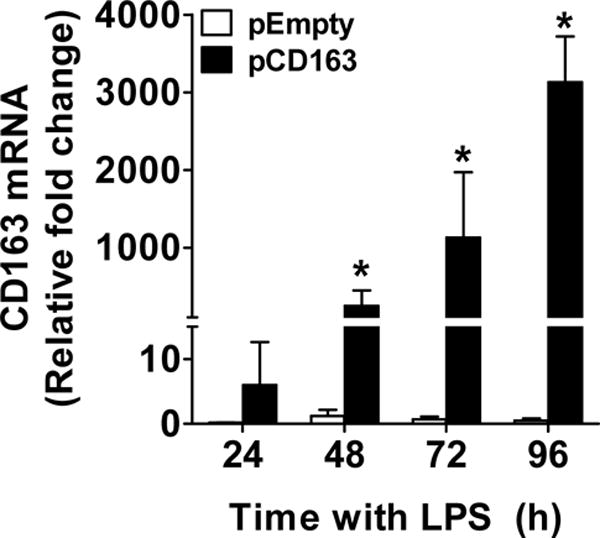
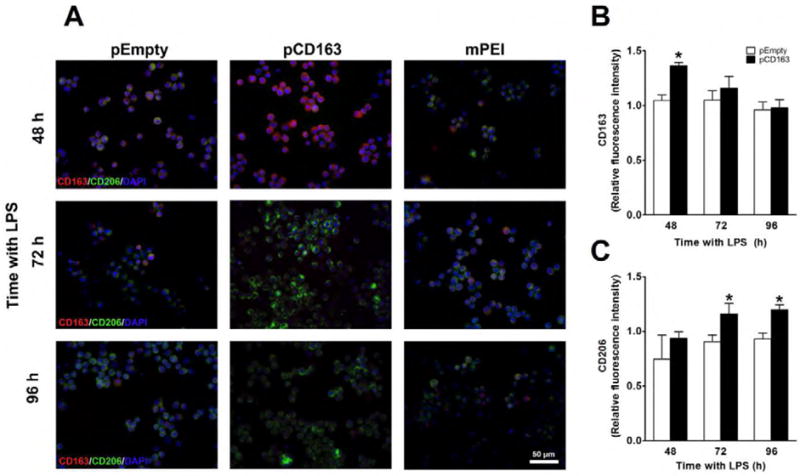
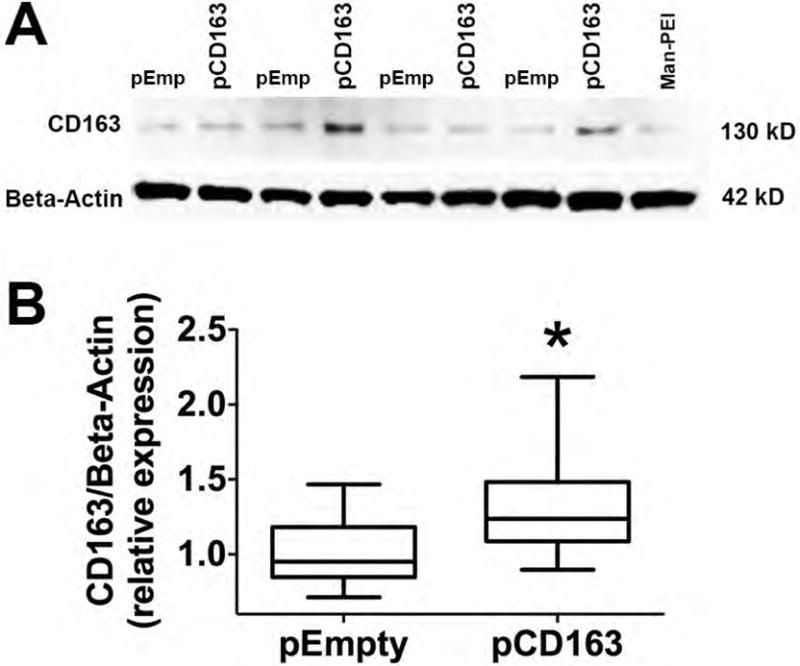
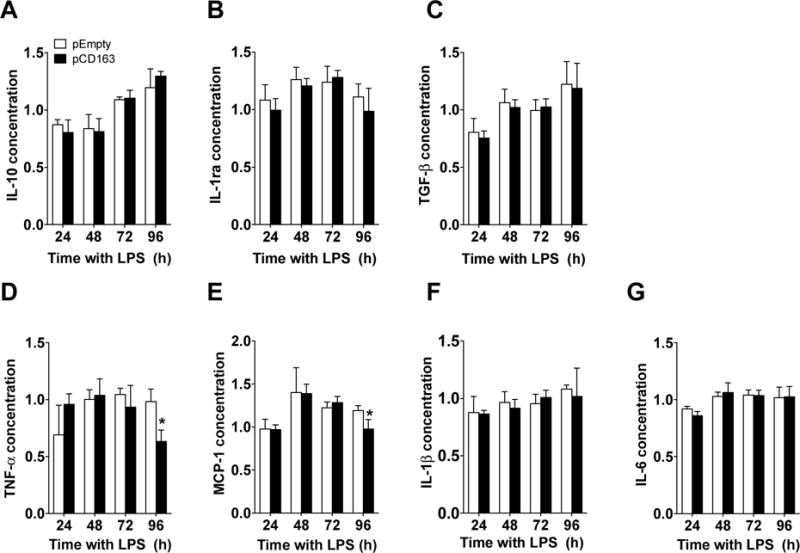
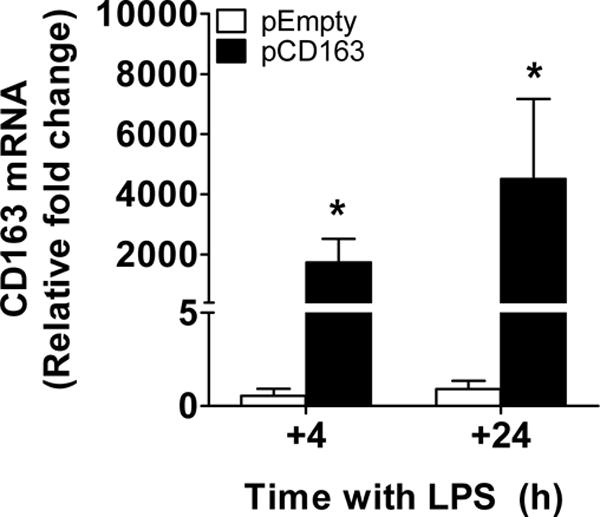
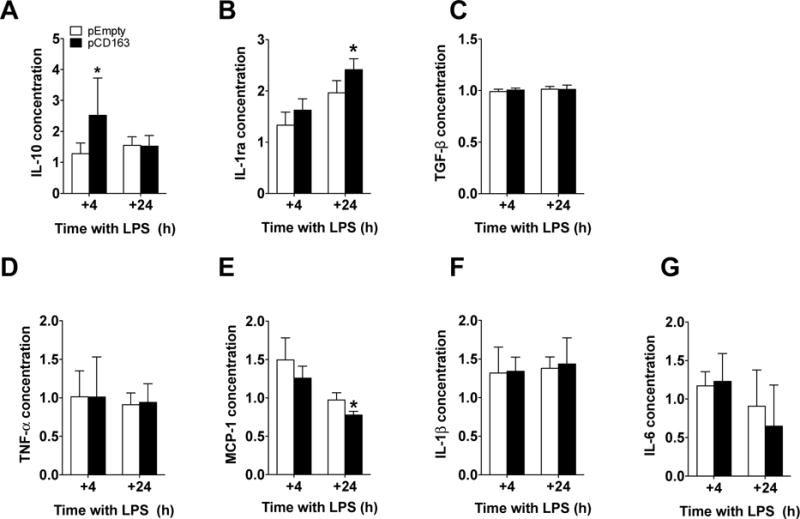
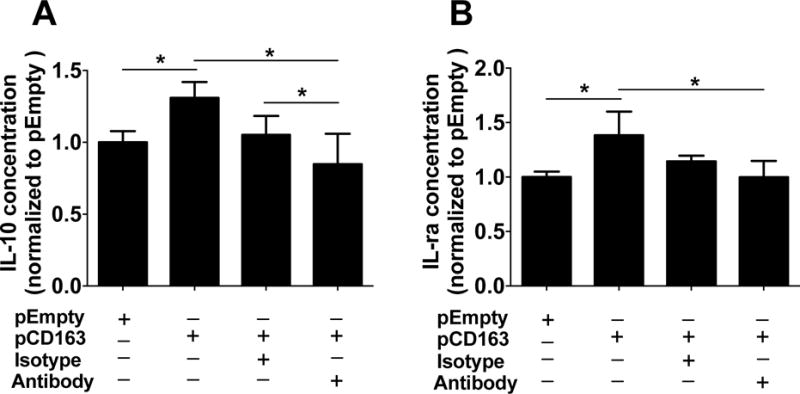
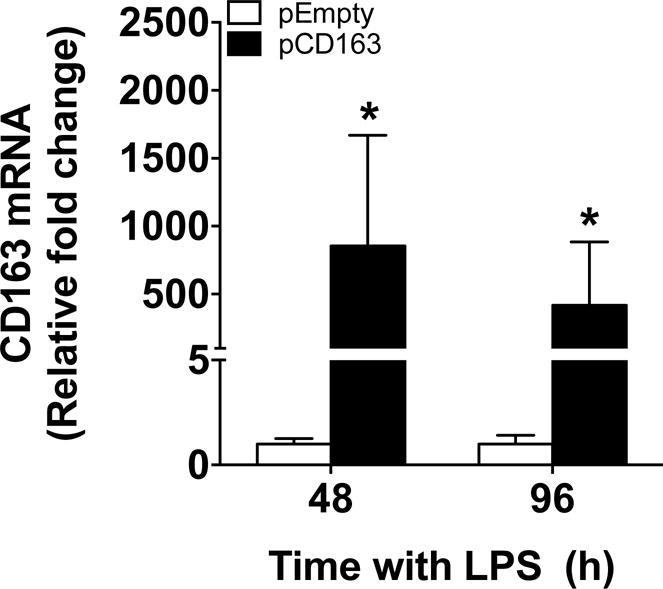
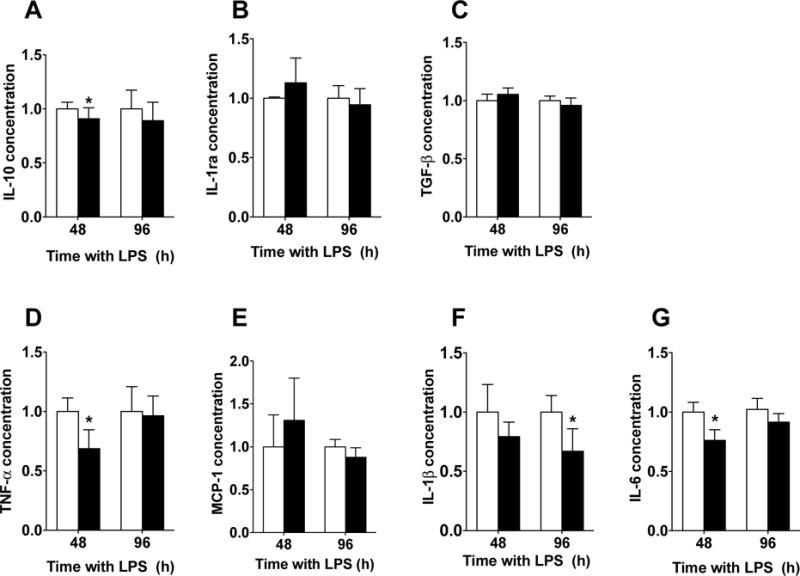
M1 macrophages release proinflammatory factors during inflammation. They transit to an M2 phenotype and release anti-inflammatory factors to resolve inflammation. An imbalance in the transition from M1 to M2 phenotype in macrophages contributes to the development of persistent inflammation. CD163, a member of the scavenger receptor cysteine-rich family, is an M2 macrophage marker. The functional role of CD163 during the resolution of inflammation is not completely known. We postulate that CD163 contributes to the transition from M1 to M2 phenotype in macrophages. We induced CD163 gene in THP-1 and primary human macrophages using polyethylenimine nanoparticles grafted with a mannose ligand (Man-PEI). This nanoparticle specifically targets cells of monocytic origin via mannose receptors. Cells were challenged with a single or a double stimulation of lipopolysaccharide (LPS). A CD163 or empty plasmid was complexed with Man-PEI nanoparticles for cell transfections. Quantitative RT-PCR, immunocytochemistry, and ELISAs were used for molecular assessments. CD163-overexpressing macrophages displayed reduced levels of tumor necrosis factor-alpha (TNF)-α and monocytes chemoattractant protein (MCP)-1 after a single stimulation with LPS. Following a double stimulation paradigm, CD163-overexpressing macrophages showed an increase of interleukin (IL)-10 and IL-1ra and a reduction of MCP-1. This anti-inflammatory phenotype was partially blocked by an anti-CD163 antibody (effects on IL-10 and IL-1ra). A decrease in the release of TNF-α, IL-1β, and IL-6 was observed in CD163-overexpressing human primary macrophages. The release of IL-6 was blocked by an anti-CD163 antibody in the CD163-overexpressing group. Our data show that the induction of the CD163 gene in human macrophages under inflammatory conditions produces changes in cytokine secretion in favor of an anti-inflammatory phenotype. Targeting macrophages to induce CD163 using cell-directed nanotechnology is an attractive and practical approach for inflammatory conditions that could lead to persistent pain, i.e. major surgeries, burns, rheumatoid arthritis, etc.

Keywords: CD163; Inflammation; Lipopolysaccharide; Primary human macrophages; THP-1; Transfection.


Conflict of interest statement

These authors contributed equally to this article

Conflicting interest

The authors declare no potential conflicts of interest.

Figures

Figure 1
Figure 1. Changes of cytokine concentration in THP-1 macrophages challenged with a single LPS stimulation and a CD163 antibody
Quantification for IL-10 (A), TGF-β (B), IL-1β (C), TNF-α (D), MCP-1 (E), and IL-6 (F) protein concentration in THP-1 macrophages with a single LPS stimulation and incubated with the anti-CD163 antibody (RM3/1) or its isotype control (Iso) for 24 hours (72 hours after the addition of LPS). N = 6–10 per group. *p<0.05, vs. LPS, #p<0.05, vs. isotype control by student’s t-test.
Figure 2
Figure 2. Changes of cytokine concentration in primary human macrophages challenged with a single LPS stimulation and a CD163 antibody
Quantification for IL-10 (A), TGF-β (B), IL-1β (C), TNF-α (D), MCP-1 (E), and IL-6 (F) protein concentration in primary human macrophages with a single LPS stimulation and incubated with the anti-CD163 antibody (RM3/1) or its isotype control (Iso) for 24 hours (72 hours after the addition of LPS). N = 6–10 per group. #p<0.05, vs. isotype control by student’s t-test.
Figure 3
Figure 3. CD163 mRNA induction in THP-1 macrophages challenged with a single LPS stimulation
Quantification for CD163 mRNA induction using Man-PEI complexed with either a plasmid encoding for CD163 gene (pCD163) or the empty vector (pEmpty) in LPS-stimulated THP-1 macrophages at 24, 48, 72 and 96 hours after transfection. The expression of CD163 mRNA was normalized to the respective levels of β-actin expression in each group, and then calculated as fold change against the expression of the control group (Man-PEI) at each time point. N = 5–6 per group. *p<0.05 vs. pEmpty by student’s t-test.
Figure 4
Figure 4. CD163 protein induction in THP-1 macrophages challenged with a single LPS stimulation
Microscopic images of nuclear staining using DAPI (blue), CD163 protein (red) and mannose receptor (CD206, green) in LPS-stimulated THP-1 macrophages transfected with Man-PEI complexed with an empty vector (pEmpty), a plasmid encoding for CD163 gene (pCD163) or the Man-PEI nanoparticle alone (A). Quantification of the relative average fluorescence intensity of CD163 (B) or mannose receptor (CD206, C) in LPS-stimulated THP-1 macrophages from 48 to 96 hours after transfection. The quantification of the relative average fluorescence intensity was normalized to the respective levels in the Man-PEI group, which was assigned a value equal to 1. N = 3 per group. *p< 0.05 vs. pEmpty by student’s t-test.
Figure 5
Figure 5. CD163 protein induction in THP-1 macrophages challenged with a single LPS stimulation
Representative Westernblot images of CD163 and Beta-Actin proteins in LPS-stimulated THP-1 macrophages transfected with Man-PEI complexed with an empty vector (pEmp or pEmpty), a plasmid encoding for CD163 gene (pCD163) or the Man-PEI nanoparticle alone (A). Quantification of the relative expression (band density) of CD163 in LPS-stimulated THP-1 macrophages from 48 hours after transfection (B). The quantification of the relative density was normalized to the respective levels in the pEmpty group, which was assigned a value equal to 1. N = 10 for pCD163 or pEmpty group. *p< 0.05 vs. pEmpty by student’s t-test.
Figure 6
Figure 6. Changes in cytokine expression in CD163-overexpressing THP-1 macrophages challenged with a single LPS stimulation
Quantification for IL-10 (A), IL-1ra (B), TGF-β (C), (C), TNF-α (D), MCP-1 (E), IL-1β (F) and IL-6 (G) protein concentration in THP-1 macrophages with a single LPS stimulation and transfected with either a plasmid encoding for CD163 gene (pCD163) or the empty vector (pEmpty) at 24, 48, 72 and 96 hours after transfection. The concentration of each cytokine/chemokine was normalized to the control group (Man-PEI), which was assigned a value equal to 1. N = 4–9 per group. *p<0.05, vs. pEmpty by student’s t-test.
Figure 7
Figure 7. CD163 mRNA induction in THP-1 macrophages challenged with a double LPS stimulation
Quantification for CD163 mRNA using Man-PEI complexed with either a plasmid encoding for CD163 gene (pCD163) or the empty vector (pEmpty) in THP-1 macrophages with a double LPS stimulation at 4 and 24 hours after the second stimulus (+4 and +24 respectively). The expression of CD163 mRNA was normalized to the respective levels of β-actin expression in each group, and then calculated as fold change against the expression of the control group (Man-PEI) at each time point, which was assigned a value equal to 1. N = 4–6 per group. *p<0.05 against the pEmpty transfected group by student’s t-test.
Figure 8
Figure 8. Changes of cytokine expression in CD163-overexpressing THP-1 macrophages challenged with a double LPS stimulation
Quantification for IL-10 (A), IL-1ra (B), TGF-β (C), TNF-α (D), MCP-1 (E), IL-1β (F) and IL-6 (G) protein concentration in THP-1 macrophages with a double LPS stimulation and transfected with either a plasmid encoding for CD163 gene (pCD163) or the empty vector (pEmpty) at 4 and 24 hours after the second stimulus (+4 and +24 respectively). The concentration of each molecule was normalized to the control group (Man-PEI), which was assigned a value equal to 1. N = 5–13 per group. *p<0.05, vs. pEmpty by student’s t-test.
Figure 9
Figure 9. Changes of cytokine expression in CD163-overexpressing THP-1 macrophages challenged with a double LPS stimulation and a CD163 antibody
Quantification for IL-10 (A) and IL-1ra (B) protein concentration in THP-1 macrophages transfected with either a plasmid encoding for CD163 gene (pCD163) or the empty vector (pEmpty) and incubated with either anti-CD163 antibody (RM3/1) or its isotype control antibody at 4 (for IL-10) and 24 (for IL-1ra) hours after a second LPS stimulus. The protein concentration of each group was normalized to the control group (pEmpty), which was assigned a value equal to 1. N= 5–12 per group. *p<0.05 using student’s t-test.
Figure 10
Figure 10. CD163 mRNA induction in primary human macrophages challenged with a single LPS stimulation
Quantification for CD163 mRNA induction using Man-PEI complexed with either a plasmid encoding for CD163 gene (pCD163) or the empty vector (pEmpty) in primary human macrophages with a single stimulation of LPS at 48 and 96 hours after transfection. The expression of CD163 mRNA was normalized to the respective levels of β-actin expression in each group, and then calculated as fold change against the expression of the pEmpty group at each time point, which was assigned a value equal to 1. N = 6–9 per group. *p<0.05 against the pEmpty group by student’s t-test.
Figure 11
Figure 11. Changes of cytokine expression in CD163-overexpressing primary human macrophages challenged with a single LPS stimulation
Quantification for IL-10 (A), IL-1ra (B), TGF-β (C), TNF-α (D), MCP-1 (E), IL-1β (F) and IL-6 (G) protein concentration in primary human macrophages with a single LPS stimulation and transfected with either a plasmid encoding for CD163 gene (pCD163) or the empty vector (pEmpty) at 48 and 96 hours after transfection. The concentration of each molecule was normalized to the control group (pEmpty), which was assigned a value equal to 1. N= 5–8 per group. *p<0.05 vs. pEmpty by student’s t-test.

Similar articles

Cited by

References

    1. Libby P. Inflammation and cardiovascular disease mechanisms. Am J Clin Nutr. 2006;83:456S. - PubMed
    1. Okin D, Medzhitov R. Evolution of inflammatory diseases. Curr Biol. 2012;22:R733. - PMC - PubMed
    1. Wong SH, Lord JM. Factors underlying chronic inflammation in rheumatoid arthritis. Arch Immunol Ther Exp (Warsz) 2004;52:379. - PubMed
    1. Serhan CN. The resolution of inflammation: the devil in the flask and in the details. FASEB J. 2011;25:1441. - PMC - PubMed
    1. Serhan CN, Brain SD, Buckley CD, Gilroy DW, Haslett C, O’Neill LA, Perretti M, Rossi AG, Wallace JL. Resolution of inflammation: state of the art, definitions and terms. FASEB J. 2007;21:325. - PMC - PubMed

MeSH terms