. 2017 Jul 1;10(7):897-907.
doi: 10.1242/dmm.029280. Epub 2017 May 25.

A tripeptidyl peptidase 1 is a binding partner of the Golgi pH regulator (GPHR) in Dictyostelium

Affiliations

A tripeptidyl peptidase 1 is a binding partner of the Golgi pH regulator (GPHR) in Dictyostelium

Maria Stumpf et al. Dis Model Mech. .

Abstract

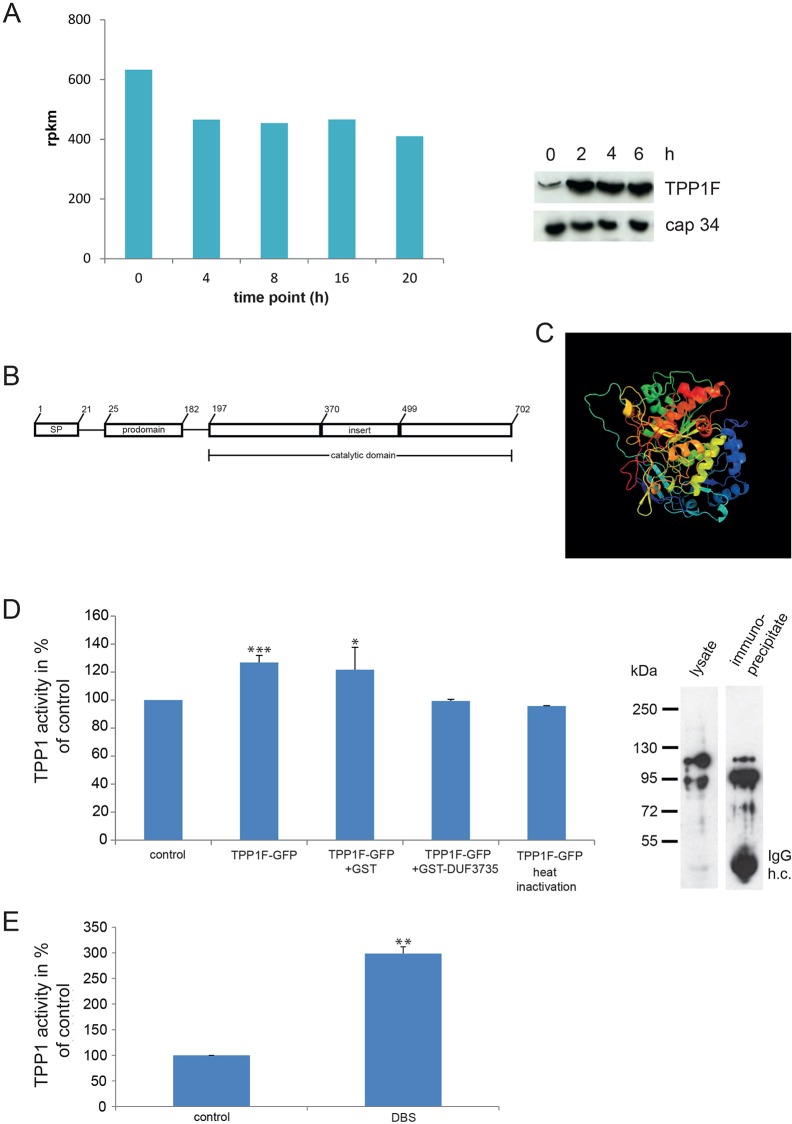
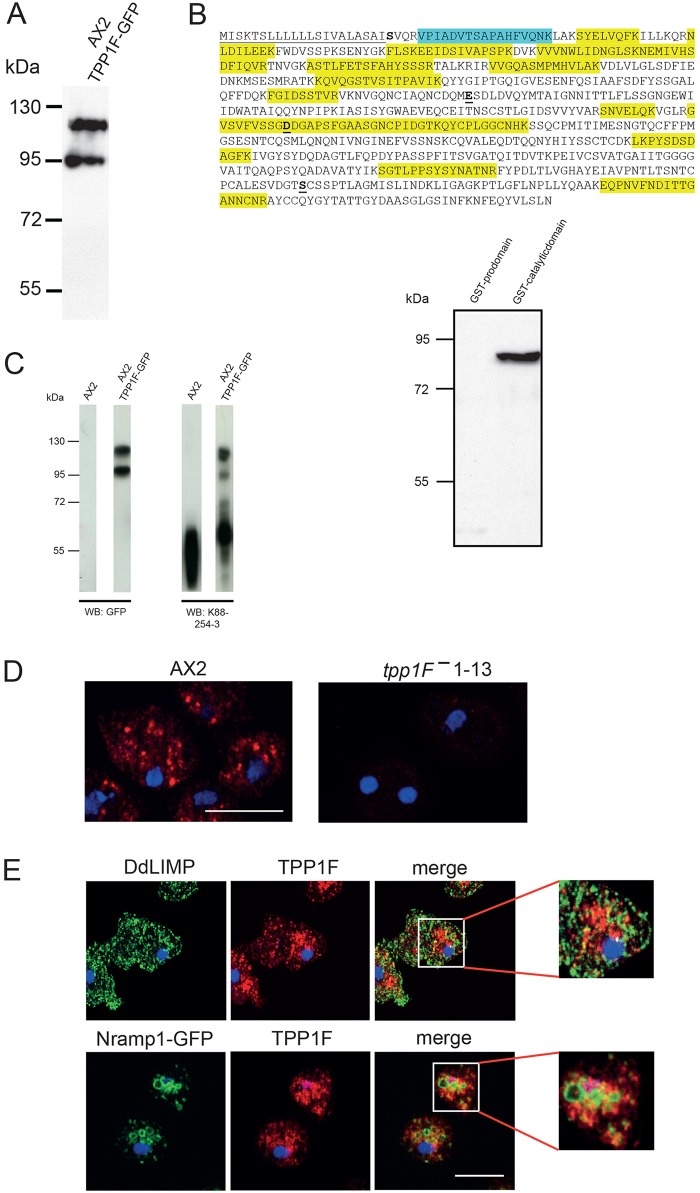
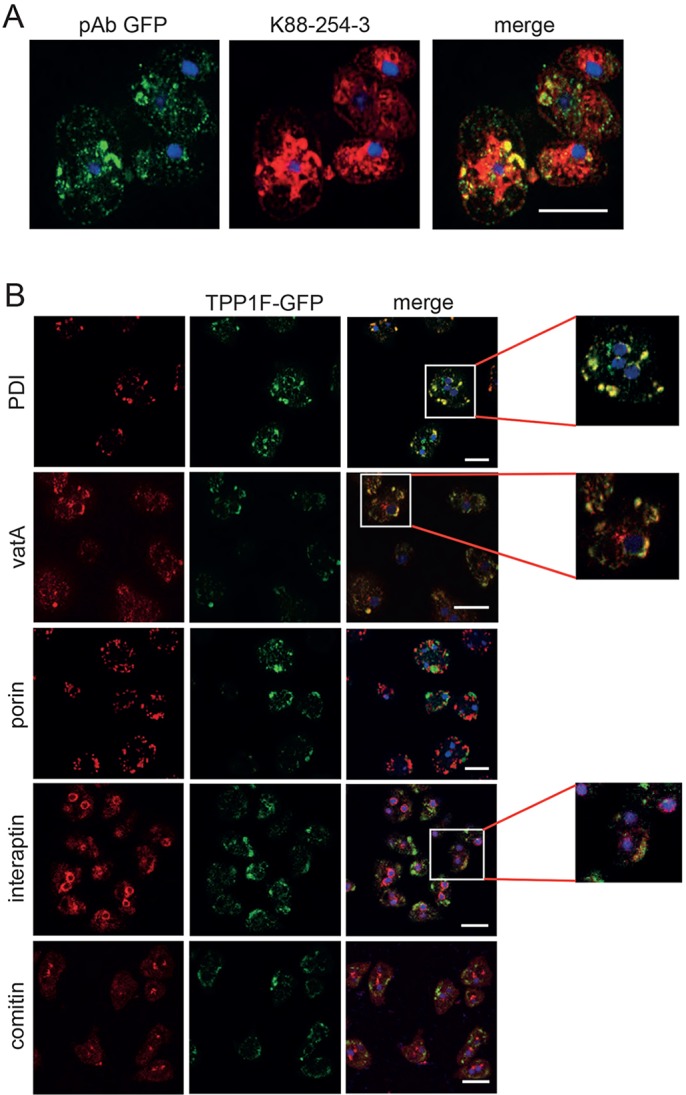
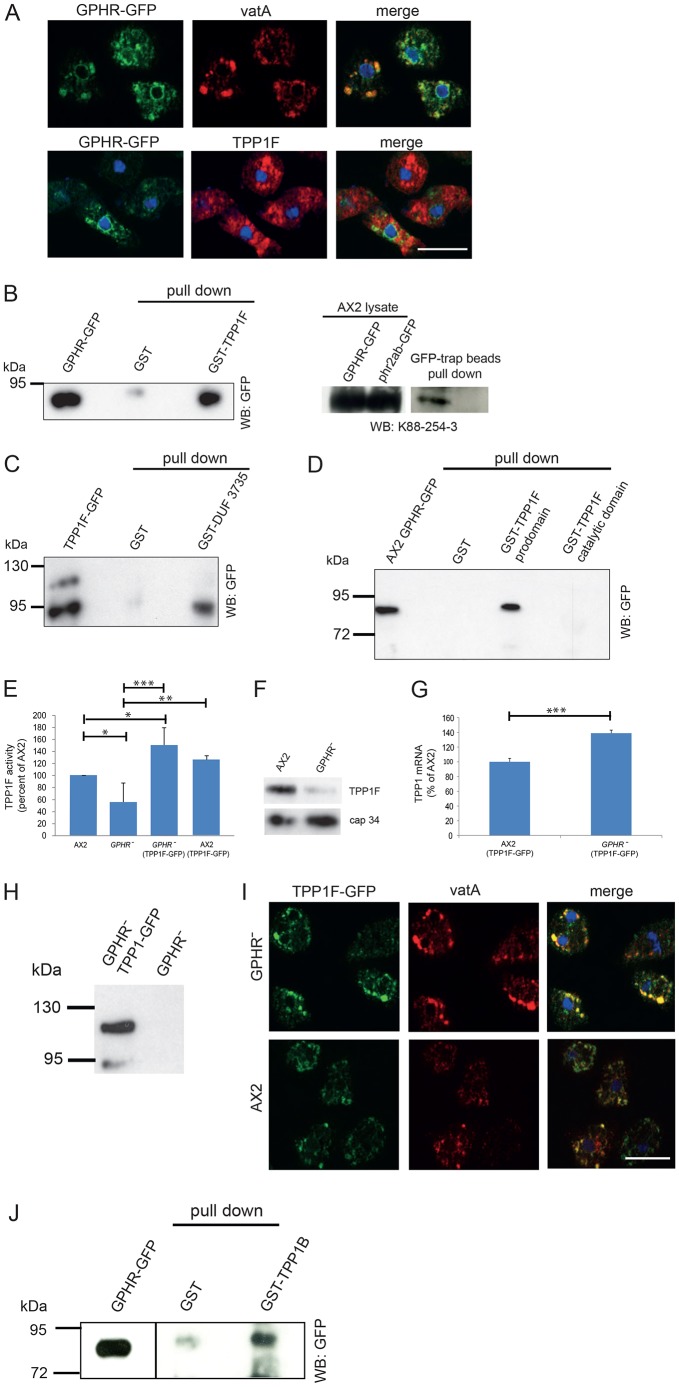
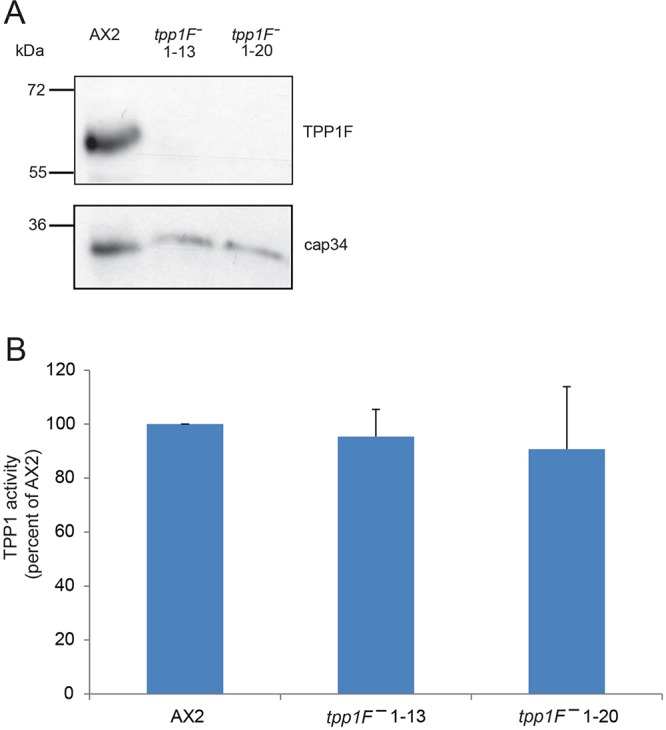
Mutations in tripeptidyl peptidase 1 (TPP1) have been associated with late infantile neuronal ceroid lipofuscinosis (NCL), a neurodegenerative disorder. TPP1 is a lysosomal serine protease, which removes tripeptides from the N-terminus of proteins and is composed of an N-terminal prodomain and a catalytic domain. It is conserved in mammals, amphibians, fish and the amoeba Dictyostelium discoideum. D. discoideum harbors at least six genes encoding TPP1, tpp1A to tpp1F We identified TPP1F as binding partner of Dictyostelium GPHR (Golgi pH regulator), which is an evolutionarily highly conserved intracellular transmembrane protein. A region encompassing the DUF3735 (GPHR_N) domain of GPHR was responsible for the interaction. In TPP1F, the binding site is located in the prodomain of the protein. The tpp1F gene is transcribed throughout development and translated into a polypeptide of ∼65 kDa. TPP1 activity was demonstrated for TPP1F-GFP immunoprecipitated from D. discoideum cells. Its activity could be inhibited by addition of the recombinant DUF3735 domain of GPHR. Knockout tpp1F mutants did not display any particular phenotype, and TPP1 activity was not abrogated, presumably because tpp1B compensates as it has the highest expression level of all the TPP1 genes during growth. The GPHR interaction was not restricted to TPP1F but occurred also with TPP1B. As previous reports show that the majority of the TPP1 mutations in NCL resulted in reduction or loss of enzyme activity, we suggest that Dicyostelium could be used as a model system in which to test new reagents that could affect the activity of the protein and ameliorate the disease.

Keywords: Endosomes; Golgi pH regulator (GPHR); Lysosomes; Neuronal ceroid lipofuscinosis (NCL); Tripeptidyl peptidase 1 (TPP1).


Conflict of interest statement

Competing interestsThe authors declare no competing or financial interests.

Figures

Fig. 1.
Fig. 1.
Characterization of TPPF1. (A) tpp1F transcript accumulation during development (left). The data were obtained from RNA-seq experiments as described in the Materials and Methods. 0 h time point corresponds to the growth phase, 4 and 8 h correspond to aggregation stages, 16 h corresponds to the slug stage and 20 h to the culmination phase. Rpkm, reads per kb per million mapped reads. Right panel, TPP1F protein level during early development. AX2 cells were starved in suspension for the indicated time points and whole-cell lysates prepared. 4×10⁵ cell equivalents were loaded per lane. The blot was probed with mAb K88-7-2 for TPP1F (65 kDa) and mAb 135-409 recognizing cap34 (34 kDa) as a loading control. (B) Domain structure of TPP1F as predicted with the NCBI conserved domain database (CDD) (Marchler-Bauer et al., 2015). SP, signal peptide. (C) Three-dimensional structure of TPP1F as calculated by the Phyre2 program (Kelley et al., 2015). (D) Tripeptidyl peptidase activity of TPP1F. TPP1F-GFP was immunoprecipitated from AX2 transformants and the precipitate used for the assay. The impact of GST-DUF3735 and GST for control on the activity was also tested as well as heat treatment. The fluorescence reading of the control (buffer and substrate) was set to 100%. The values represent the mean±s.d. of three to five experiments. *P≤0.05, ***P≤0.001, in comparison to control. Right panel shows western blot of the protein precipitated with polyclonal antibodies and used in the assay. The blot was probed with mAb K3-184-2. The band at ∼55 kDa corresponds to the heavy chain (h.c.) of the anti-GFP pAb. (E) TPP1 activity in mouse blood (dried blood spot, DBS). The control represents the fluorescence value of a filter paper in buffer containing the reagent and was set to 100%. The values are the mean of two experiments. P≤0.01.
Fig. 2.
Fig. 2.
Characterization of TPP1F-GFP and TPP1F-specific antibodies. (A) TPP1F-GFP expression in AX2. Proteins from whole-cell lysate (corresponding to 4×10⁵ cell equivalents) were separated by SDS-PAGE (10%) and probed with mAb K3-184-2. (B) Amino acid sequence of TPP1F. Underlined is the N-terminal signal sequence, in bold and underlined are the catalytic residues E272, D369 and S611. Highlighted in yellow are the peptides that were identified by mass spectrometry analysis in the two polypeptides immunoprecipitated by mAb K3-184-2. The peptide in turquoise was present only in the higher molecular mass band. (C) Left panel shows whole-cell lysates from AX2 and AX2 expressing TPP1F-GFP probed with GFP-specific mAb K3-184-2 and TPP1F-specific mAb K88-254-3. Right panel, mAb K88-254-3 specifically recognizes the catalytic domain but not the prodomain expressed as GST-fusion proteins. (D) Immunofluorescence analysis of AX2 and TPP1F-deficient cells (clone 1-13). mAb K88-254-3 was used for labeling. DAPI staining of nuclei is shown in blue. Cy3-labeled secondary antibodies were used for detection. (E) Localization of TPP1F, DdLIMP and Nramp1. AX2 cells stained with mAb K88-254-3 for TPP1F and polyclonal DdLimp-specific antibodies. AX2 cells expressing Nramp1-GFP are labeled with K88-254-3. Nuclei are stained with DAPI. Scale bars: 10 µm.
Fig. 3.
Fig. 3.
Subcellular localization of TPP1F. (A) Detection of TPP1F-GFP by mAb K88-254-3. TPP1F-GFP was detected with pAb GFP. Cells were fixed with methanol. (B) Distribution of TPP1F-GFP in AX2 compared with various marker proteins. Detection of TPP1-GFP was with polyclonal GFP-specific antibodies. Co-staining was with monoclonal antibodies detecting PDI (ER marker), vatA (endo-lysosomal membranes and membranes of the contractile vacuole), porin (mitochondria), interaptin (nuclear envelope and ER) and comitin (Golgi), as indicated. Nuclei are stained with DAPI (merge, in blue). Scale bars: 10 µm.
Fig. 4.
Fig. 4.
Interaction of GPHR and TPP1F. (A) Immunofluorescence analysis of AX2 cells expressing GPHR-GFP. Methanol-fixed cells stained with vatA-specific antibodies (top panel) and TPP1F-specific mAb K88.254-3 (bottom panel). Nuclei are labeled with DAPI (merge, in blue). Scale bar: 10 µm. (B) GPHR-GFP is precipitated by GST-TPP1F (left). GPHR-GFP, whole-cell lysate of GPHR cells expressing GPHR-GFP (4×10⁵ cells). Pull down was carried out with GST and GST-TPP1F carrying glutathione-Sepharose beads as indicated (pull down). The blot was probed with mAb K3-184-2 (WB: GFP). Right panel shows endogenous TPP1F precipitated by GPHR-GFP. AX2 cell lysates expressing GPHR-GFP were used for the pull down with GFP-trap beads. TPP1F was detected with mAb K88-254-3. AX2 cells expressing phr2ab-GFP, phosphatase 2A regulatory B subunit, with similar apparent molecular size as GPHR, were used as a control. (C) GST-DUF3735 interacts with TPP1F-GFP. TPP1F-GFP, whole-cell lysate. The pull down was carried out with GST and GST-DUF3735 (pull down). The blot was probed with mAb K3-184-2 (WB: GFP). (D) Identification of the GPHR binding domain in TPP1F. GST, GST-prodomain and GST-catalytic domain of TPP1F bound to glutathione-Sepharose beads were used to pull down GPHR-GFP. The blot was probed with mAb K3-184-2. (E) TPP1 activity in lysates obtained from various strains as indicated. Lysates were prepared from equal numbers of cells and equal volumes were used in the assay. TPP1 activity is given as activity as a percentage of AX2 value (set to 100%). Mean±s.d. values from 4 experiments are shown (*P<0.05; **P<0.01; ***P<0.001). (F) TPP1F levels in AX2 and GPHR. Whole-cell lysates (4×10⁵ cells) were separated by SDS-PAGE (10% acrylamide). The blot was probed with mAb K88-254-3. cap34 detected by mAb 135-409 was used to assess loading. (G) TPP1F-specific transcript amounts in AX2 expressing TPP1F-GFP and GPHR expressing TPP1F-GFP as quantified by qRT-PCR. Normalization was done using GAPDH. The value obtained for AX2 was set to 100%. The data represent mean±s.d. values from three experiments (***P<0.001). (H) Expression of TPP1F-GFP in GPHR. Whole-cell lysates of GPHR expressing TPP1F-GFP and GPHR probed with mAb K3-184-2. (I) Comparison of TPP1F-GFP and vatA distribution in GPHR and AX2. TPP1F-GFP was detected with polyclonal antibodies specific for GFP, vatA with mAb 221-35-2. Nuclei are stained with DAPI (merge, in blue). Scale bar: 10 µm. (J) Interaction of GST-TPP1B with GPHR-GFP. GST and GST-TPP1B bound to glutathione-Sepharose beads were used for the pull down from AX2 cells expressing GPHR-GFP. The precipitate was probed with mAb K3-184-2. The images are derived from a single blot; however, a shorter exposure is shown for GPHR-GFP.
Fig. 5.
Fig. 5.
Characterization of TPP1F-deficient cells. (A) Mutant 1-13 and 1-20 do not express the ∼65 kDa protein as revealed by analysis of whole-cell lysates (5×10⁵ cell equivalents per lane) with mAb K88-254-3 (TPP1F). Loading was assessed using cap34-specific mAb 135-409. (B) TPP1 activity is not impaired in growing mutant cells. Lysates from equal numbers of cells were used in the TPP1 assay. The data are the mean±s.d. from four independent experiments. The results from AX2 were set to 100%. The differences were not statistically significant.

References

    1. Bakthavatsalam D. and Gomer R. H. (2010). The secreted proteome profile of developing Dictyostelium discoideum cells. Proteomics 10, 2556-2559. 10.1002/pmic.200900516 - DOI - PMC - PubMed
    1. Cárcel-Trullols J., Kovács A. D. and Pearce D. A. (2015). Cell biology of the NCL proteins: what they do and don't do. Biochim. Biophys. Acta 1852, 2242-2255. 10.1016/j.bbadis.2015.04.027 - DOI - PubMed
    1. Charroux B. and Royet J. (2014). Mutations in the Drosophila ortholog of the vertebrate Golgi pH regulator (GPHR) protein disturb endoplasmic reticulum and Golgi organization and affect systemic growth. Biol. Open 3, 72-80. 10.1242/bio.20137187 - DOI - PMC - PubMed
    1. Comellas-Bigler M., Fuentes-Prior P., Maskos K., Huber R., Oyama H., Uchida K., Dunn B. M., Oda K. and Bode W. (2002). The 1.4 Å crystal structure of kumamolysin: a thermostable serine-carboxyl-type proteinase. Structure 10, 865-676 10.1016/S0969-2126(02)00772-4 - DOI - PubMed
    1. de Sousa Abreu R., Penalva L. O., Marcotte E. M. and Vogel C. (2009). Global signatures of protein and mRNA expression levels. Mol. Biosyst. 5, 1512-1526. 10.1039/b908315d - DOI - PMC - PubMed

MeSH terms

LinkOut - more resources