. 2017 Aug;66(8):2150-2162.
doi: 10.2337/db16-1349. Epub 2017 May 25.

Overexpression of Kinase-Dead mTOR Impairs Glucose Homeostasis by Regulating Insulin Secretion and Not β-Cell Mass

Affiliations

Overexpression of Kinase-Dead mTOR Impairs Glucose Homeostasis by Regulating Insulin Secretion and Not β-Cell Mass

Emilyn U Alejandro et al. Diabetes. 2017 Aug.

Abstract

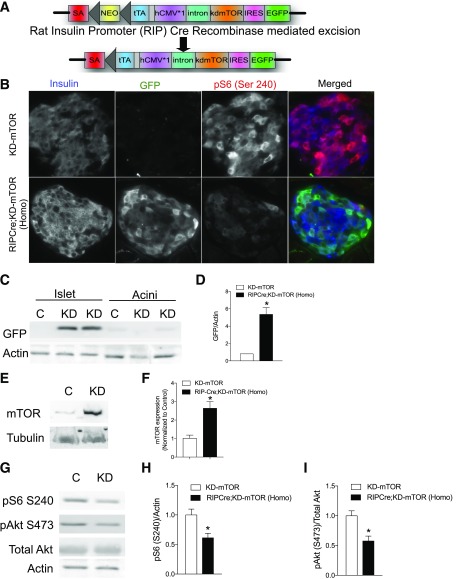
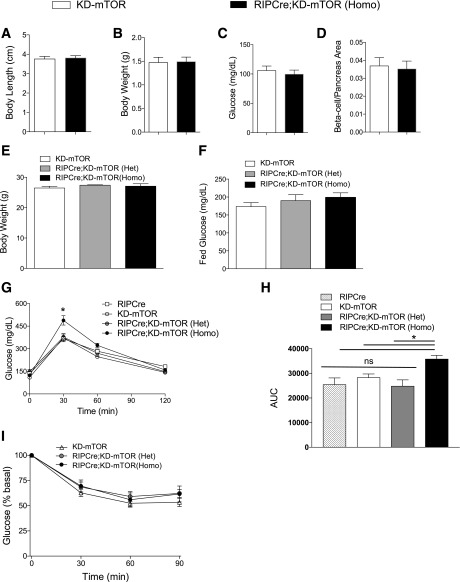
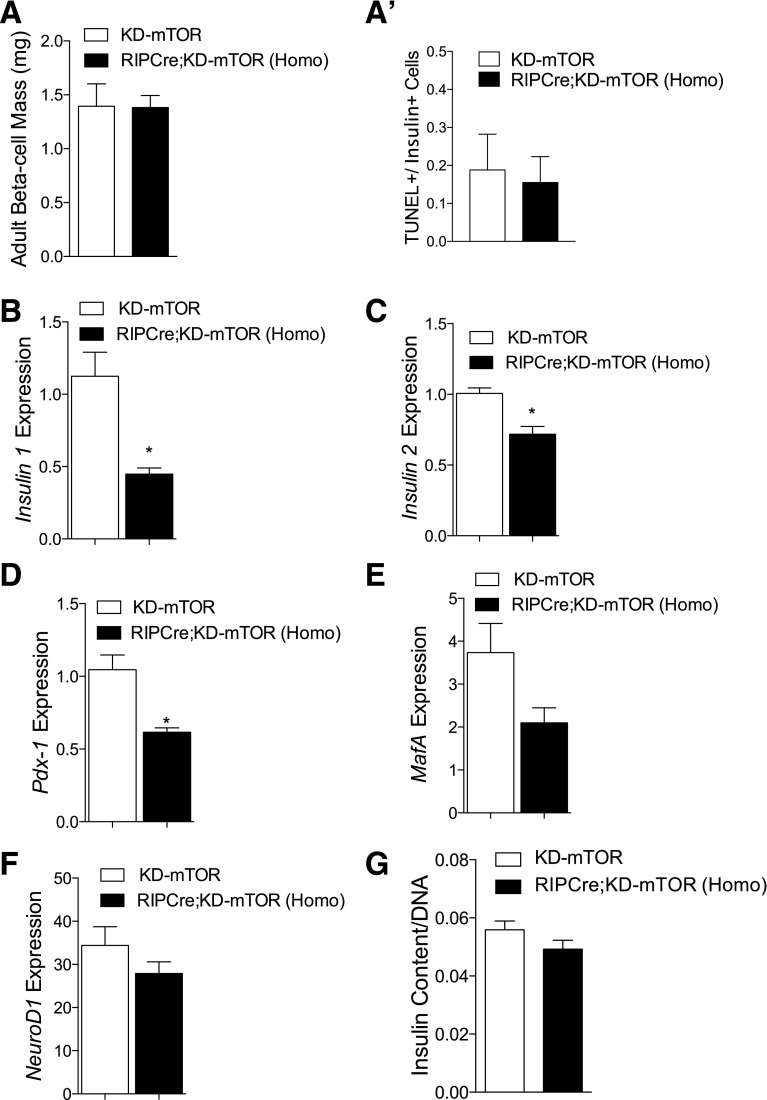
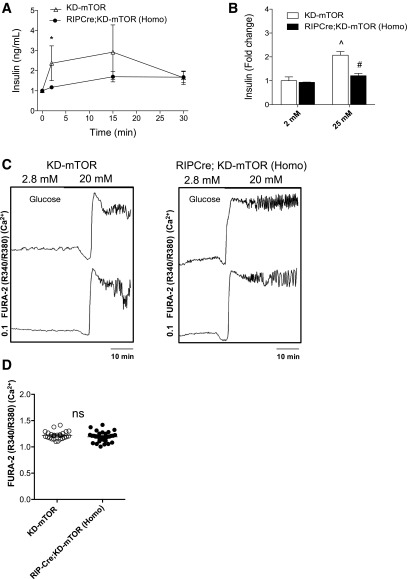
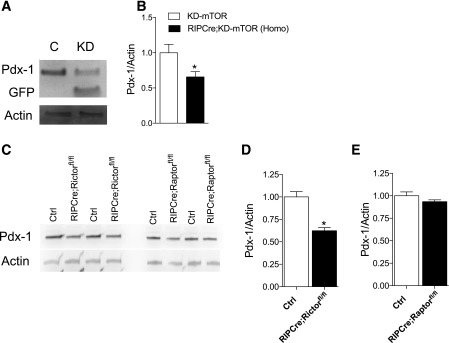
Regulation of glucose homeostasis by insulin depends on β-cell growth and function. Nutrients and growth factor stimuli converge on the conserved protein kinase mechanistic target of rapamycin (mTOR), existing in two complexes, mTORC1 and mTORC2. To understand the functional relevance of mTOR enzymatic activity in β-cell development and glucose homeostasis, we generated mice overexpressing either one or two copies of a kinase-dead mTOR mutant (KD-mTOR) transgene exclusively in β-cells. We examined glucose homeostasis and β-cell function of these mice fed a control chow or high-fat diet. Mice with two copies of the transgene [RIPCre;KD-mTOR (Homozygous)] develop glucose intolerance due to a defect in β-cell function without alterations in β-cell mass with control chow. Islets from RIPCre;KD-mTOR (Homozygous) mice showed reduced mTORC1 and mTORC2 signaling along with transcripts and protein levels of Pdx-1. Islets with reduced mTORC2 signaling in their β-cells (RIPCre;Rictorfl/fl) also showed reduced Pdx-1. When challenged with a high-fat diet, mice carrying one copy of KD-mTOR mutant transgene developed glucose intolerance and β-cell insulin secretion defect but showed no changes in β-cell mass. These findings suggest that the mTOR-mediated signaling pathway is not essential to β-cell growth but is involved in regulating β-cell function in normal and diabetogenic conditions.


Figures

Figure 1
Figure 1
Expression of KD-mTOR mutant in β-cells reduces S6 phosphorylation. A: Transgene construct of the KD-mTOR and generation of β-cell–specific RIPCre;KD-mTOR mice. IRES, internal ribosome entry site; NEO, neomycin cassette; SA, splice-acceptor sequence. B: Recombination efficiency was assessed by EGFP expression in islets of RIPCre;KD-mTOR (Homo) mice. Adult pancreas was stained for insulin (blue), phosphorylated S6 (S240) (red), and GFP (green). Images shown are 40× magnification. C and D: Increased expression of GFP (transgene reporter) by Western blotting (C) in islets and acini from 3-month-old male RIPCre;KD-mTOR (Homo) (KD) and control (C) mice. Quantification of GFP to Actin is shown in D, n = 3. E and F: Immunoblotting and quantification for mTOR levels in adult islets from RIPCre;KD-mTOR (Homo) and control mice. GI: Reduced phosphorylated S6 (S240) (G and H) and phosphorylated Akt (S473) (G and I) in adult islets from RIPCre;KD-mTOR (Homo) compared with control mice. Quantification is shown for phosphorylated S6 (S240) (H) and phosphorylated Akt (S473) (I). *P < 0.05 between RIPCre;KD-mTOR and control mice unless otherwise indicated. Statistical analyses were conducted using unpaired, nonparametric Mann-Whitney U test.
Figure 2
Figure 2
RIPCre;KD-mTOR mice exhibit normal islet architecture and β-cell mass in neonates and glucose intolerance later in life. AC: Body length, body weight, and glucose levels in newborn RIPCre;KD-mTOR (Homo) and control mice. D: β-Cell area (insulin positive)/pancreas area ratio between RIPCre;KD-mTOR (Homo) and littermate control mice. E and F: Normal body weight (E) and random blood glucose (F) levels in RIPCre;KD-mTOR (Het), RIPCre;KD-mTOR (Homo), and control mice. G: Twelve-week-old male RIPCre;KD-mTOR (Homo) mice showed impaired glucose tolerance via IP compared with RIPCre;KD-mTOR (Het) and littermate control mice fed a normal chow diet. H: Area under the curve (AUC) for G. I: Normal insulin sensitivity between all genotypes fed a normal chow diet. n = 4–10. Statistical analyses were conducted using two-way ANOVA in E, F, G, and I, showing only significant interaction and genotype differences between control and RIPCre;KD-mTOR (Homo) in G. Mann-Whitney U tests were done in AD and H by prism. *P < 0.05 between RIPCre;KD-mTOR and control mice, unless otherwise indicated.
Figure 3
Figure 3
RIPCre;KD-mTOR mice have normal islet architecture, β-cell mass, and insulin content. A: Comparable β-cell mass between male RIPCre;KD-mTOR (Homo) and control mice. A’: RIPCre;KD-mTOR (Homo) and control islets showed normal levels of TUNEL+/insulin+ (apoptotic) cells. BD: Significant reduction of insulin 1, insulin 2, and Pdx-1 mRNA transcripts. E and F: No significant changes were detected in MafA and NeuroD1 transcripts. G: Despite alterations in insulin and Pdx-1 mRNA levels, insulin content in islets of RIPCre;KD-mTOR (Homo) mice showed no significant difference compared with littermate control mice. Statistical analyses were conducted using unpaired, nonparametric Mann-Whitney U test. *P < 0.05 between RIPCre;KD-mTOR (Homo) and control mice, n = 4.
Figure 4
Figure 4
RIPCre;KD-mTOR mice show impaired insulin secretion as a result of defects distal to calcium influx. A: RIPCre;KD-mTOR (Homo) mice showed blunted insulin secretion compared with littermate control mice in response to high glucose in vivo. B: Islets from RIPCre;KD-mTOR (Homo) mice also demonstrated blunted insulin secretion in response to high glucose compared with littermate control mice in vitro. C: Example of intracellular Ca2+ traces in islets preloaded with Fura2-AM from 12-week-old RIPCre;KD-mTOR (Homo) mice in response to 20 mmol/L glucose. D: Quantification of Ca2+ traces, reported as the emission ratio R340/R380, in response to 20 mmol/L glucose, n = 20 islets. Statistical analyses were conducted using unpaired, nonparametric Mann-Whitney U test. *P < 0.05 between RIPCre;KD-mTOR (Homo) and control mice. ^P < 0.05 between low and high glucose response. #P < 0.05 between RIPCre;KD-mTOR and control mice in high-glucose conditions. n = 5 for in vivo GSIS and n = 3 for animals in both in vitro GSIS and Ca2+ studies (∼18 islets per n were used).
Figure 5
Figure 5
Islets from RIPCre;KD-mTOR mice have reduced Pdx-1 protein levels. A and B: Pdx-1 protein levels in islets from 4-month-old RIPCre;KD-mTOR (KD) compared with control (C) mice; quantification in B. C: Representative Western blots of Pdx-1 in islets from 3-month-old RIPCre;Rictorfl/fl and 1-month-old RIPCre;Raptorfl/fl mice compared with control (Ctrl) mice; quantification in D and E, respectively. Statistical analyses were conducted using unpaired, nonparametric Mann-Whitney U test. *P < 0.05, n = 3–6.
Figure 6
Figure 6
Abnormal adaptation of RIPCre;KD-mTOR mice to HFD. A and B: Random and fasting blood glucose during HFD. C: No differences in body weight were observed between genotypes. Both RIPCre;KD-mTOR (Het) and RIPCre;KD-mTOR (Homo) mice developed impaired glucose tolerance (D and E), insulin resistance (F), and blunted GSIS (G) in response to HFD in vivo. H: No alteration in β-cell mass in response to 16 weeks of HFD in vivo was observed between genotypes. Statistical analyses were conducted using two-way ANOVA for D, E, and F, and show significant genotype interaction in D. Individual time points were assessed by statistical analyses using unpaired, nonparametric Mann-Whitney U test. *P < 0.05 between RIPCre;KD-mTOR (Homo) and control mice; ^P < 0.05 between RIPCre;KD-mTOR (Het) and control mice; n = 6.

References

    1. Blandino-Rosano M, Chen AY, Scheys JO, et al. mTORC1 signaling and regulation of pancreatic β-cell mass. Cell Cycle 2012;11:1892–1902 - PMC - PubMed
    1. Rachdi L, Balcazar N, Osorio-Duque F, et al. Disruption of Tsc2 in pancreaticbeta cells induces beta cell mass expansion and improved glucose tolerance in a TORC1-dependent manner. Proc Natl Acad Sci U S A 2008;105:9250–9255 - PMC - PubMed
    1. Elghazi L, Balcazar N, Blandino-Rosano M, et al. Decreased IRS signaling impairs beta-cell cycle progression and survival in transgenic mice overexpressing S6K in beta-cells. Diabetes 2010;59:2390–2399 - PMC - PubMed
    1. Gu Y, Lindner J, Kumar A, Yuan W, Magnuson MA. Rictor/mTORC2 is essential for maintaining a balance between beta-cell proliferation and cell size. Diabetes 2011;60:827–837 - PMC - PubMed
    1. Sarbassov DD, Guertin DA, Ali SM, Sabatini DM. Phosphorylation and regulation of Akt/PKB by the Rictor-mTOR complex. Science 2005;307:1098–1101 - PubMed

MeSH terms