Effect of Necrosis on the miRNA-mRNA Regulatory Network in CRT-MG Human Astroglioma Cells
- PMID: 28546527
- PMCID: PMC5912152
- DOI: 10.4143/crt.2016.551
Effect of Necrosis on the miRNA-mRNA Regulatory Network in CRT-MG Human Astroglioma Cells
Abstract
Purpose: Glioblastoma multiforme (GBM) is the most common adult primary intracranial tumor. The remarkable features of GBM include central necrosis. MicroRNAs (miRNAs) have been considered as diagnostic/prognostic biomarkers for many cancers, including glioblastoma. However, the effect of necrosis on the miRNA expression profile and predicted miRNA-mRNA regulatory information remain unclear. The purpose of this study is to examine the effect of necrotic cells on the modulation of miRNA and mRNA expression profiles and miRNA-mRNA network in CRT-MG cells.
Materials and methods: We used human astroglioma cells, CRT-MG, treated with necrotic CRT-MG cells to examine the effect of necrosis on the modulation of miRNA and mRNA by next-generation sequencing. For preparation of necrotic cells, CRT-MGcellswere frozen and thawed through cycle of liquid nitrogen-water bath. The putative miRNA-mRNA regulatory relationshipwas inferred through target information, using miRDB.
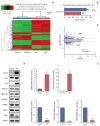
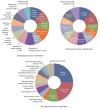
Results: The necrotic cells induced dysregulation of 106 miRNAs and 887 mRNAs. Among them, 11 miRNAs that had a negative correlation value of p < 0.05 by the hypergeometric test were screened, and their target mRNAs were analyzed by Gene Ontology enrichment analysis. Using the Kyoto Encyclopedia of Genes and Genomes database, we also found several necrotic cell treatment-activated pathways that were modulated by relevant gene targets of differentially expressed miRNAs.
Conclusion: Our result demonstrated that dysregulation of miRNA and mRNA expression profiles occurs when GBM cells are exposed to necrotic cells, suggesting that several miRNAs may have the potential to be used as biomarkers for predicting GBM progression and pathogenesis.
Keywords: Glioblastoma; MicroRNA; Necrosis.
Conflict of interest statement
Conflict of interest relevant to this article was not reported.
Figures


Similar articles
-
MCP-1 and MIP-3α Secreted from Necrotic Cell-Treated Glioblastoma Cells Promote Migration/Infiltration of Microglia.Cell Physiol Biochem. 2018;48(3):1332-1346. doi: 10.1159/000492092. Epub 2018 Jul 26. Cell Physiol Biochem. 2018. PMID: 30048972
-
Simultaneous miRNA and mRNA transcriptome profiling of glioblastoma samples reveals a novel set of OncomiR candidates and their target genes.Brain Res. 2018 Dec 1;1700:199-210. doi: 10.1016/j.brainres.2018.08.035. Epub 2018 Aug 31. Brain Res. 2018. PMID: 30176243
-
MicroRNAs in glioblastoma pathogenesis and therapy: A comprehensive review.Crit Rev Oncol Hematol. 2017 Dec;120:22-33. doi: 10.1016/j.critrevonc.2017.10.003. Epub 2017 Oct 7. Crit Rev Oncol Hematol. 2017. PMID: 29198335 Review.
-
Identification and functional characterization of lncRNAs acting as ceRNA involved in the malignant progression of glioblastoma multiforme.Oncol Rep. 2016 Nov;36(5):2911-2925. doi: 10.3892/or.2016.5070. Epub 2016 Sep 5. Oncol Rep. 2016. PMID: 27600337
-
Targeting strategies on miRNA-21 and PDCD4 for glioblastoma.Arch Biochem Biophys. 2015 Aug 15;580:64-74. doi: 10.1016/j.abb.2015.07.001. Epub 2015 Jul 2. Arch Biochem Biophys. 2015. PMID: 26142886 Review.
Cited by
-
Potential role of microRNAs as biomarkers in human glioblastoma: a mini systematic review from 2015 to 2020.Mol Biol Rep. 2021 May;48(5):4647-4658. doi: 10.1007/s11033-021-06423-9. Epub 2021 May 25. Mol Biol Rep. 2021. PMID: 34032976
-
The miRNA Content of Exosomes Released from the Glioma Microenvironment Can Affect Malignant Progression.Biomedicines. 2020 Dec 3;8(12):564. doi: 10.3390/biomedicines8120564. Biomedicines. 2020. PMID: 33287106 Free PMC article.
-
MiR-4492, a New Potential MicroRNA for Cancer Diagnosis and Treatment: A Mini Review.Chonnam Med J. 2024 Jan;60(1):21-26. doi: 10.4068/cmj.2024.60.1.21. Epub 2024 Jan 25. Chonnam Med J. 2024. PMID: 38304137 Free PMC article. Review.
-
Integrated Analysis of MicroRNA (miRNA) and mRNA Profiles Reveals Reduced Correlation between MicroRNA and Target Gene in Cancer.Biomed Res Int. 2018 Dec 6;2018:1972606. doi: 10.1155/2018/1972606. eCollection 2018. Biomed Res Int. 2018. PMID: 30627543 Free PMC article.
-
The potential of miRNA-based approaches in glioblastoma: An update in current advances and future perspectives.Curr Res Pharmacol Drug Discov. 2024 Jun 29;7:100193. doi: 10.1016/j.crphar.2024.100193. eCollection 2024. Curr Res Pharmacol Drug Discov. 2024. PMID: 39055532 Free PMC article. Review.
References
-
- Hammoud MA, Sawaya R, Shi W, Thall PF, Leeds NE. Prognostic significance of preoperative MRI scans in glioblastoma multiforme. J Neurooncol. 1996;27:65–73. - PubMed
-
- Raza SM, Lang FF, Aggarwal BB, Fuller GN, Wildrick DM, Sawaya R. Necrosis and glioblastoma: a friend or a foe? A review and a hypothesis. Neurosurgery. 2002;51:2–12. - PubMed
MeSH terms
Substances
LinkOut - more resources
Full Text Sources
Other Literature Sources
Medical
Research Materials

