. 2017 May 25;7(1):2408.
doi: 10.1038/s41598-017-02539-w.

A sensitive mass spectrometry platform identifies metabolic changes of life history traits in C. elegans

Affiliations

A sensitive mass spectrometry platform identifies metabolic changes of life history traits in C. elegans

Arwen W Gao et al. Sci Rep. .

Abstract

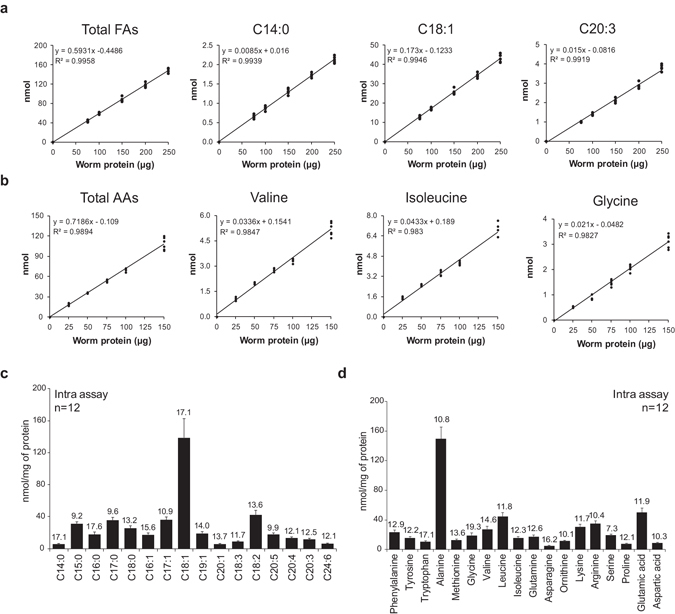
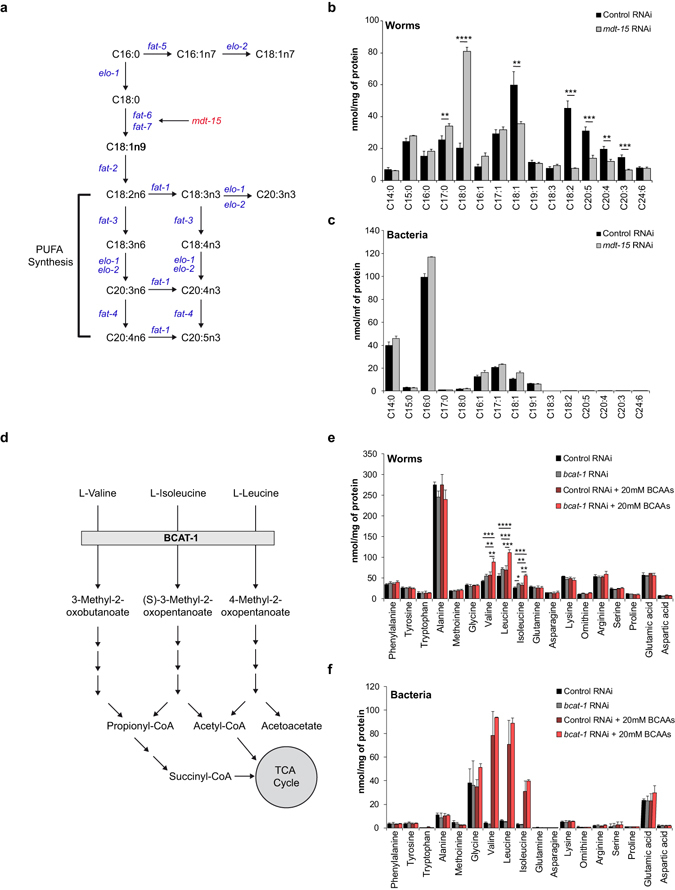
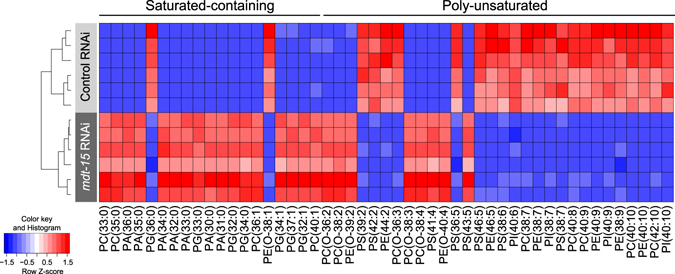
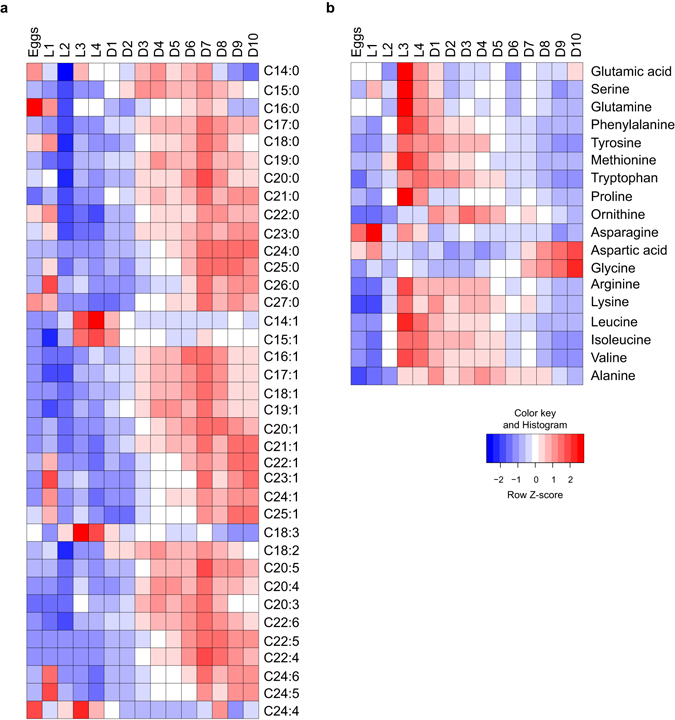
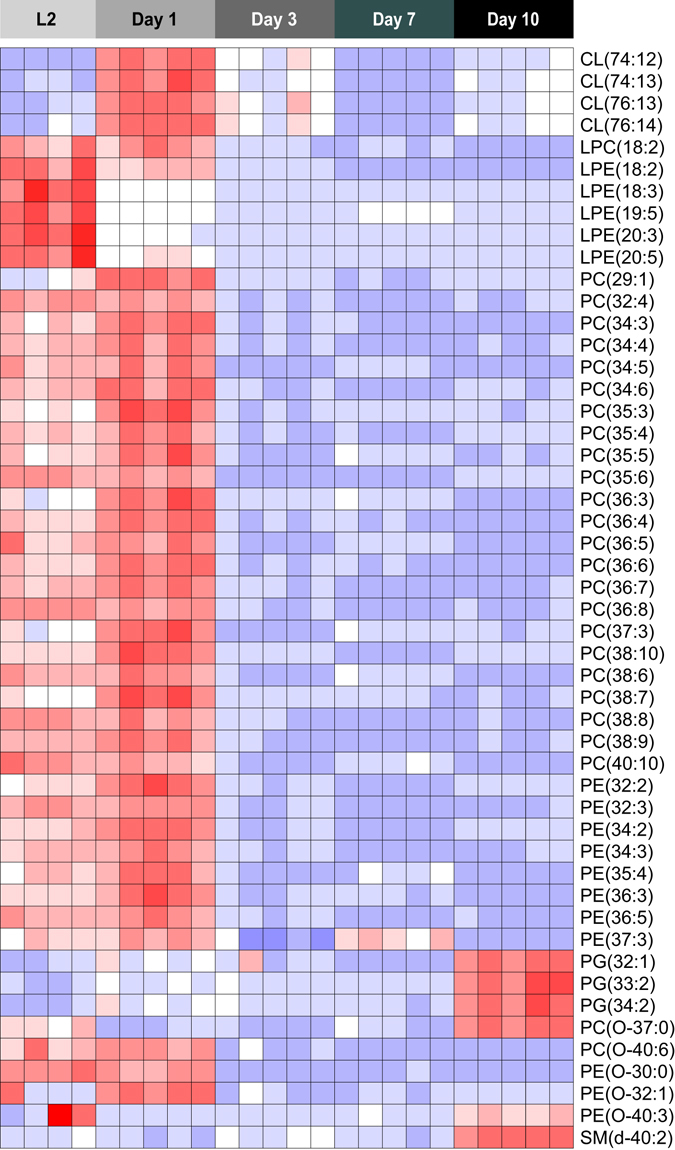
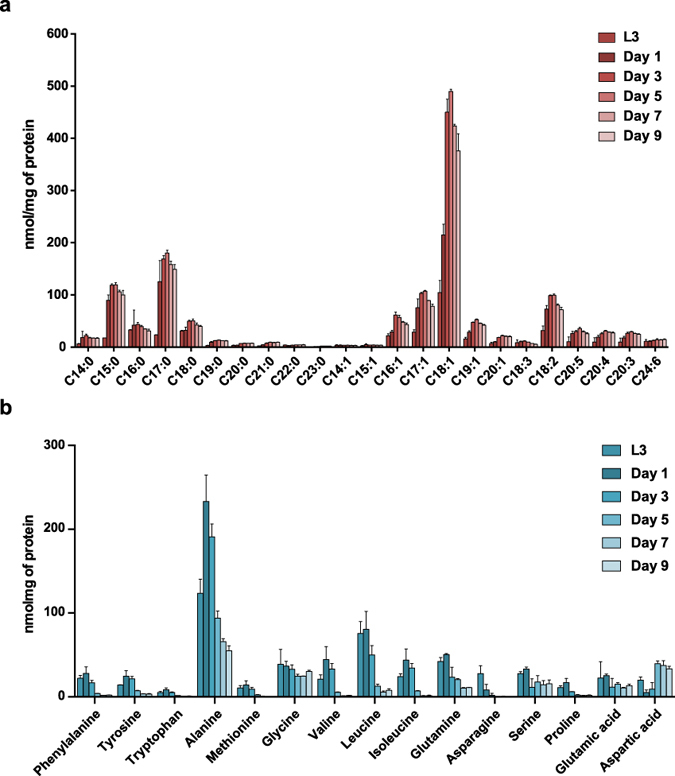
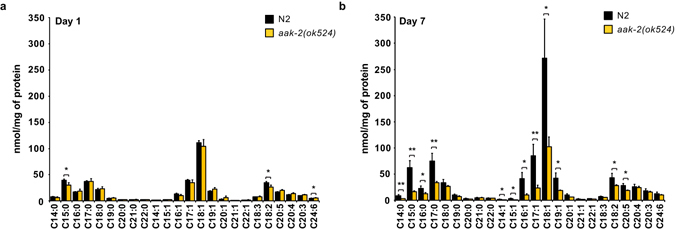
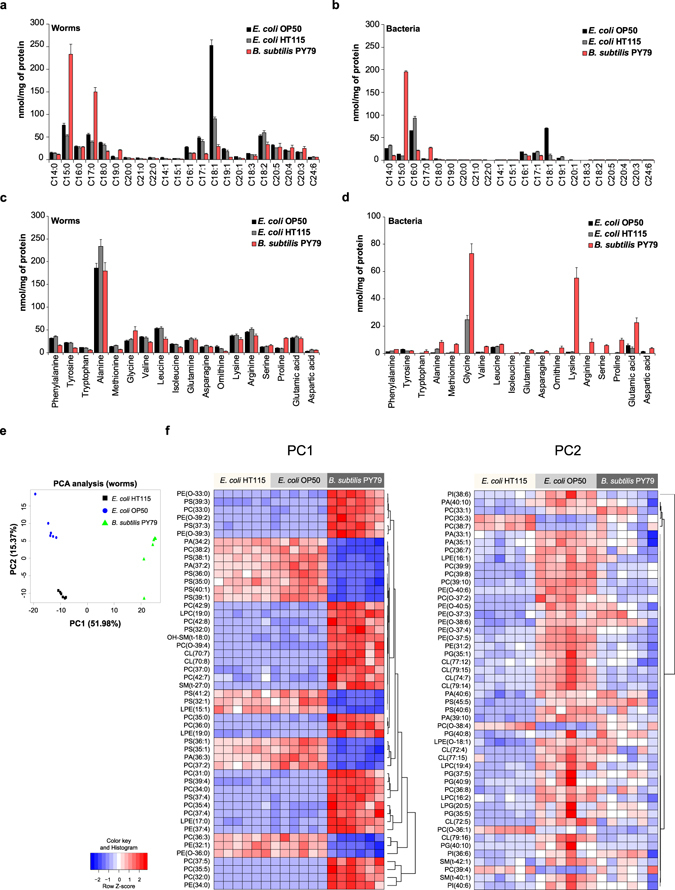
Abnormal nutrient metabolism is a hallmark of aging, and the underlying genetic and nutritional framework is rapidly being uncovered, particularly using C. elegans as a model. However, the direct metabolic consequences of perturbations in life history of C. elegans remain to be clarified. Based on recent advances in the metabolomics field, we optimized and validated a sensitive mass spectrometry (MS) platform for identification of major metabolite classes in worms and applied it to study age and diet related changes. Using this platform that allowed detection of over 600 metabolites in a sample of 2500 worms, we observed marked changes in fatty acids, amino acids and phospholipids during worm life history, which were independent from the germ-line. Worms underwent a striking shift in lipid metabolism after early adulthood that was at least partly controlled by the metabolic regulator AAK-2/AMPK. Most amino acids peaked during development, except aspartic acid and glycine, which accumulated in aged worms. Dietary intervention also influenced worm metabolite profiles and the regulation was highly specific depending on the metabolite class. Altogether, these MS-based methods are powerful tools to perform worm metabolomics for aging and metabolism-oriented studies.


Conflict of interest statement

The authors declare that they have no competing interests.

Figures

Figure 1
Figure 1
Linearity and precision of fatty acid (FA) and amino acid (AA) analysis in C. elegans. (a) FAs were extracted from increasing amount of worm protein lysate (0–250 µg) and measured using MS. A total of 35 FAs were detectable. A subset of FAs is shown here. (b) AAs were extracted from 0–150 µg of worm protein lysate and measured using UPLC-MS/MS. Eighteen AAs were detected and considered linear. A subset of AAs is shown here. (c,d) Twelve identical biological samples were independently extracted and measured within the same analytical run to determine intra-assay (within day variation) variation for FAs (c) and AAs (d). Bar graphs are expressed as mean ± SD. Values above the bars indicate the coefficient of variation. See also Supplementary Fig. S1 and Supplementary Table S1.
Figure 2
Figure 2
Validation of FA and AA analysis in C. elegans with deficient lipid or AA metabolism. (a) Schematic representation of polyunsaturated fatty acid (PUFA) synthesis pathway in C. elegans. mdt-15 is a key regulator in this pathway that controls the activity of stearoyl-CoA desaturases fat-6 and fat-7. (b) N2 worms exposed to mdt-15 RNAi accumulated C18:0 and had reduced levels of C18:1 and PUFAs. Bar graphs are expressed as mean ± SD; Significance was calculated using Student’s t-test. *p ≤ 0.05; **p ≤ 0.01; ***p ≤ 0.001; ****p ≤ 0.0001. (c) FA composition in mdt-15 RNAi bacteria was similar to that in the control RNAi bacteria. No PUFAs were detected in either RNAi bacteria. (d) Schematic representation of branched-chain amino acid (BCAA) catabolism. Branched-chain amino acid aminotransferase 1 (bcat-1) catalyzes the first reaction of this pathway. (e) Accumulation of BCAAs valine, leucine and isoleucine was detected in rrf-3(pk1426) worms treated with bcat-1 RNAi. Worms grown on plates supplemented with 20 mM BCAAs accumulated BCAAs, which was more pronounced in combination with bcat-1 RNAi. Bar graphs are expressed as mean ± SD, Significance was calculated using One-way ANOVA; *p ≤ 0.05; **p ≤ 0.01; ***p ≤ 0.001; ****p ≤ 0.0001. (f) BCAAs levels were similar in control and bcat-1 RNAi bacteria, but accumulated in BCAA-supplemented bacteria. See also Supplementary Fig. S2.
Figure 3
Figure 3
Phospholipid (PL) profiles in C. elegans after mdt-15 RNAi. Unsupervised hierarchical clustering of PL composition in N2 worms treated with mdt-15 RNAi. After mdt-15 RNAi, worms accumulated PLs with saturated acyl chains, and had decreased levels of PL species with a high degree of unsaturation (≥6 double bonds). Abundance of PLs with “intermediate” degree of saturation (1–5 double bonds) did not present a standard pattern between the mdt-15-treated and control worms. Phospholipids are designated as C(XX:Y), where XX denotes the total number of carbon atoms and Y the total number of double bonds in the fatty acyl chains. See also Supplementary Table S1.
Figure 4
Figure 4
FA and AA changes during life history of C. elegans. (a) FAs were measured in the different life history stages of C. elegans, i.e. eggs, four larval stages, and the first 10 days of adulthood. The abundance of FAs was low during the larval stages, increased during the reproductive phase (day 2–5) and decreased post-reproduction after reaching a peak at day 7 of adulthood. C18:3 reached the highest abundance during the later developmental phase and decreased with age. (b) Most AAs reached a peak during the later larval stages and decreased in the adult phase. The abundance of aspartic acid and glycine remained low in development and early adulthood, and significantly increased at later ages. See also Supplementary Fig. S3.
Figure 5
Figure 5
PL profiles during life history of C. elegans. PLs were measured in different stages of C. elegans life history. Several PL species, including many PCs, PEs, and LPEs were higher in L2 larvae and day 1 adults, and declined with age. Some CL species displayed a peak on day 1, while remaining at lower abundance during other life stages. Conversely, a few PG species had low abundance in early and mid- life stages, and displayed a marked increase in day 10 adults. See also Supplementary Table S1.
Figure 6
Figure 6
Metabolite changes in glp-4(bn2) mutant worms during life history. (a) FAs were measured in different ages of glp-4(bn2) mutants, including the larval stage 3 (L3), the reproductive phase (day 1–5 of adulthood), and post-reproductive phase (day 7–9). Most FA species increased during adult life, and slightly decreased in the post-reproductive phase. C18:3 reached its highest abundance at younger stage then decreased with age. (b) Most AA species reached a peak at L3 and day 1 of adulthood and subsequently decreased with age in glp-4(bn2) mutant worms. In the glp-4(bn2) worms aspartic acid accumulated and glycine remained more or less equal, similar to the changes observed in the wild type N2 worms grown under the same culture conditions (25 °C and without 5FU). See also Supplementary Fig. S4.
Figure 7
Figure 7
Metabolite profiles in young and aged aak-2 mutants. (a) In early adulthood (day 1), the abundance of FAs in aak-2(ok524) was similar to N2 worms. (b) While most FAs accumulated in aged N2 worms (day 7), this accumulation was attenuated in aged aak-2(ok524) worms, suggesting that this gene drives the observed age-related changes in lipid metabolism. Bar graphs are expressed as mean ± SD, Significance was calculated using Student’s t-test. *p ≤ 0.05; **p ≤ 0.01; ***p ≤ 0.001; ****p ≤ 0.0001.
Figure 8
Figure 8
Metabolite changes in worms exposed to different bacterial diets. The effect of dietary intervention on worm metabolism was investigated by feeding N2 worms with three types of bacteria including E. coli OP50, E. coli HT115 and B. subtilis PY79. (a) FA composition of N2 worms fed with different bacterial diets. Worms fed an E. coli OP50 diet accumulated the highest abundance of C18:1 fatty acid. A relatively high abundance of C18:1 was also found in worms fed with the other E. coli strain HT115. Worms fed a B. subtilis PY79 diet accumulated odd chain fatty acids, such as C15:0 and C17:0. (b) FA composition of the three bacterial diets. The two E. coli bacterial strains were enriched with C14:0, C16:0 and C18:1, while B. subtilis PY79 bacteria were enriched with odd chain fatty acids C15:0 and C17:0. Polyunsaturated FAs were absent in all three bacterial strains. (c) AA composition of N2 worms fed with different bacterial diets. AA profiles of worms fed with different bacterial diets did not display marked changes. Worms fed the E. coli strains showed similar AA profiles, while feeding worms with a B. subtilis diet showed a high abundance of proline. (d) AA composition of the three bacterial strains. E. coli strains contained low levels of most AA species, except glycine, which is relatively high abundant in E. coli HT115. B. subtilis PY79 bacteria were enriched in many AA species, especially glycine, lysine and glutamic acid. (e) Principal Component Analysis (PCA) score plot showing group separation based on PL profiles in N2 worms fed with different bacterial diets. Worms fed a B. subtilis PY79 diet were clearly separated from those fed with an E. coli diet, and a distinctive separation was evident between worms fed OP50 or HT115 E. coli. (f) PL composition in N2 worms fed with different bacterial diets. The metabolites contributing most to the groups’ separation based on PC1 and PC2 of the PCA are shown. Bar graphs are expressed as mean ± SD. See also Supplementary Fig. S5 and Suplementary Table S1.

References

    1. Houtkooper RH, Williams RW, Auwerx J. Metabolic networks of longevity. Cell. 2010;142:9–14. doi: 10.1016/j.cell.2010.06.029. - DOI - PMC - PubMed
    1. Lopez-Otin C, Blasco MA, Partridge L, Serrano M, Kroemer G. The hallmarks of aging. Cell. 2013;153:1194–1217. doi: 10.1016/j.cell.2013.05.039. - DOI - PMC - PubMed
    1. Riera CE, Dillin A. Tipping the metabolic scales towards increased longevity in mammals. Nature cell biology. 2015;17:196–203. doi: 10.1038/ncb3107. - DOI - PubMed
    1. Paek J, et al. Mitochondrial SKN-1/Nrf mediates a conserved starvation response. Cell Metab. 2012;16:526–537. doi: 10.1016/j.cmet.2012.09.007. - DOI - PMC - PubMed
    1. Fontana L, Partridge L. Promoting health and longevity through diet: from model organisms to humans. Cell. 2015;161:106–118. doi: 10.1016/j.cell.2015.02.020. - DOI - PMC - PubMed

Publication types