. 2017 May 25;7(1):2426.
doi: 10.1038/s41598-017-02587-2.

Microbiota modulation counteracts Alzheimer's disease progression influencing neuronal proteolysis and gut hormones plasma levels

Affiliations

Microbiota modulation counteracts Alzheimer's disease progression influencing neuronal proteolysis and gut hormones plasma levels

Laura Bonfili et al. Sci Rep. .

Abstract

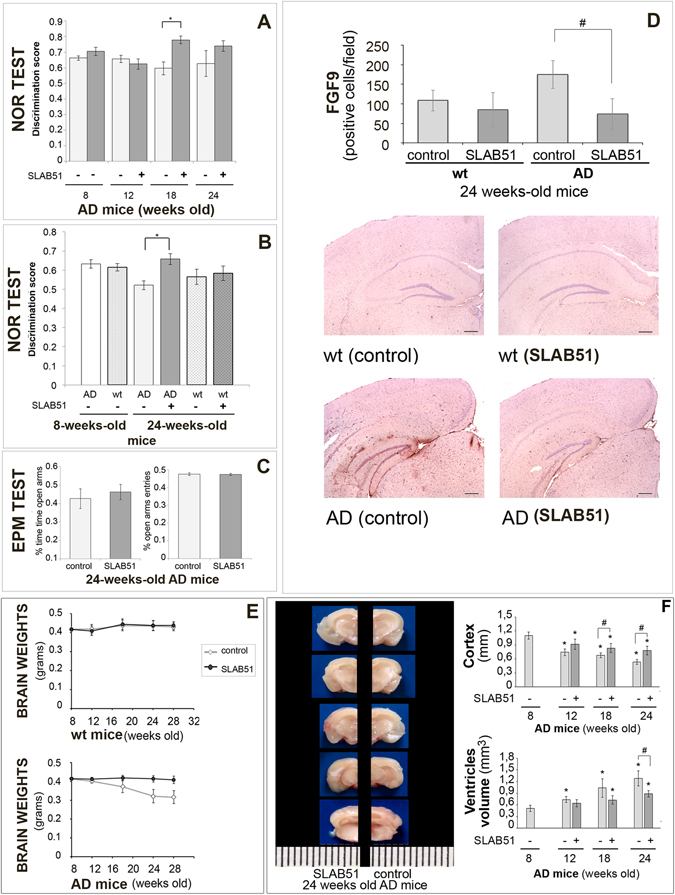
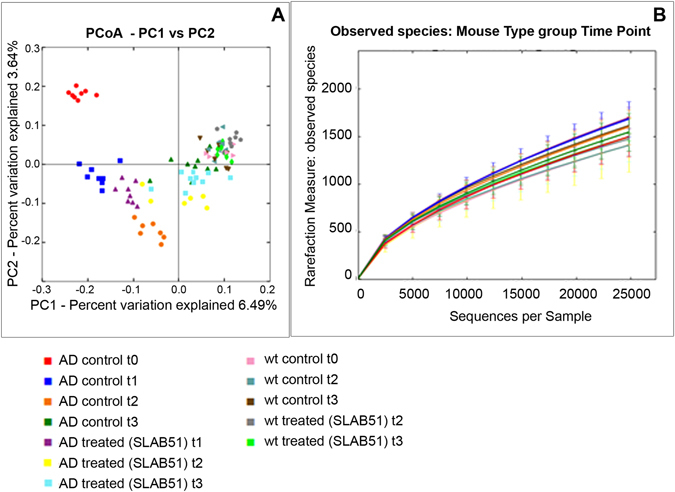
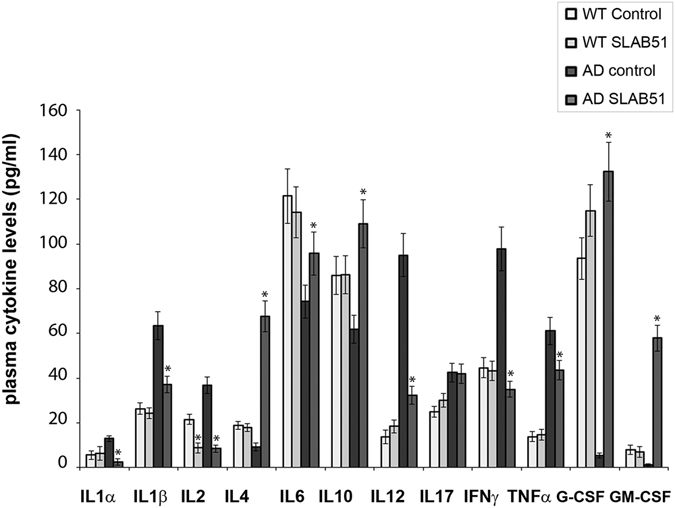
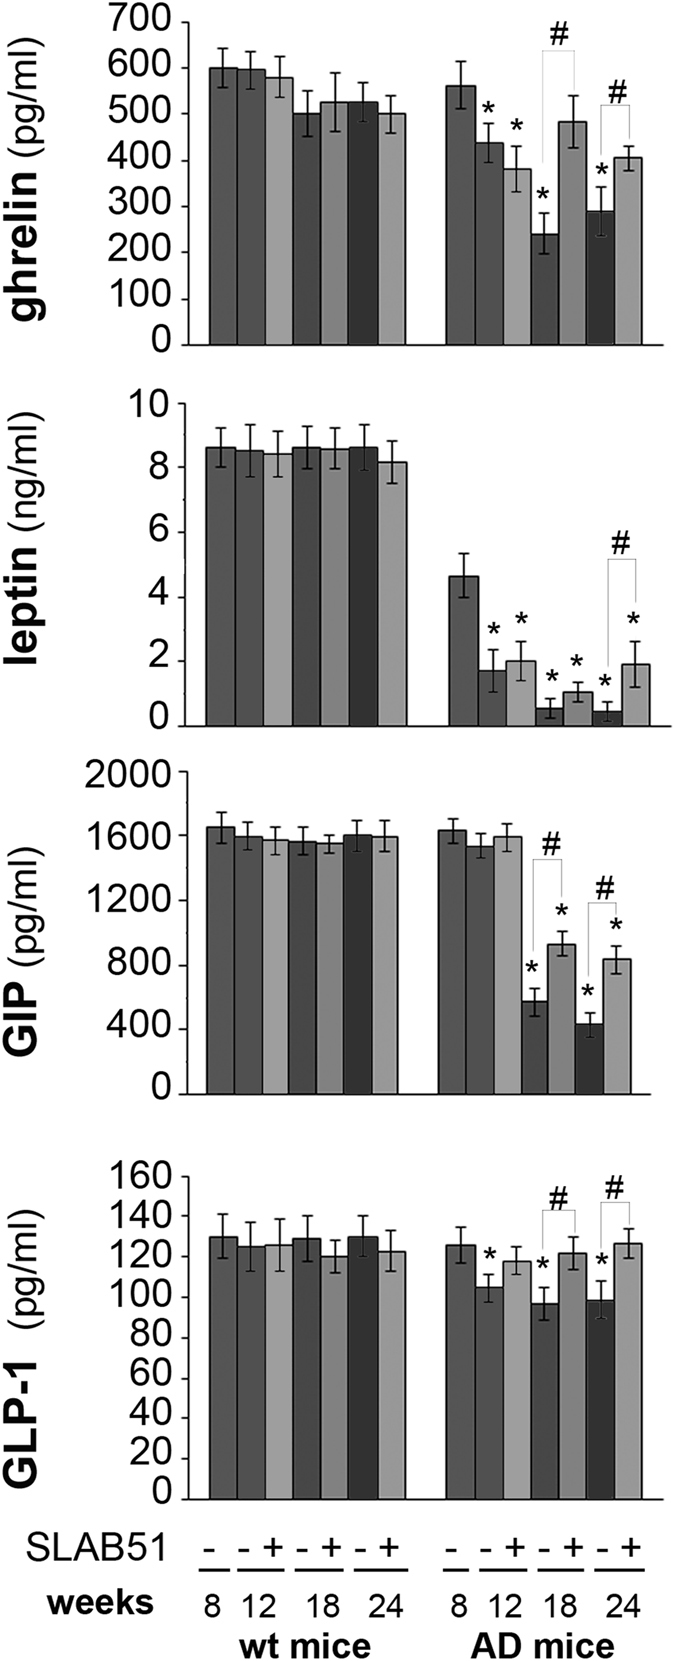
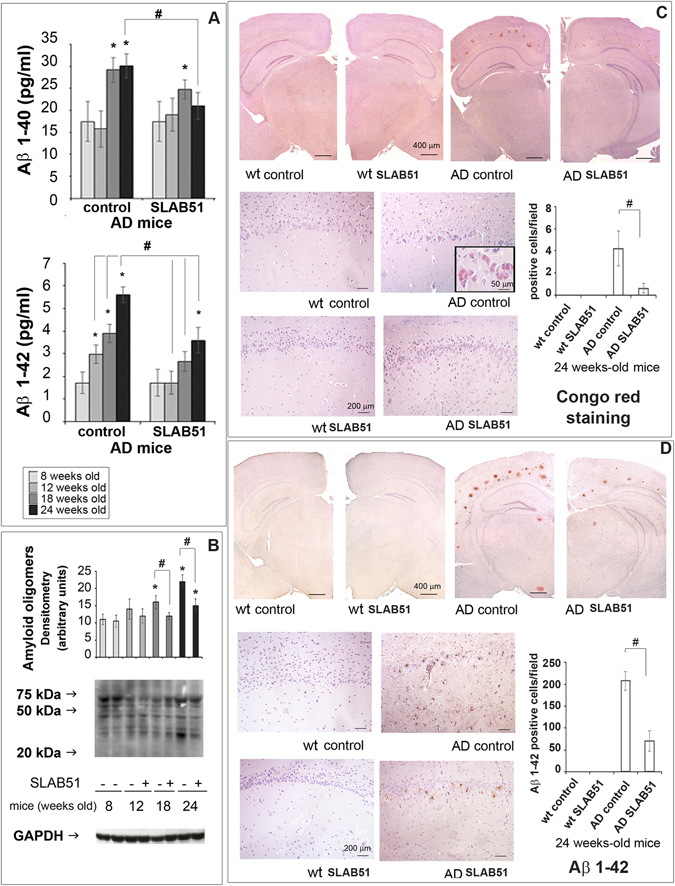
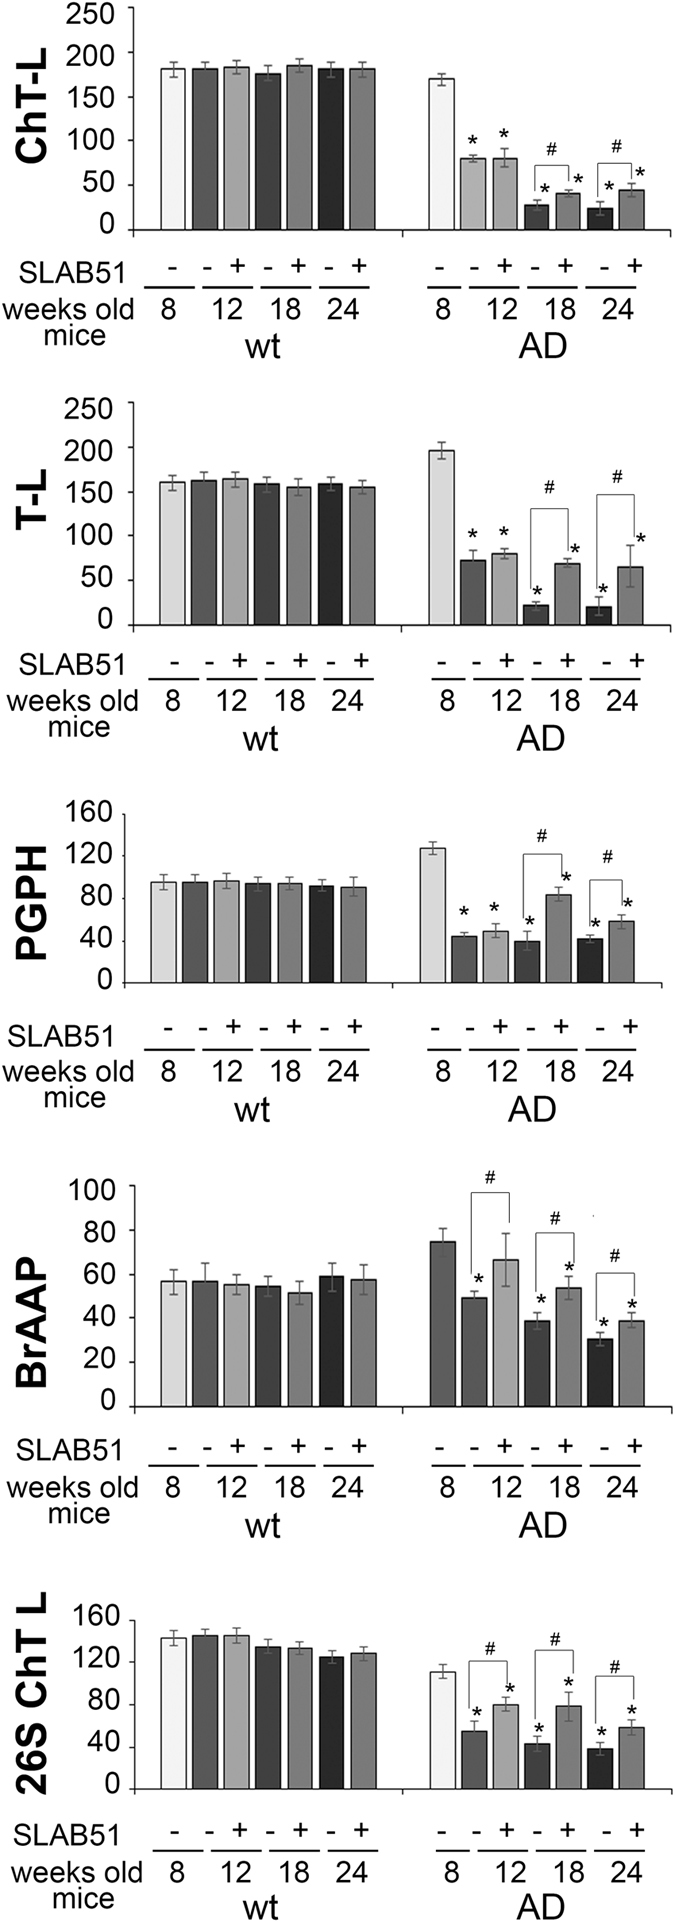
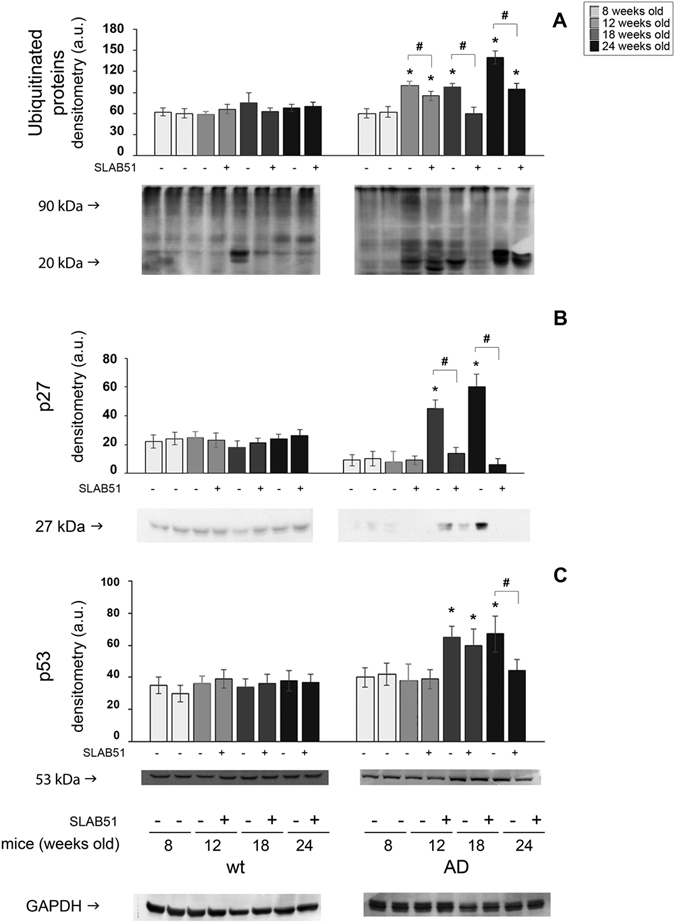
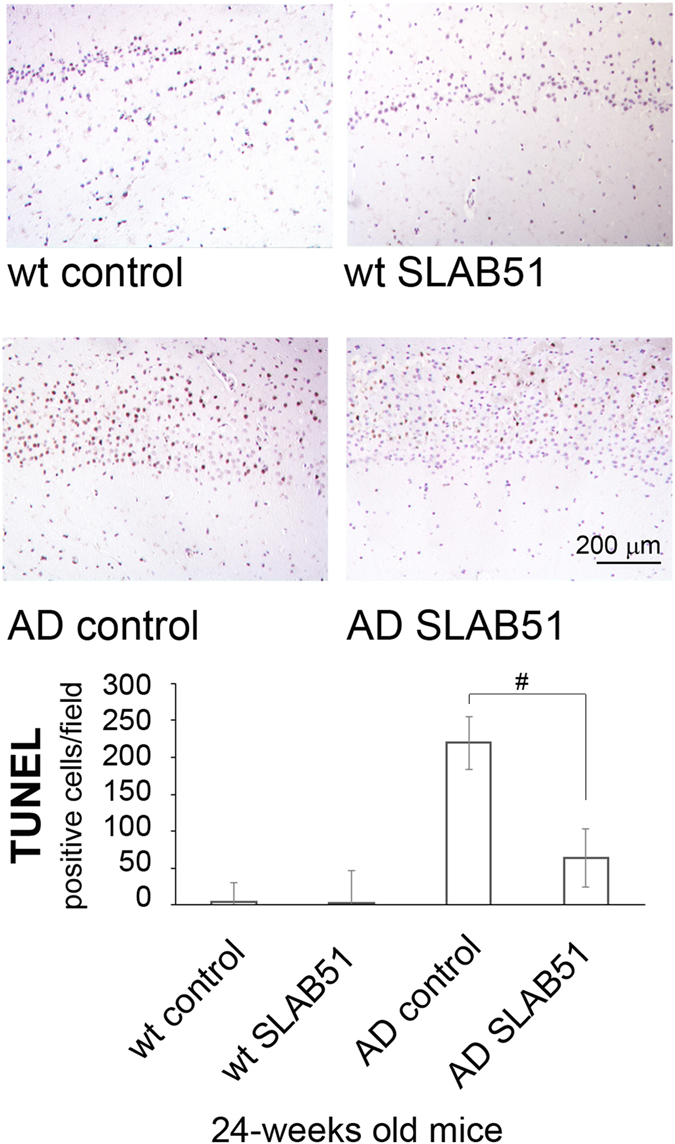
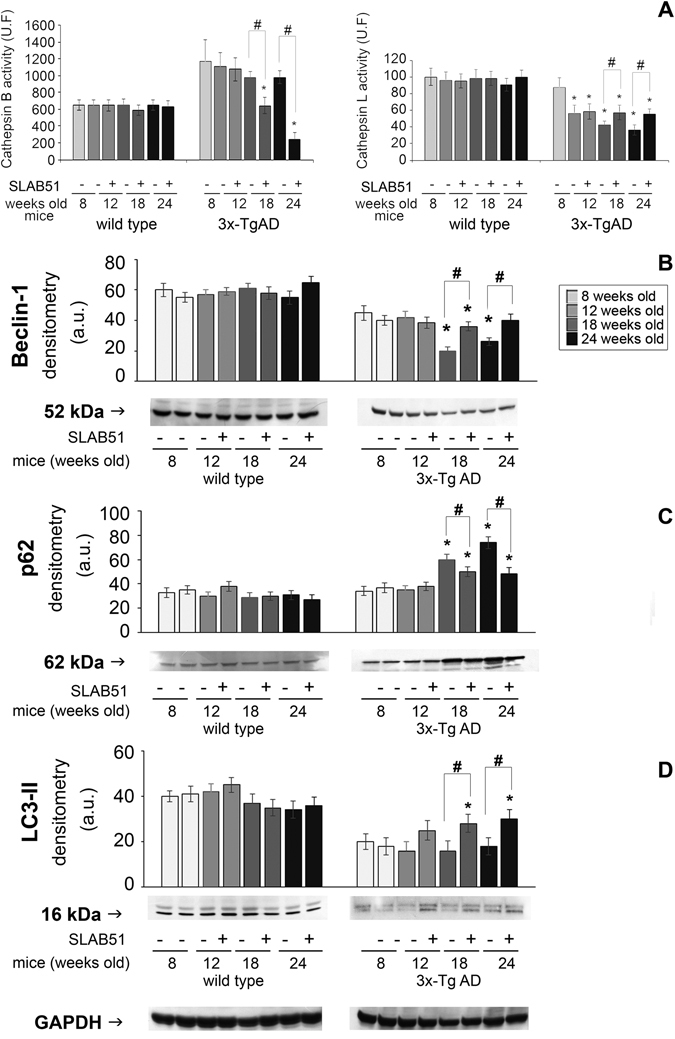
Gut microbiota has a proven role in regulating multiple neuro-chemical pathways through the highly interconnected gut-brain axis. Oral bacteriotherapy thus has potential in the treatment of central nervous system-related pathologies, such as Alzheimer's disease (AD). Current AD treatments aim to prevent onset, delay progression and ameliorate symptoms. In this work, 3xTg-AD mice in the early stage of AD were treated with SLAB51 probiotic formulation, thereby affecting the composition of gut microbiota and its metabolites. This influenced plasma concentration of inflammatory cytokines and key metabolic hormones considered therapeutic targets in neurodegeneration. Treated mice showed partial restoration of two impaired neuronal proteolytic pathways (the ubiquitin proteasome system and autophagy). Their cognitive decline was decreased compared with controls, due to a reduction in brain damage and reduced accumulation of amyloid beta aggregates. Collectively, our results clearly prove that modulation of the microbiota induces positive effects on neuronal pathways that are able to slow down the progression of Alzheimer's disease.


Conflict of interest statement

The authors declare that they have no competing interests.

Figures

Figure 1
Figure 1
SLAB51 ameliorates behavioral performance and reduces brain damage in AD mice. Novel Object Recognition (NOR) test (first experiment): 15 mice/sub-group were allowed to explore an identical pair of objects, and after 3 hours, they are presented with the familiar object and a novel object. The discrimination scores for 8, 12, 18, and 24-week-old AD mice are reported in panel A. NOR test (second experiment) performed for the first time on treated and untreated 24-week-old mice (groups’ size = 10), panel B. Panel C: Elevated plus maze test. % open arm entries and % time spent in the open arms by untreated and treated AD mice at 24 weeks of age (first experiment, groups’ size = 15). Data points marked with an asterisk are statistically significant compared to their respective non-treated control mice (*p < 0.05). Panel D Immunodetection of FGF9 protein in brain slides of 24-weeks old untreated and treated wt and AD mice (8 animals per group) from the first experiment. Results are reported as number of cells immunoistochemically positive for FGF9 per field ± ES (#statistically significant with respect to the corresponding untreated mice p < 0.05). For each histological section 5 randomly selected field were analyzed at 40xHPFs. Representative images of immunohistochemical staining are reported. Panel E: Brain weights expressed in grams ± ES of both treated and untreated wt and AD mice over time (groups’ size is 8). Panel F: Measurement of the cortex thickness (mm) and ventricular sizes evaluation (mm3) in the brain sections of control and SLAB51 treated AD mice at 8, 12, 18 and 24 weeks of age. Data are reported as mean values ± ES (*statistically significant with respect to 8 weeks-old untreated mice p < 0.05; #statistically significant with respect to the corresponding untreated mice p < 0.05). Consecutive brain slides of treated and untreated 24 weeks-old AD mice are shown.
Figure 2
Figure 2
Microbiota analysis. PCoA plots based on unweighted Unifrac distances and rarefaction curves are presented. The microbiota was analyzed using 16S rRNA gene sequencing. PCoA plots based on unweighted Unifrac distances reveal separation between the microbiota of wt and AD mice at all time points, indicating that the affected mice have different microbiota structure compared to wt mice. No significant differences were found in alpha diversity indices, revealing no difference in species richness. The progression over time from week 8 to week 24 was more pronounced in the AD mice compared to the wt mice. Also, treatment with SLAB51 induced larger changes in AD mice compared to wt mice, but no differences in species richness (t0 = 8 weeks; t1 = 12 weeks; t2 = 18 weeks; t3 = 24 weeks).
Figure 3
Figure 3
Inflammatory cytokines. ELISA of inflammatory cytokines measured in the plasma of 24 week-old wt and AD mice untreated or treated with SLAB51. Analytes concentrations are expressed as mean ± SE. Data points marked with an asterisk are statistically significant compared to their respective untreated mice (*p < 0.05).
Figure 4
Figure 4
Plasma concentrations of gut hormones. Hormones were determined in the plasma of treated and control wt and AD mice. Results are expressed as percentage with respect to 8 week-old untreated mice. Data points marked with an asterisk are statistically significant compared to 8 week-old untreated control mice (*p < 0.05). Data points marked with hash are statistically significant compared to their respective control mice in the same time point (#p < 0.05).
Figure 5
Figure 5
Aβ load. Panel A: Aβ1–40 and Aβ1–42 levels expressed as pg/ml determined by ELISA in the brains of AD mice treated or not with SLAB51 (n = 8). Panel B: Expression levels of amyloid oligomers detected by western blot. The densitometry from five separate blots and a representative immunoblot are reported. Equal protein loading was verified by using an anti-GAPDH antibody. The detection was executed by ECL. Data points marked with an asterisk are statistically significant compared to 8 weeks-old controls (*p < 0.05). Data points marked with hash are statistically significant compared to their respective control mice in the same time point (#p < 0.05). Uncropped gels are reported in Supplemental Figure 1. Panel C: Congo red staining of extra- and intra-cellular amyloid deposits in 24-week-old wt and AD mice administered with water or SLAB51 (groups’ size is 8). Specific Congo red staining was progressively seen in somata and processes of hippocampal Ammon’s horn pyramidal cells (insert), especially in untreated AD mice. Strong extracellular deposits demonstrate the formation of amyloid plaques, also visualized by immunostaining. (Congo red stain, with Meyer’s hematoxylin nuclear counterstain. Coronal sections, Bar = 400 μm; dentate gyrus magnification, Bar = 200 μm; insert, Bar = 50 μm). Data are presented as positive cells/field and are representative of 5 histological section for each brain (n = 8 per sub-group). Data points marked with a hash are statistically significant compared to their respective water-treated mice (p < 0.05). Panel D. Aβ1–42 IHC stain: wt and AD mice administered with water (control) or SLAB51. In both upper (low magnification) and lower (high magnifications) groups of images, immunoreactivity towards Aβ1–42 peptide (Aβ1–42 C-terminus pAb, Millipore) was progressively seen in somata and processes of hippocampal pyramidal cells and cortical neurons of AD untreated mice. A strong extracellular reactivity, associated with Aβ plaque formation, can be observed in both treated and untreated AD mice (IHC stain, with Meyer’s hematoxylin nuclear counterstain. Coronal sections, Bar = 400 μm; dentate gyrus magnification, Bar = 200 μm). The histogram shows the Aβ1–42 positive cells/field. Data represent 5 histological section for each brain (n = 8). Data points marked with a hash are statistically significant compared to their respective water-treated mice (p < 0.05).
Figure 6
Figure 6
Effect of SLAB51 on proteasomal activity. Proteasome activity in SLAB51 treated and untreated wt (left) and AD (right) mice. The ChT-L, T-L, PGPH and BrAAP activities of the 20S proteasome and the ChT-L activity of the 26S proteasome were measured in brain homogenates as described in the Methods section. Results are expressed as fluorescence units (U. F.). Data points marked with an asterisk are statistically significant compared to untreated 8-week-old mice (*p < 0.05). Data points marked with a hash are statistically significant compared to their respective control mice in the same time point (*p < 0.05).
Figure 7
Figure 7
Effect of SLAB51 on proteasomal substrates. Detection of the levels of ubiquitinated proteins (panel A), p27 (panel B) and p53 (panel C) in SLAB51 treated and untreated wt and AD mice. The densitometric analyses obtained from five separate blots and representative immunoblots are shown. Equal protein loading was verified by using an anti-GAPDH antibody. The detection was executed by an ECL western blotting analysis system. Data points marked with an asterisk are statistically significant compared to 8-week-old control mice (*p < 0.05). Data points marked with a hash are statistically significant compared to their respective control mice at the same time point (#p < 0.05). Uncropped gels are reported in Supplemental Figure 1.
Figure 8
Figure 8
TUNEL detection of apoptotic neurons in hippocampal area of SLAB51 treated and untreated AD and wt mice. Apoptotic cells are characterized by black-brownish nuclear stain, as shown in the representative images. (TUNEL (DeadEnd, Promega®) reaction, with Meyer’s hematoxylin nuclear counterstain. Bar = 200 μm.). The histogram shows the TUNEL positive cells/field. Data are representative of 5 histological section for each brain (n = 8 per sub-group). Data points marked with a hash are statistically significant compared to their respective water-treated mice (p < 0.05).
Figure 9
Figure 9
Autophagic markers. Panel A: Cathepsin B and cathepsin L activity in SLAB51 treated and untreated wt and AD mice. Results are expressed as fluorescence units. Data points marked with an asterisk are statistically significant compared to their respective untreated control mice (*p < 0.05). Panels B,C,D: levels of the autophagy-related proteins Beclin 1, p62 and LC3-II in SLAB51 treated and untreated wt and AD mice. Representative immunoblots and corresponding densitometric analyses obtained from five separate blots are shown. Equal protein loading was verified by using an anti-GAPDH antibody. The detection was executed by an ECL western blotting analysis system. Data points marked with an asterisk are statistically significant compared to 8-week-old control mice (*p < 0.05). Data points marked with a hash are statistically significant compared to their respective control mice at the same time point (#p < 0.05) Original membranes strips are reported in Supplemental Figure 1.

Similar articles

Cited by

References

    1. Cecarini V, et al. Crosstalk between the ubiquitin-proteasome system and autophagy in a human cellular model of Alzheimer’s disease. Biochimica et biophysica acta. 2012;1822:1741–1751. doi: 10.1016/j.bbadis.2012.07.015. - DOI - PubMed
    1. Zheng Q, Li J, Wang X. Interplay between the ubiquitin-proteasome system and autophagy in proteinopathies. International journal of physiology, pathophysiology and pharmacology. 2009;1:127–142. - PMC - PubMed
    1. Nilsson P, et al. Abeta secretion and plaque formation depend on autophagy. Cell reports. 2013;5:61–69. doi: 10.1016/j.celrep.2013.08.042. - DOI - PubMed
    1. van Tijn P, et al. Mutant ubiquitin decreases amyloid beta plaque formation in a transgenic mouse model of Alzheimer’s disease. Neurochemistry international. 2012;61:739–748. doi: 10.1016/j.neuint.2012.07.007. - DOI - PubMed
    1. Gomes S, et al. Protective effect of leptin and ghrelin against toxicity induced by amyloid-beta oligomers in a hypothalamic cell line. Journal of neuroendocrinology. 2014;26:176–185. doi: 10.1111/jne.12138. - DOI - PubMed

Publication types

MeSH terms