. 2017 Sep;95(8):716-728.
doi: 10.1038/icb.2017.42. Epub 2017 May 26.

Restimulation-induced T-cell death through NTB-A/SAP signaling pathway is impaired in tuberculosis patients with depressed immune responses

Affiliations

Restimulation-induced T-cell death through NTB-A/SAP signaling pathway is impaired in tuberculosis patients with depressed immune responses

Rodrigo E Hernández Del Pino et al. Immunol Cell Biol. 2017 Sep.

Abstract

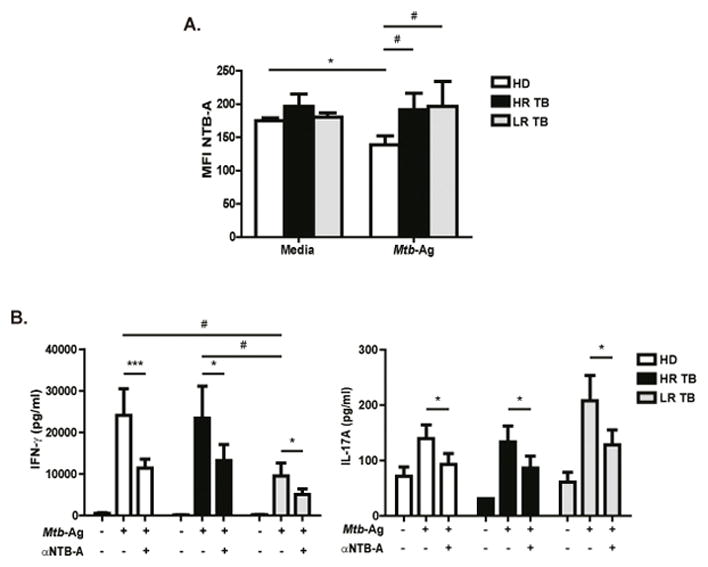
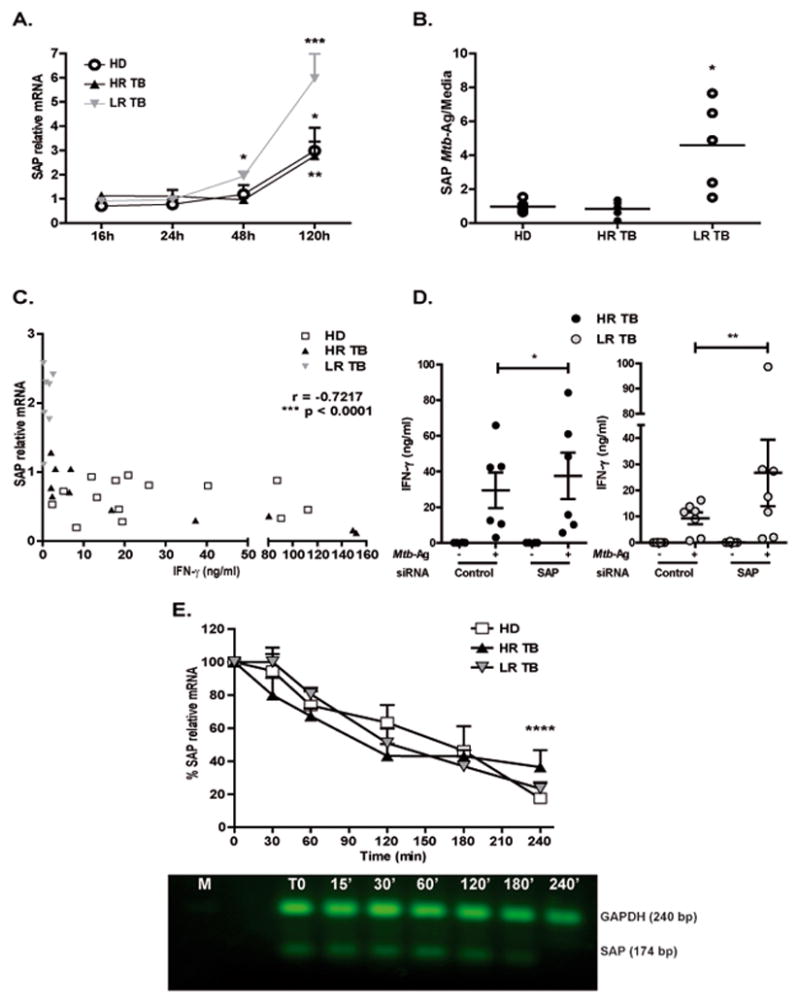
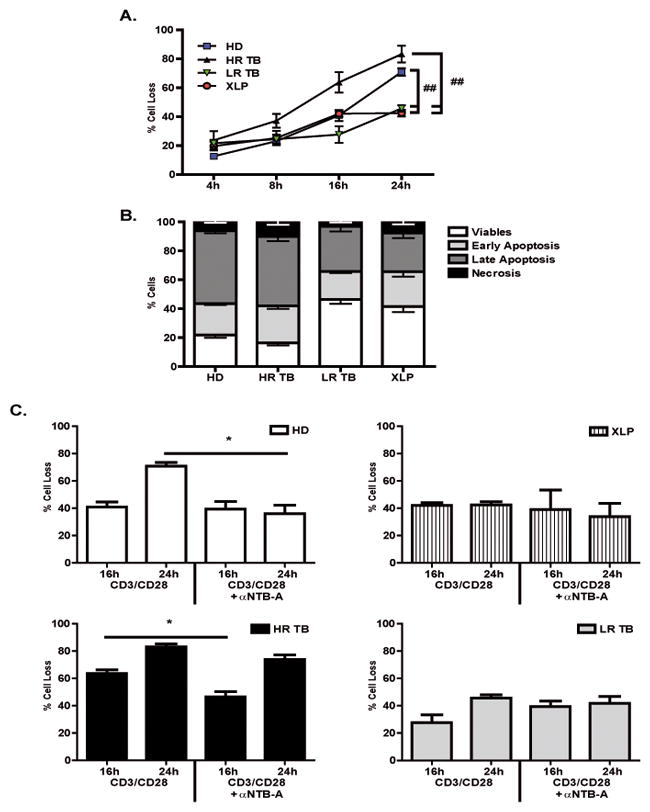
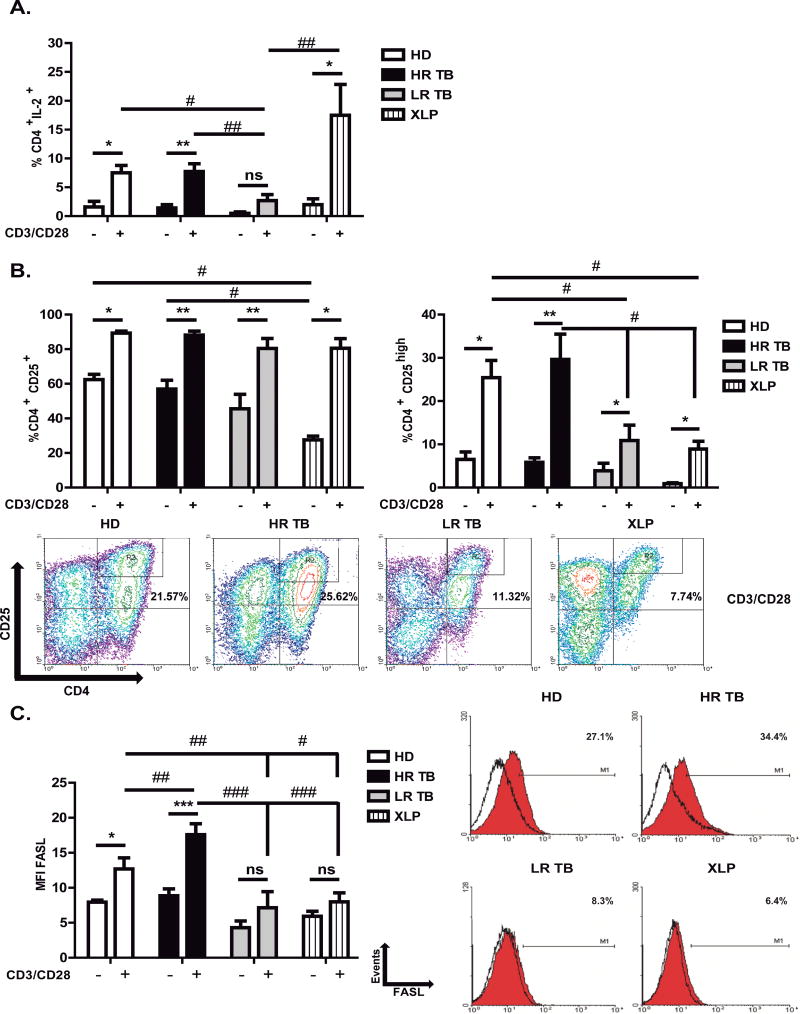
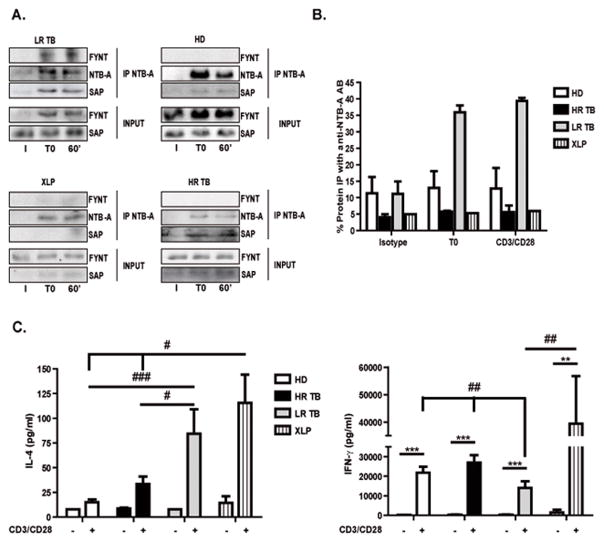
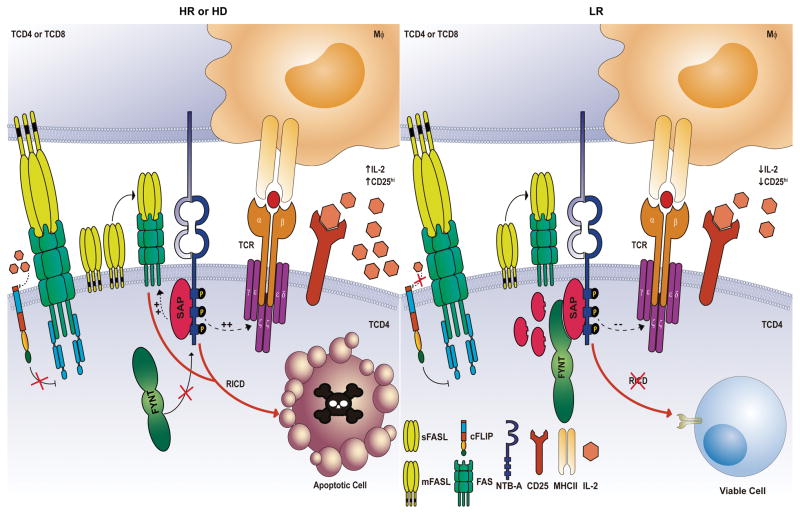
Production of IFN-γ contributes to host defense against Mycobacterium tuberculosis (Mtb) infection. We previously demonstrated that Signaling lymphocytic activation molecule-associated protein (SAP) expression on cells from tuberculosis (TB) patients was inversely correlated with IFN-γ production. Here we first investigated the role of NK, T- and B-cell antigen (NTB-A)/SAP pathway in the regulation of Th1 response against Mtb. Upon antigen stimulation, NTB-A phosphorylation rapidly increases and afterwards modulates IFN-γ and IL-17 secretion. To sustain a healthy immune system, controlled expansion and contraction of lymphocytes, both during and after an adaptive immune response, is essential. Besides, restimulation-induced cell death (RICD) results in an essential homeostatic mechanism for precluding excess T-cell accumulation and associated immunopathology during the course of certain infections. Accordingly, we found that the NTB-A/SAP pathway was required for RICD during active tuberculosis. In low responder (LR) TB patients, impaired RICD was associated with diminished FASL levels, IL-2 production and CD25high expression after cell-restimulation. Interestingly, we next observed that SAP mediated the recruitment of the Src-related kinase FYNT, only in T cells from LR TB patients that were resistant to RICD. Together, we showed that the NTB-A/SAP pathway regulates T-cell activation and RICD during human TB. Moreover, the NTB-A/SAP/FYNT axis promotes polarization to an unfavorable Th2-phenotype.


Conflict of interest statement

Conflict of Interest

The authors declare no conflict of interest.

Figures

Figure 1
Figure 1. Functional characterization of NTB-A
(A) PBMCs from HD (N=8), High Responder Tuberculosis patients (HR TB, N=5) and Low Responder Tuberculosis patients (LR TB, N=4) were stimulated with Mtb-Ag for 5 days. Then, NTB-A expression was determined on CD3+ T cells by flow cytometry, by first gating on lymphocytes by light scatter, and then on CD3+ cells. Bars represent the mean fluorescence intensity (MFI) ± Standard Error of the Mean (SEM) of NTB-A on CD3+ T cells. (B) PBMCs from HD (N=12), HR TB (N=7) and LR TB (N=5) were stimulated with Mtb-Ag for 5 days in the presence or absence of α-NTB-A blocking antibody. Cell free supernatants were collected and IFN-γ and IL-17A production was determined by ELISA. Bars represent the mean ± SEM of the values. Statistical differences were calculated using One way ANOVA-Uncorrected Fisher’s LSD. ***p < 0.001; *,#p < 0.05.
Figure 2
Figure 2. SAP mRNA and protein levels are increased in patients with low IFN-γ production
(A) PBMCs from Healthy Donors (HD, N=10), High Responder Tuberculosis patients (HR TB, N=8) and Low Responder Tuberculosis patients (LR TB, N=6) were stimulated with Mtb-Ag for different times. SAP mRNA expression was determined by Real time PCR. Values were calculated as fold of increase using the comparative method for relative quantification after normalization to GAPDH expression. Fold increase = 2(−ΔΔCt), where ΔCt = [Ct (SAP) – Ct (GAPDH)] and ΔΔCt [ΔCt Mtb − ΔCt Media]. Bars represent the mean ± SEM. (B) Total cell protein extracts were prepared from PBMCs stimulated with Mtb-Ag for 5 days and SAP protein expression were then measured by Western Blot. (C) Correlation between IFN-γ production and SAP mRNA expression. PBMCs from HD (N=16), HR TB (N=11) and LR TB (N=7) patients were stimulated for 48h with Mtb-Ag. Cell-free supernatants were then collected and assayed for IFN-γ by ELISA (X axis). SAP mRNA expression was determined by Real time PCR (Y axis). (D) PBMCs from HR TB (N=6, black circles) and LR TB (N=7, grey circles) patients were incubated in presence of SAP siRNA or unspecific control (GFP) for 48h. After 5 days of Mtb-Ag stimulation, cell-free supernatants were collected and assayed for IFN-γ by ELISA. Bars represent the mean ± SEM. (E) PBMCs from HD (N=5), HR (N=5) and LR (N=4) tuberculosis patients were stimulated with Mtb-Ag for 48 hours. Actinomycin D (actD) was added and cells were collected at different time points. SAP mRNA levels were determined by Real Time PCR. Values are expressed as the mean ± SEM of the Fold increase relative to time zero, as follows Fold increase = 2(−ΔΔCt), where ΔCt = [Ct (SAP) – Ct (GAPDH)] and ΔΔCt [ΔCt Mtb with actD − ΔCt Mtb without actD]. The image shows cropped gel corresponding to GAPDH and SAP mRNA decay. ****p <0.0001 Differences between time zero vs. Mtb with ActD at 240’ for each group of individuals. (A, B, D, E) One way ANOVA-Uncorrected Fisher’s LSD. *p <0.05, **p <0.01, ****p <0.0001. (C) Correlation factor (r) and p value were calculated by the non-parametric Spearman correlation test.
Figure 3
Figure 3. NTB-A/SAP signaling mediates apoptosis after TCR restimulation
PBMCs from Healthy Donors (HD, N=11), High Responder Tuberculosis patients (HR TB, N=7), Low Responder Tuberculosis patients (LR TB, N=6) and SAP deficient (XLP, N=7) patients were stimulated with Mtb-Ag for 5 days. Then, the cells were washed and cultured with RPMI plus hrIL-2. After 7 days, lymphocyte enrichment was performed by centrifugation over Ficoll-Hypaque and cells were stimulated with α-CD3 + α-CD28 for different times. (A) Apoptosis was determined by evaluating Annexin V (A) and Propidium Iodide (IP) by first gating on lymphocytes by light scatter and then on CD3+ cells. Cell death was quantified as percentage of cell loss = (1 – [number of treated viable cells / number of untreated viable cells]) × 100. Viable cells correspond to AIP. Each bar represents the mean ± SEM of the % Cell Loss. (B) Percentage of cells in each stage of the apoptotic process after 24h of restimulation where: Early Apoptosis (A+IP), Late Apoptosis (A+IP+) and Necrosis (AIP+). (C) Cells were restimulated in the presence or absence of α-NTB-A blocking mAb for 24h. Apoptosis was determined by evaluating Annexin V (A) and Propidium Iodide (IP). Cell death was quantified as described in (A). Each bar represents the mean ± SEM of the % Cell Loss. One way ANOVA-Uncorrected Fisher’s LSD. *p <0.05, ##p <0.01.
Figure 4
Figure 4. Association between expression of IL-2, IL-2 receptor (CD25) and FASL with RICD sensitivity
(A–C) PBMCs from Healthy Donors (HD), High Responder Tuberculosis patients (HR TB), Low Responder Tuberculosis patients (LR TB), and SAP deficient (XLP) patients were stimulated with Mtb-Ag for 5 days. Then, the cells were washed and cultured with RPMI plus hrIL-2. After 7 days, lymphocyte enrichment was performed by centrifugation over Ficoll-Hypaque and cells were stimulated with α-CD3 + α-CD28 for 24h. Then, (A) intracellular IL-2 (HD N= 5, HR TB N= 9, LR TB N= 8 and XLP N= 6), (B) surface CD25 (HD N= 5, HR TB N= 9, LR TB N= 8 and XLP N= 5) and (C) surface FASL (HD N= 7, HR TB N= 10, LR TB N= 6 and XLP N= 5) expression were determined by flow cytometry on CD4+ T cells. Each bar represents the mean ± SEM of the percentages of CD4+IL-2+ (A), CD4+CD25+ (B) cells; and the mean fluorescence intensity (MFI) ± SEM of FASL+ CD4+ (C). IL-2, CD25 and FASL expression was determined by first gating on lymphocytes by light scatter and then on CD4+ cells. CD25high expression was determined by gating on lymphocytes by light scatter, then CD25 vs CD4 was plotted as shown in the representative dot plot. One way ANOVA-Uncorrected Fisher’s LSD. **,##p < 0.01; *,#p < 0.05. ns, differences not significant.
Figure 5
Figure 5. The NTB-A/SAP pathway impairs RICD in LR TB patients
PBMCs from Healthy Donors (HD, N=3), High Responder Tuberculosis patients (HR TB, N=3), Low Responder Tuberculosis patients (LR TB, N=3) and SAP deficient (XLP, N=1) patients were stimulated with Mtb-Ag for 5 days. Then, the cells were washed and cultured with RPMI plus hrIL-2. After 7 days, lymphocyte enrichment was performed by centrifugation over Ficoll-Hypaque and afterwards cells were stimulated with α-CD3 + α-CD28 for 1h. (A) Immunoprecipitation of NTB-A. The immunoprecipitates were separated by SDS-PAGE and immunoblotted for the presence of SAP, NTB-A and FYNT. SAP and FYNT expression in input lysates are shown for comparison (bottom) (I = Isotype, T0 = unstimulated cells and 60’ = stimulated cells with α-CD3 + α-CD28 for 1h). The images show cropped lines corresponding to NTB-A, SAP and FYNT. (B) Polyacrylamide gels were scanned, densitometry was performed, and the results were expressed as % FYNT IP with anti-NTB-A= ([FYNT AU Immunoprecipitated fraction (IP)/(FYNT AU IP + FYNT AU Non-Immunoprecipitated fraction])*100. (C) PBMCs from HD (N=6), HR (N=7), LR (N=5) tuberculosis patients and XLP (N=3) patients were stimulated with Mtb-Ag for 5 days. Then, cells were washed and cultured with RPMI plus hrIL-2. After 7 days, lymphocyte enrichment was performed by centrifugation over Ficoll-Hypaque and cells were stimulated with α-CD3 + α-CD28 for 24 h. Cell free supernatants were collected and IL-4 and IFN-γ production was determined by ELISA. Bars represent the mean ± Standard Error of the Mean (SEM) of the values. One way ANOVA-Uncorrected Fisher’s LSD. ***p <0.001, **,##p <0.01, #p <0,05.
Figure 6
Figure 6. Model of NTB-A/SAP signaling that induces RICD during active tuberculosis
In Healthy Donors (HD, left panel) and High Responder Tuberculosis patients (HR TB, left panel), SAP is associated with NTB-A, dislodging SHP-1 and inducing the expression of target genes such as FASL, increasing the TCR signal strength that triggers the RICD process after TCR restimulation. The exclusion of FYNT and the involvement of proteins like IL-2 and its receptor CD25, ensure the homeostasis of T cells in response to M. tuberculosis. On the other hand, Low Responder Tuberculosis patients (LR TB, right panel) suppress the induction of apoptosis by the recruitment of FYNT to NTB-A cytoplasmic tail. This association abrogates NTB-A signaling to sustain the viability of T cells. Furthermore, cellular FLICE-like inhibitory protein could lead to an inhibition of FAS receptor as a consequence of the low expression of IL-2. Similar to LR TB, SAP-deficient T cells of XLP patients show a resistance to RICD, inhibiting NTB-A signaling and allowing cells to escape from apoptosis. Solid arrows represent regulation based on experimental evidence; dotted arrows represent inferred regulation.

Similar articles

Cited by

References

    1. World Health Organization (WHO) Global tuberculosis report 2014. WHO Library; Geneva S:
    1. Bold TD, Ernst JD. CD4+ T cell-dependent IFN-gamma production by CD8+ effector T cells in Mycobacterium tuberculosis infection. Journal of immunology. 2012;189(5):2530–6. - PMC - PubMed
    1. Sodhi A, Gong J, Silva C, Qian D, Barnes PF. Clinical correlates of interferon gamma production in patients with tuberculosis. Clinical infectious diseases : an official publication of the Infectious Diseases Society of America. 1997;25(3):617–20. - PubMed
    1. Dorman SE, Holland SM. Interferon-gamma and interleukin-12 pathway defects and human disease. Cytokine & growth factor reviews. 2000;11(4):321–33. - PubMed
    1. Saito T. Negative regulation of T cell activation. Current opinion in immunology. 1998;10(3):313–21. - PubMed

MeSH terms