. 2017 May 23:14:20.
doi: 10.1186/s12014-017-9155-z. eCollection 2017.

Lectin array and glycogene expression analyses of ovarian cancer cell line A2780 and its cisplatin-resistant derivate cell line A2780-cp

Affiliations

Lectin array and glycogene expression analyses of ovarian cancer cell line A2780 and its cisplatin-resistant derivate cell line A2780-cp

Ran Zhao et al. Clin Proteomics. .

Abstract

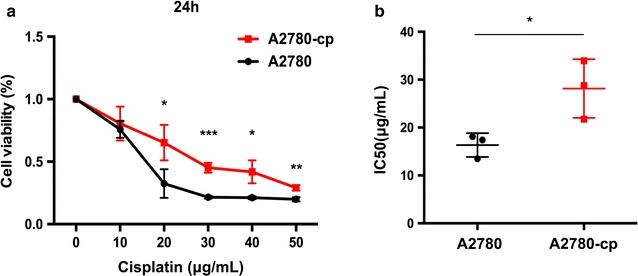
Background: Ovarian cancer is one of the most lethal gynecological malignancies, in which platinum resistance is a common cause of its relapse and death. Glycosylation has been reported to be involved in drug resistance, and glycomic analyses of ovarian cancer may improve our understanding of the mechanisms underlying cancer cell drug resistance and provide potential biomarkers and therapeutic targets.

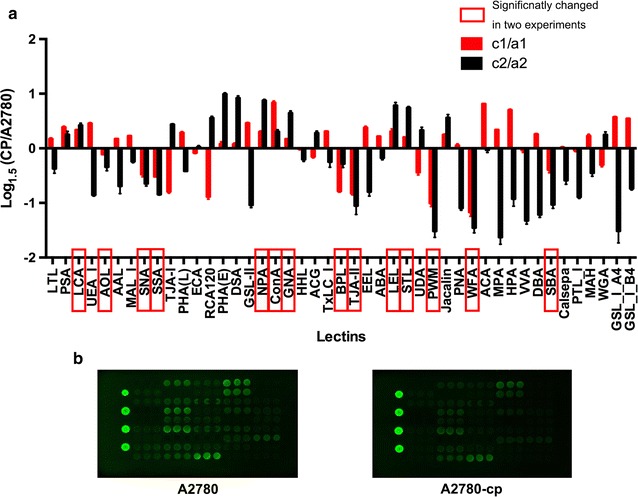
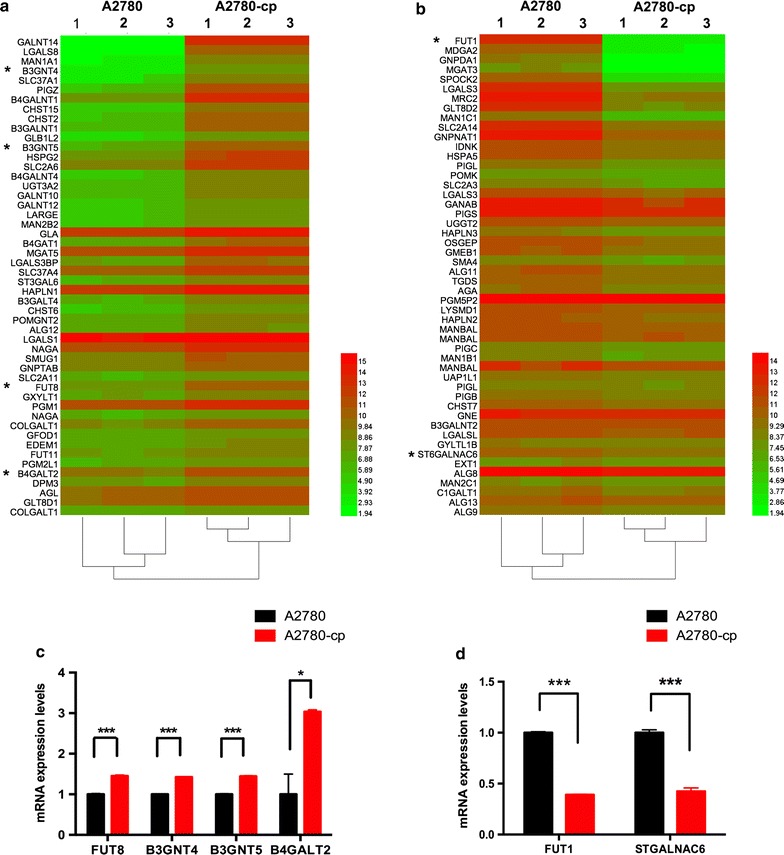
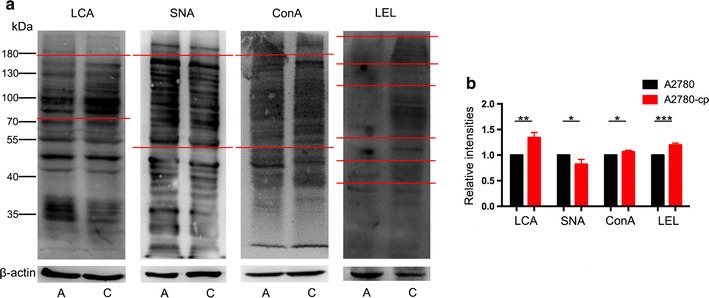
Methods: The serous ovarian cancer cell line A2780 and its platinum-resistant counterpart A2780-cp were used in this study. We performed a lectin array analysis to compare the glycosylation patterns of the two cell lines, a gene expression array was employed to probe the differences in glycogenes. Furthermore, the results were verified by lectin blots.

Results: A2780-cp cell exhibited stronger intensities of Lens culinaris (LCA) Canavalia ensiformis (ConA), and Lycopersicon esculentum (LEL) and weaker intensities of Sambucus nigra (SNA) lectins. The gene expression array analysis revealed increased expression of Fut8, B3gnt4, B3gnt5, B4galt2 and decreased expression of Fut1 and ST6GalNAc 6 expression were evident in the A2780-cp cells. The lectin blot confirmed the differences in LCA, ConA, SNA and LEL between the A2780 and A2780-cp cells.

Conclusions: The combination of the lectin and gene expression analyses showed that the levels of core fucosylation and poly-LacNAc were increased in the A2780-cp cells and the levels of Fuc α1-2(gal β1-4) GlcNAc and α2-6-linked sialic structures were decreased in the A2780-cp cells. These glycans represent potential biomarkers and might be involved in the mechanism of drug resistance in ovarian cancer.

Keywords: Drug resistance; Gene expression analysis; Glycomics; Ovarian cancer.


Figures

Fig. 1
Fig. 1
Viability of A2780 and A2780-cp cells after cisplatin incubation for 24 h determined via the CCK8 assay. a CCK8 analysis of A2780 and A2780-cp cells, error bar: standard deviation (repeat for three times); *p < 0.05; **p < 0.01; ***p < 0.001, Student’s t test; and b A2780-cp cells exhibited a significantly higher IC50
Fig. 2
Fig. 2
Lectin array analysis of A2780 cells and A2780-cp cells. a Relative intensity of 45 lectins in A2780 cells compared with that in A2780-cp cells in two experiments. Lectins that significantly changed consistently in two lectin array experiments were considered as significantly changed ones and are indicated with red rectangles. To show the results visually, the logarithm of the relative intensities (A2780-cp/A2780) to base 1.5 was calculated, and results of the first experiment are shown in the red columns and the second experiment were shown in the black columns. The upper ones were increased in A2780-cp cells, while the lower lectins were decreased. b Fluorescence intensities of A2780 cells (left) and A2780-cp cells (right), lectins in the array from up to down and then left to right are numbered from 1 to 45 in the Additional file 1
Fig. 3
Fig. 3
Heatmap of the altered glycan gene expression. a The 50 genes exhibiting the greatest increases are shown in the heat map. b The 50 genes exhibiting the greatest decreases are shown in the heatmap. *Genes showing significant changes that correlated well with the lectin array results. c, d Real-time PCR validation of expression array results
Fig. 4
Fig. 4
Lectin blot analysis of A2780 and A2780-cp cells. a LCA, SNA, Con A, LEL were used for lectin blot analysis. b Relative intensities of lectin blot. A A2780 cells, C A2780-cp cells

Similar articles

Cited by

References

    1. Siegel RL, Miller KD, Jemal A. Cancer statistics, 2016. CA Cancer J Clin. 2016;66:7–30. doi: 10.3322/caac.21332. - DOI - PubMed
    1. Partridge EE, Barnes MN. Epithelial ovarian cancer: prevention, diagnosis, and treatment. CA Cancer J Clin. 1999;49:297–320. doi: 10.3322/canjclin.49.5.297. - DOI - PubMed
    1. Lengyel E. Ovarian cancer development and metastasis. Am J Pathol. 2010;177:1053–1064. doi: 10.2353/ajpath.2010.100105. - DOI - PMC - PubMed
    1. Li J, Fadare O, Xiang L, Kong B, Zheng W. Ovarian serous carcinoma: recent concepts on its origin and carcinogenesis. J Hematol Oncol. 2012;5:8. doi: 10.1186/1756-8722-5-8. - DOI - PMC - PubMed
    1. Poveda A, Romero I. Advanced ovarian cancer: 20 years of ovarian cancer treatment. Ann Oncol. 2016;27(Suppl 1):i72–i73. doi: 10.1093/annonc/mdw081. - DOI - PubMed