. 2017:2017:7691937.
doi: 10.1155/2017/7691937. Epub 2017 May 4.

IPF-LASSO: Integrative L1-Penalized Regression with Penalty Factors for Prediction Based on Multi-Omics Data

Affiliations

IPF-LASSO: Integrative L1-Penalized Regression with Penalty Factors for Prediction Based on Multi-Omics Data

Anne-Laure Boulesteix et al. Comput Math Methods Med. 2017.

Abstract

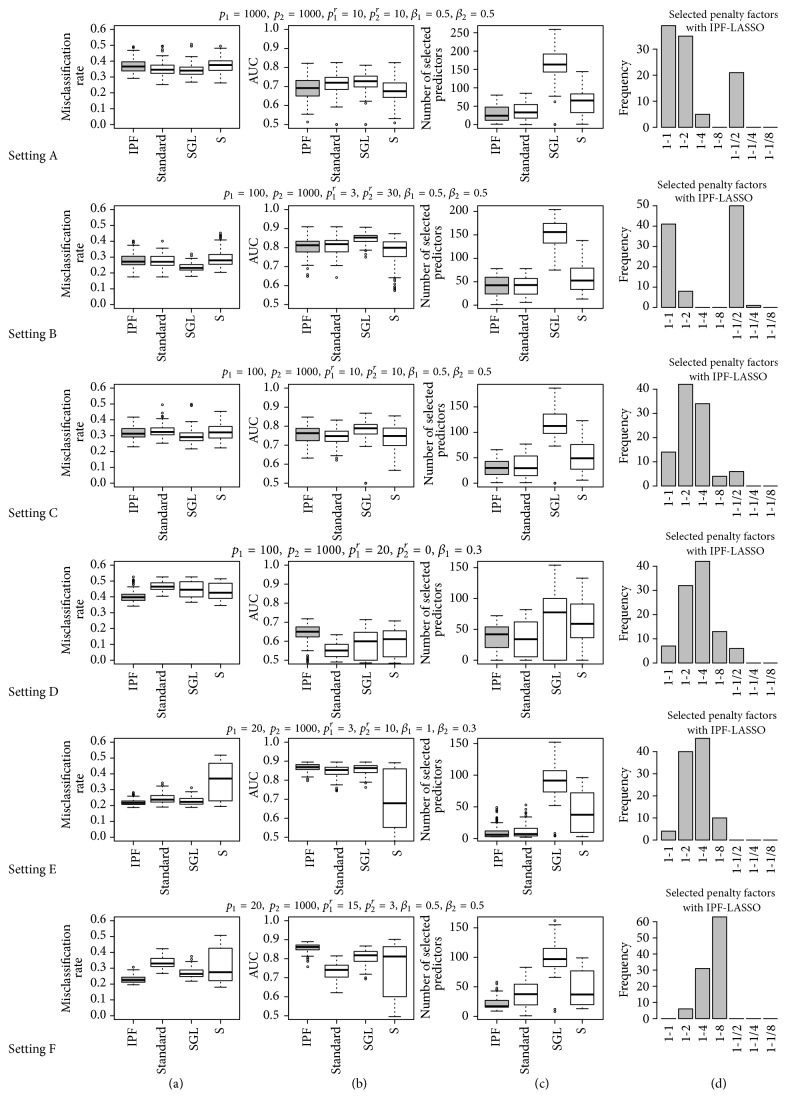
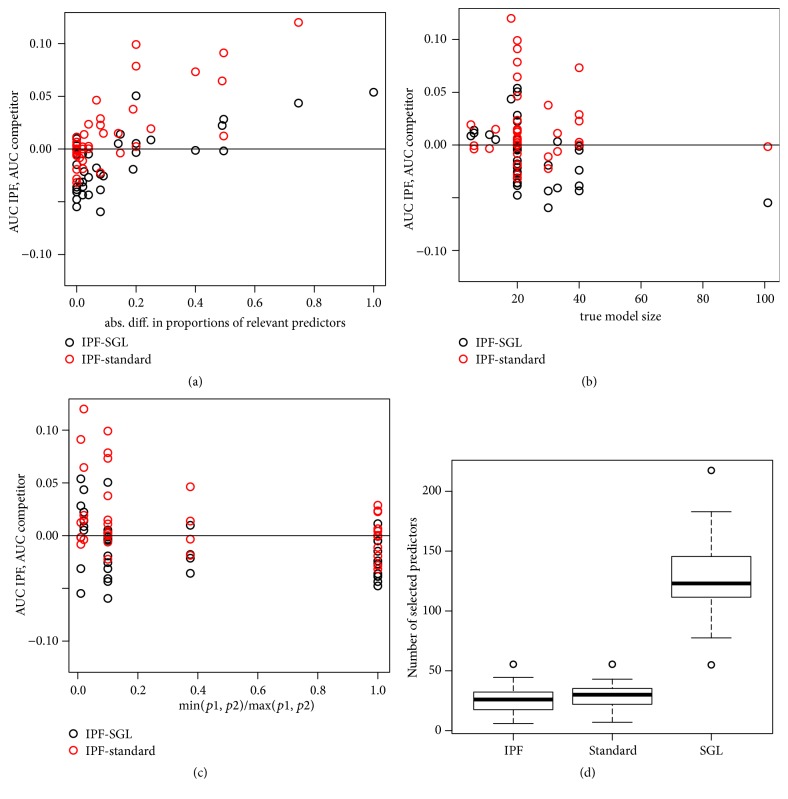
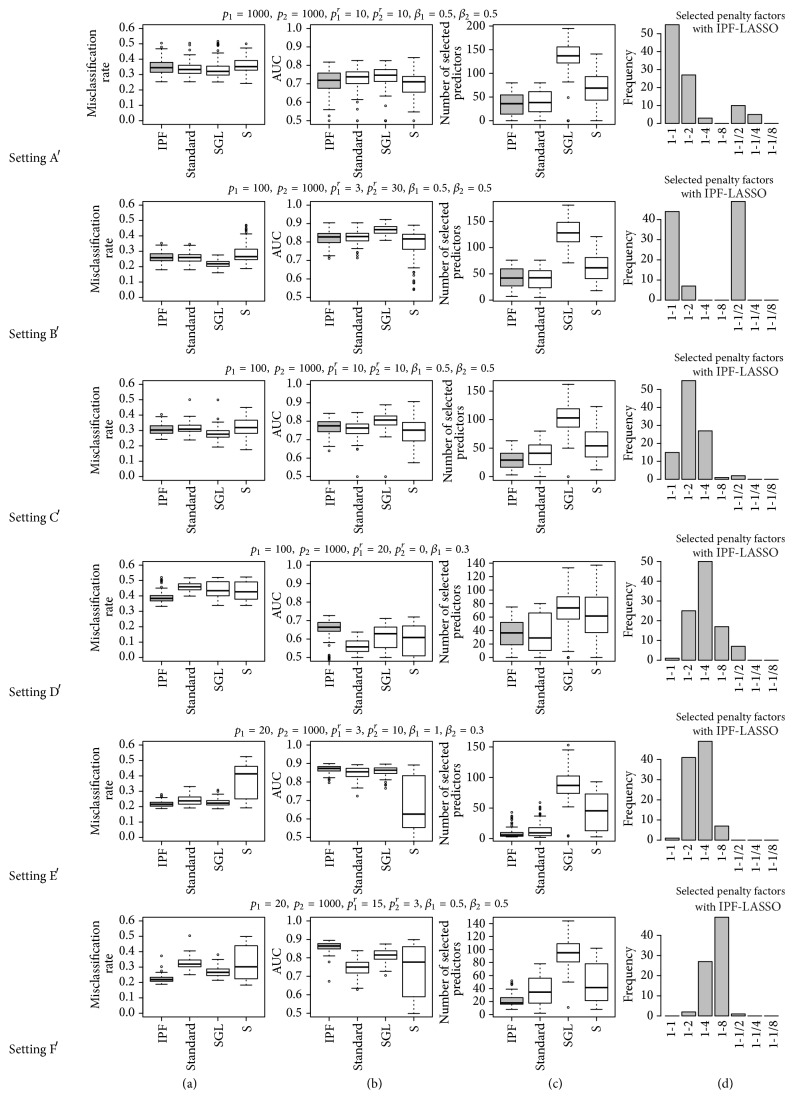
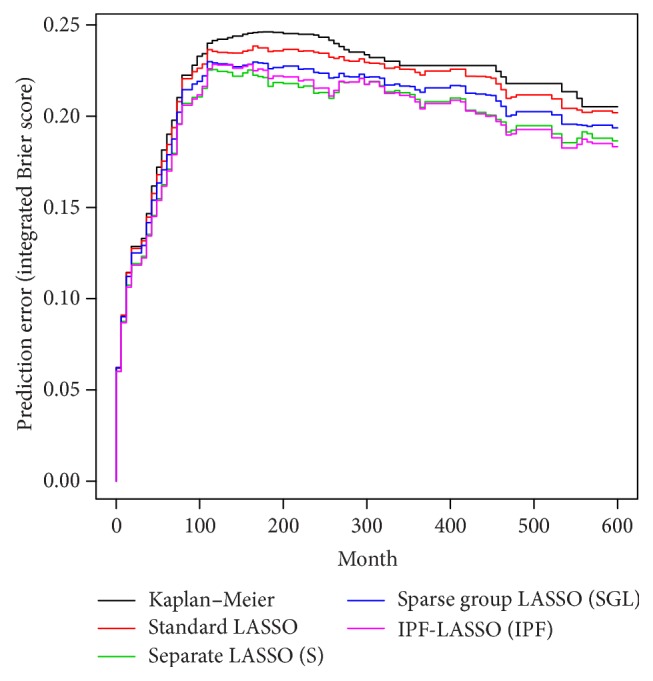
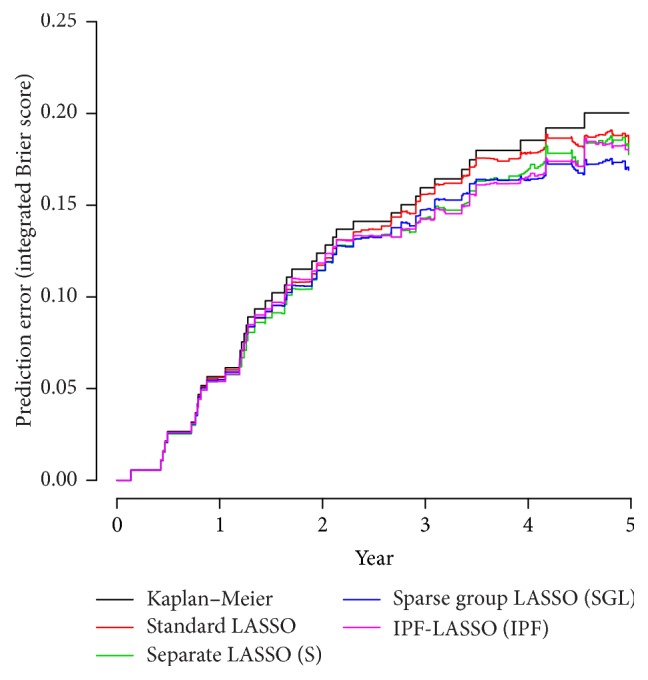
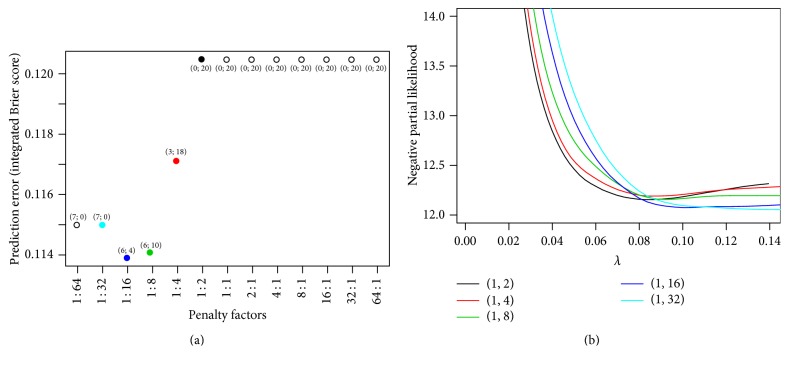
As modern biotechnologies advance, it has become increasingly frequent that different modalities of high-dimensional molecular data (termed "omics" data in this paper), such as gene expression, methylation, and copy number, are collected from the same patient cohort to predict the clinical outcome. While prediction based on omics data has been widely studied in the last fifteen years, little has been done in the statistical literature on the integration of multiple omics modalities to select a subset of variables for prediction, which is a critical task in personalized medicine. In this paper, we propose a simple penalized regression method to address this problem by assigning different penalty factors to different data modalities for feature selection and prediction. The penalty factors can be chosen in a fully data-driven fashion by cross-validation or by taking practical considerations into account. In simulation studies, we compare the prediction performance of our approach, called IPF-LASSO (Integrative LASSO with Penalty Factors) and implemented in the R package ipflasso, with the standard LASSO and sparse group LASSO. The use of IPF-LASSO is also illustrated through applications to two real-life cancer datasets. All data and codes are available on the companion website to ensure reproducibility.


Figures

Figure 1
Figure 1
Results for settings A to F: misclassification rate on test set (a), AUC on test set (b), number of selected variables (c), and penalty factors selected by IPF (d).
Figure 2
Figure 2
Panels (a), (b), and (c): difference Δ between the median AUC of IPF-LASSO and the median AUC of the standard LASSO (red points) and between the median AUC of IPF-LASSO and the median AUC of SGL (black points) against simulation parameters. A positive difference indicates better performance of IPF-LASSO. Each point on the scatterplots represents one of the 6 + 33 = 39 simulation settings. Panel (a): Δ against the absolute difference |p 1 r/p 1p 2 r/p 2| between the proportions of relevant variables in the two modalities. Panel (b): Δ against the true model size p 1 r + p 2 r. Panel (c): Δ against a measure of the relative size of the modalities: min⁡(p 1, p 2)/max⁡(p 1, p 2). Panel (d): Median number of selected variables for IPF-LASSO, standard LASSO, and SGL. Each boxplot represents the values obtained for the 33 + 6 = 39 settings.
Figure 3
Figure 3
Results for settings A′ to F′ (with correlation): misclassification rate on test set (a), AUC on test set (b), number of selected variables (c), and penalty factors selected by IPF (d).
Figure 4
Figure 4
AML data. Prediction error curves computed up to 5 years for the models obtained by standard LASSO (red line), S (green line), SGL (blue line), and IPF-LASSO (purple line). The black line represents the prediction error obtained with the null model (no variables).
Figure 5
Figure 5
Breast cancer data. Prediction error curves computed up to 6 years for the models obtained by LASSO (red line), LASSO applied separately to the three modalities (green line), sparse group LASSO (blue line), and IPF-LASSO (purple line). The black line represents the results obtained with the null model (no variables).
Figure 6
Figure 6
Breast cancer data. (a) Integrated Brier score obtained with IPF-LASSO for different choices of penalty factors. The numbers associated with the points are the numbers of selected clinical and molecular variables, respectively. For example, “(3-18)” indicates that for the penalty factors (1,4) the selected model includes 3 clinical variables and 18 molecular variables. (b) The negative partial likelihood against the parameter λ for different penalty factors. The colors of the curves are the colors of the corresponding points in (a).

References

    1. Ioannidis J. P. A. Expectations, validity, and reality in omics. Journal of Clinical Epidemiology. 2010;63(9):945–949. doi: 10.1016/j.jclinepi.2010.04.002. - DOI - PubMed
    1. Hatzis C., Pusztai L., Valero V., et al. A genomic predictor of response and survival following taxane-anthracycline chemotherapy for invasive breast cancer. JAMA. 2011;305(18):1873–1881. doi: 10.1001/jama.2011.593. - DOI - PMC - PubMed
    1. The Cancer Genome Atlas Research Network. Genomic and epigenomic landscapes of adult de novo acute myeloid leukemia. New England Journal of Medicine. 2013;368(22):2059–2074. doi: 10.1056/nejmoa1301689. - DOI - PMC - PubMed
    1. Acharjee A., Kloosterman B., Visser R. G. F., Maliepaard C. Integration of multi-omics data for prediction of phenotypic traits using random forest. BMC Bioinformatics. 2016;17(5, article 180) doi: 10.1186/s12859-016-1043-4. - DOI - PMC - PubMed
    1. Vazquez A. I., Veturi Y., Behring M., et al. Increased proportion of variance explained and prediction accuracy of survival of breast cancer patients with use of whole-genome multiomic profiles. Genetics. 2016;203(3):1425–1438. doi: 10.1534/genetics.115.185181. - DOI - PMC - PubMed

LinkOut - more resources