Review
. 2017 Jan 13;4(5):1600337.
doi: 10.1002/advs.201600337. eCollection 2017 May.

Recent Progress in Energy-Driven Water Splitting

Affiliations
Review

Recent Progress in Energy-Driven Water Splitting

Si Yin Tee et al. Adv Sci (Weinh). .

Abstract

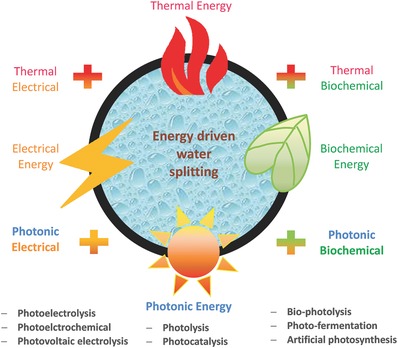
Hydrogen is readily obtained from renewable and non-renewable resources via water splitting by using thermal, electrical, photonic and biochemical energy. The major hydrogen production is generated from thermal energy through steam reforming/gasification of fossil fuel. As the commonly used non-renewable resources will be depleted in the long run, there is great demand to utilize renewable energy resources for hydrogen production. Most of the renewable resources may be used to produce electricity for driving water splitting while challenges remain to improve cost-effectiveness. As the most abundant energy resource, the direct conversion of solar energy to hydrogen is considered the most sustainable energy production method without causing pollutions to the environment. In overall, this review briefly summarizes thermolytic, electrolytic, photolytic and biolytic water splitting. It highlights photonic and electrical driven water splitting together with photovoltaic-integrated solar-driven water electrolysis.

Keywords: electrochemical water splitting; hydrogen generation; photocatalytic water splitting; photoelectrochemical water splitting; solar water splitting.


Figures

Figure 1
Figure 1
Various energy driven water splitting routes by using thermal, electrical, biochemical and photonic energy or their combinations.
Figure 2
Figure 2
Photocatalytic water splitting. A) Schematic of water splitting using semiconductor photocatalyst. B) Band structure of semiconductors and redox potentials of water splitting. Reproduced with permission.[[qv: 13a]] Copyright 2009, RSC.
Figure 3
Figure 3
d0 and d10 transition metal photocatalyst for hydrogen production.
Figure 4
Figure 4
Picture and UV‐vis absorption spectra of various transition metal‐doped TiO2 nanowires. Reproduced with permission.[[qv: 20b]] Copyright 2013, ACS.
Figure 5
Figure 5
A) Unmodified white and hydrogenated black TiO2 nanocrystals and B) spectral absorbance of the white and black TiO2 nanocrystals. Reproduced with permission.[[qv: 36a]] Copyright 2011, AAAS.
Figure 6
Figure 6
TEM images of Janus (A) and core‐shell (B) Au‐TiO2 nanostructures. C) Volume of hydrogen generated (VH2) under visible‐light irradiation from a tungsten halogen lamp using Janus and core‐shell Au‐TiO2 nanostructures, as well as amorphous TiO2 and bare gold nanoparticles (50 nm). Reproduced with permission.45
Figure 7
Figure 7
UV‐vis absorption spectrum of metal ions doped ZnS photocatalyst. Reproduced with permission.[[qv: 13a]] Copyright 2009, RSC.
Figure 8
Figure 8
Schematic illustration of the CdSe nanocrystals capped with dihydrolipoic acid (DHLA) as the light absorber and relevant energies for H2 production. dHA indicates dehydroascorbic acid. Potentials are shown versus that of an NHE at pH = 4.5. Reproduced with permission.113 Copyright 2012, AAAS.
Figure 9
Figure 9
A) TEM and B) HRTEM images of ZnS‐CuInS2 alloy nanorods. C) Schematic depiction of photocatalytic H2 production from water with a photocatalyst system based on a hybrid nanostructure that consists of a semiconductor nanorod and a metallic/conducting cocatalyst. D) Photocatalytic hydrogen production under visible‐light illumination by CuInS2 (CIS) nanorods, ZnS–CuInS2 (ZCIS) nanorods, ZCIS–Pt hybrid nanocrystals, and ZCIS–Pd4S hybrid nanocrystals from an aqueous solution containing 0.25 m Na2SO3 and 0.35 m Na2S. Reproduced with permission.[[qv: 117h]]
Figure 10
Figure 10
A) XRD pattern of Ru nanoparticles before and after annealing at temperatures from 150 to 700°C under argon atmosphere. Black vertical lines represent the hexagonal crystal phase of Ru (JCPDS file 06–0663). B) Electrocatalytic properties of the as‐synthesized Ru nanoparticles in their spin‐coated films (1 layer, 3 layers and 5 layers) at room temperature and their treated films under argon atmosphere at different temperatures including 150, 200, 250, 300, 350, 400, 450, 500, 550, 600, 650 and 700 °C. Linear sweep voltammetry experiments recorded at fluorine‐doped tin oxide glass substrate in sodium sulphate solution (0.1 M, pH 6) at a scan rate of 0.05 Vs–1. The current densities of the films were compared at 1.23 V (vs. Ag/AgCl). Reproduced with permission.125 Copyright 2015, IOPscience.
Figure 11
Figure 11
TEM images of (A) Co2P and (B) CoP nanoparticles, with enlarged regions in the insets. C) Polarization data (plots of current density vs. potential) in 0.5 M H2SO4 for Co2P/Ti and CoP/Ti electrodes, along with Pt mesh and bare Ti foil for comparison. The main plot shows an expanded region from 0 to −100 mA cm−2 and −0.5 to 0 V, while the inset shows an enlarged region from 0 to −20 mA cm−2 and −0.2 to 0 V. Reproduced with permission.[[qv: 137c]] Copyright 2015, ACS.
Figure 12
Figure 12
SEM image of the tree‐like nanoporous WO3 photoanode. Inset showing schematic illustration of charge transport/transfer processes in WO3 photoanodes. The hierarchical nanoporous WO3 photoanode has enhanced charge transport (or separation) and transfer efficiencies due to the open structure as well as partial orientation alignment. Reproduced with permission.169 Copyright 2015, RSC.
Figure 13
Figure 13
Schematic diagrams for the photovoltaic‐driven water‐splitting systems. A) Photovoltaic system and external electrolyzer. B) Photovoltaic‐integrated solar‐driven water splitting device.
Figure 14
Figure 14
A) Schematic diagram of the water‐splitting device. B) A generalized energy schematic of the perovskite tandem cell with NiFe layered double hydroxides/Ni foam electrodes for water splitting. Reproduced with permission.128 Copyright 2014, AAAS.
Figure 15
Figure 15
A) Schematic diagram of the dye‐sensitized solar cell tandem device with TiO2 nanotube arrays@CdS@CdSe composite electrode for hydrogen generation. B) J−V curves of the TiO2 nanotube arrays@CdS@CdSe composite electrode and dye‐sensitized solar cell in the two‐electrode system, C) J−t curve of the tandem cell, and D) calculated and generated amount of hydrogen gas from the tandem cell. Reproduced with permission.[[qv: 195c]] Copyright 2015, Elsevier.

Similar articles

Cited by

References

    1. Lee R., Science 2011, 333, 569. - PMC - PubMed
    1. Christopher K., Dimitrios R., Energy Environ. Sci. 2012, 5, 6640.
    1. Azwar M. Y., Hussain M. A., Abdul‐Wahab A. K., Renew. Sustainable Energy Rev. 2014, 31, 158.
    1. Steinfeld A., Sol. Energy 2005, 78, 603.
    1. Acar C., Dincer I., Int. J. Hydrogen Energy 2014, 39, 1. - PMC - PubMed