. 2017 Sep;369(3):579-590.
doi: 10.1007/s00441-017-2634-8. Epub 2017 May 26.

Time-of-day-dependent expression of purinergic receptors in mouse suprachiasmatic nucleus

Affiliations

Time-of-day-dependent expression of purinergic receptors in mouse suprachiasmatic nucleus

Julian Lommen et al. Cell Tissue Res. 2017 Sep.

Abstract

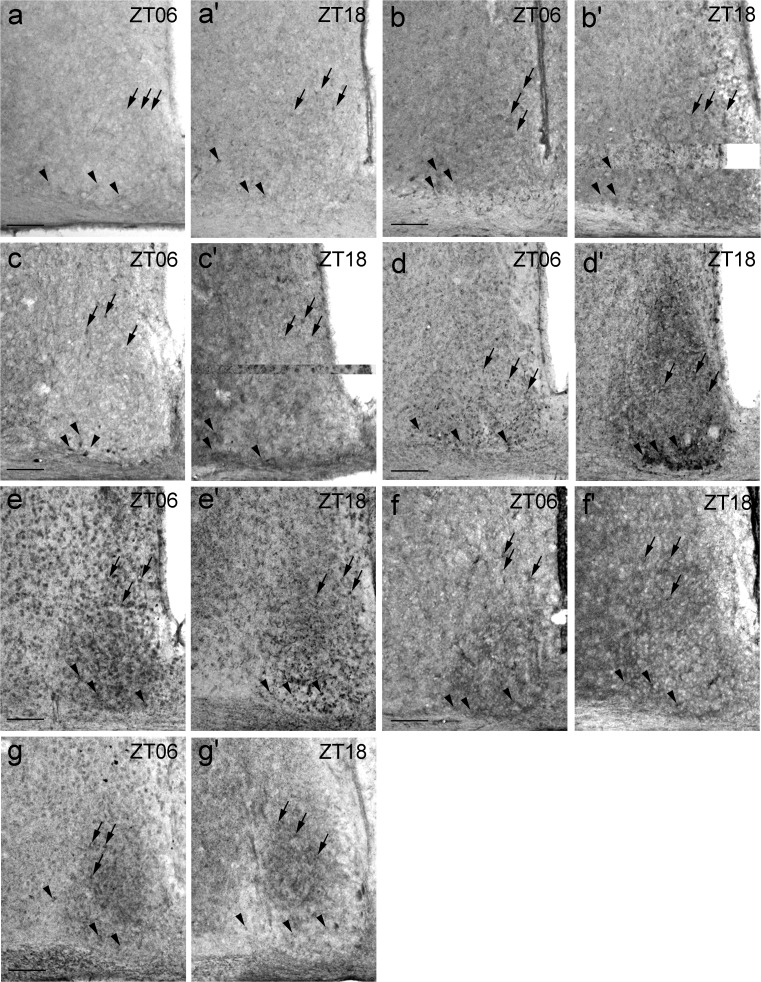
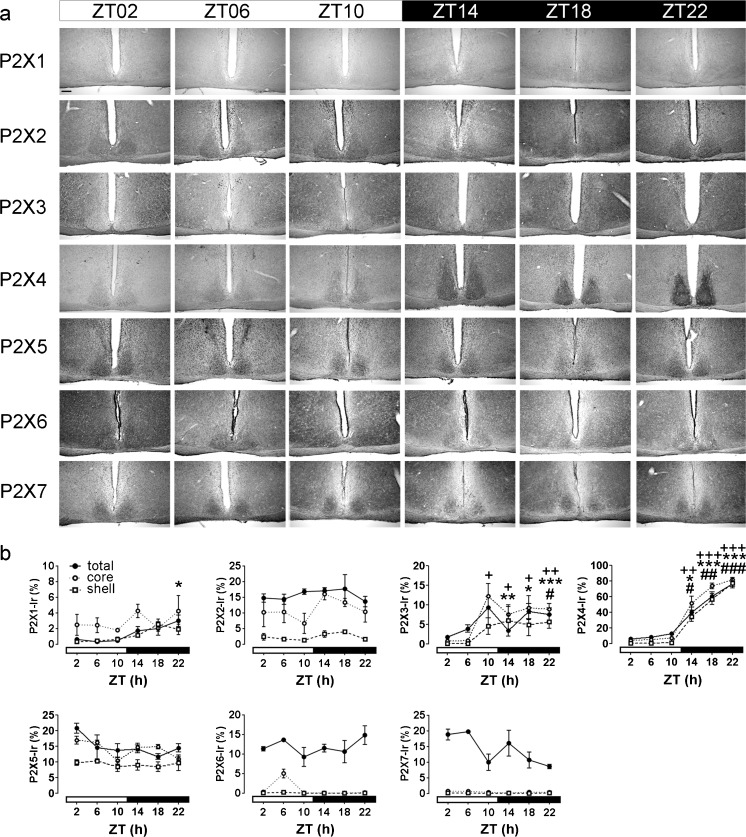
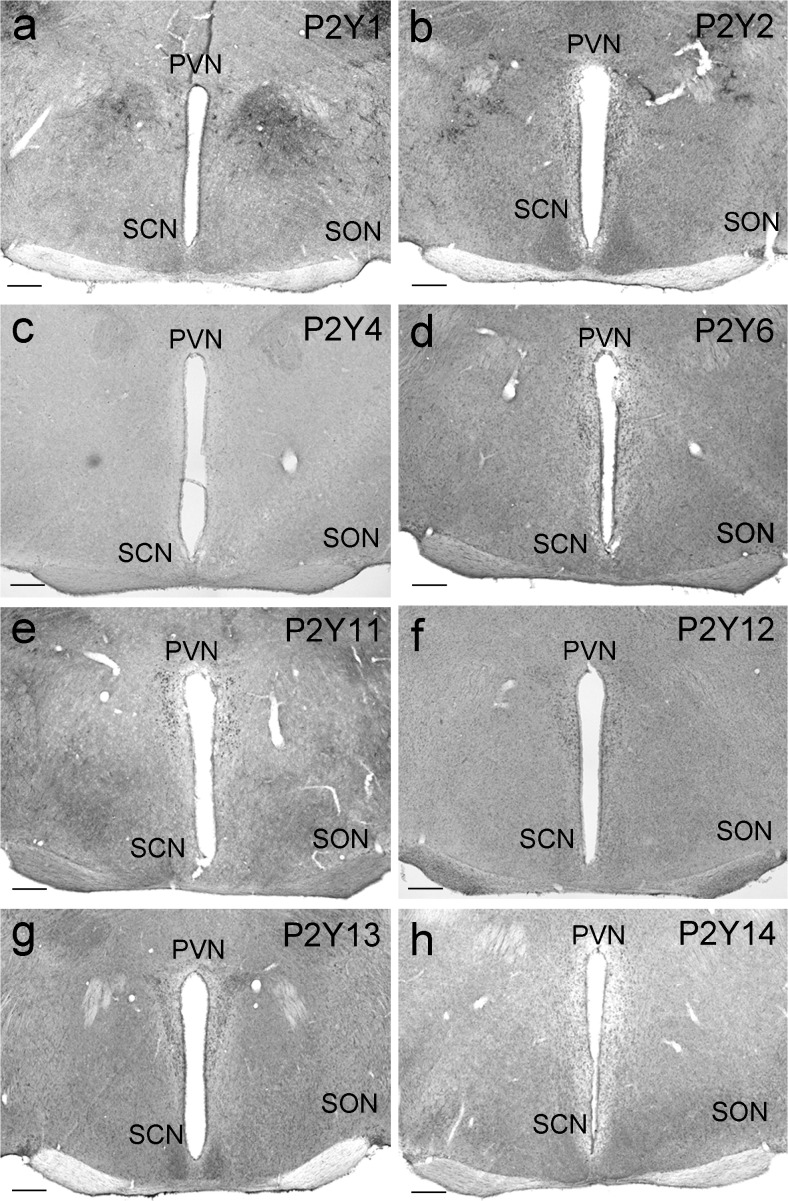
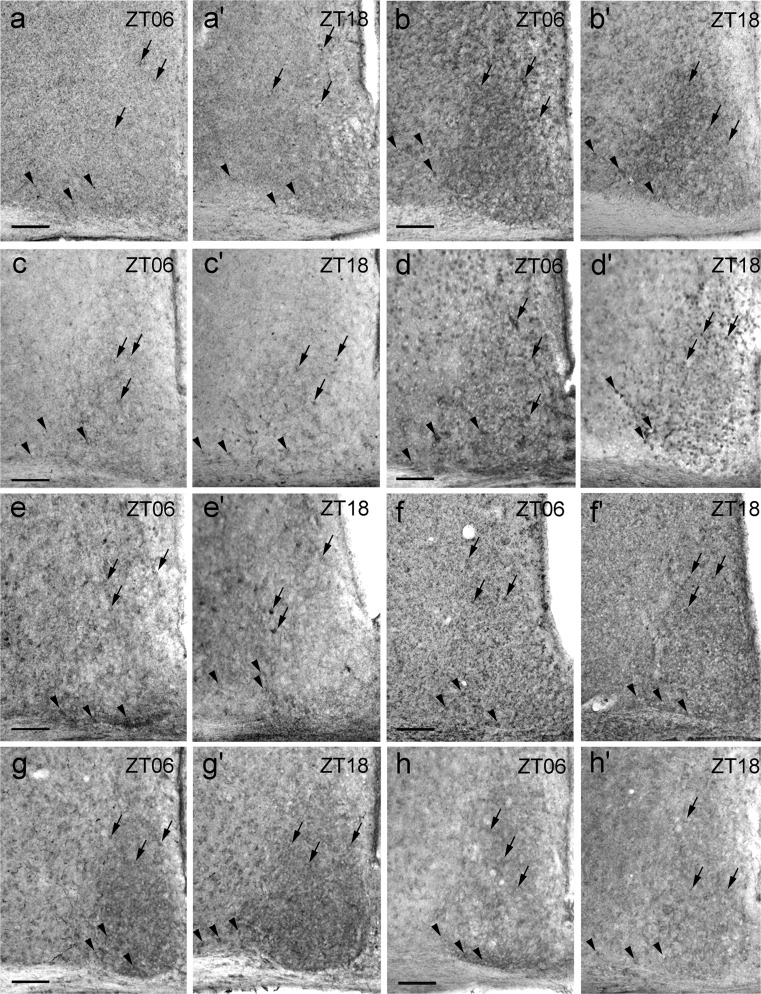
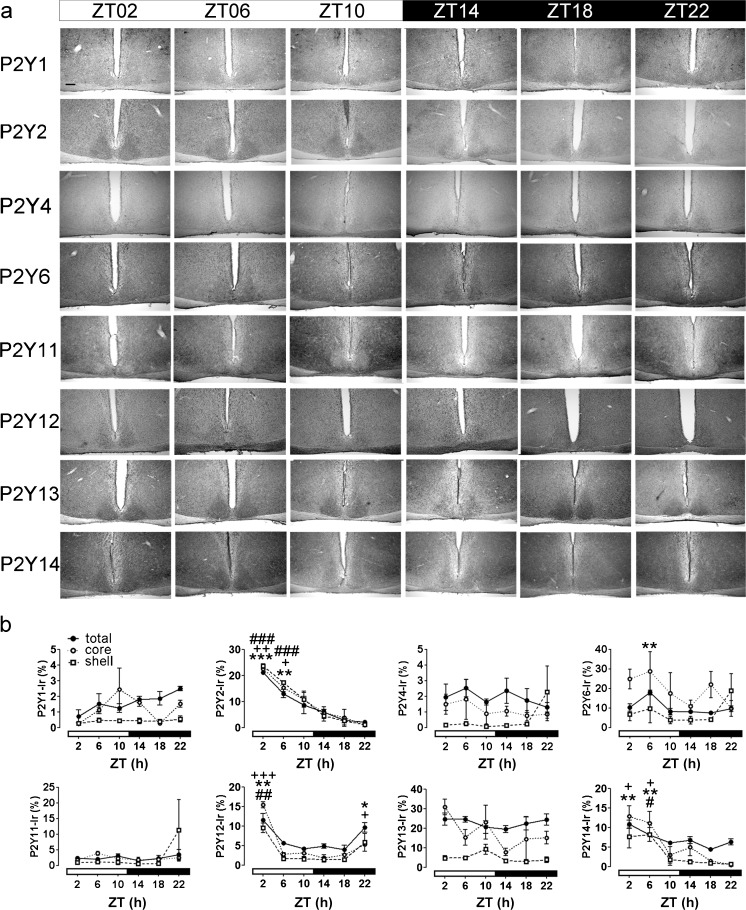
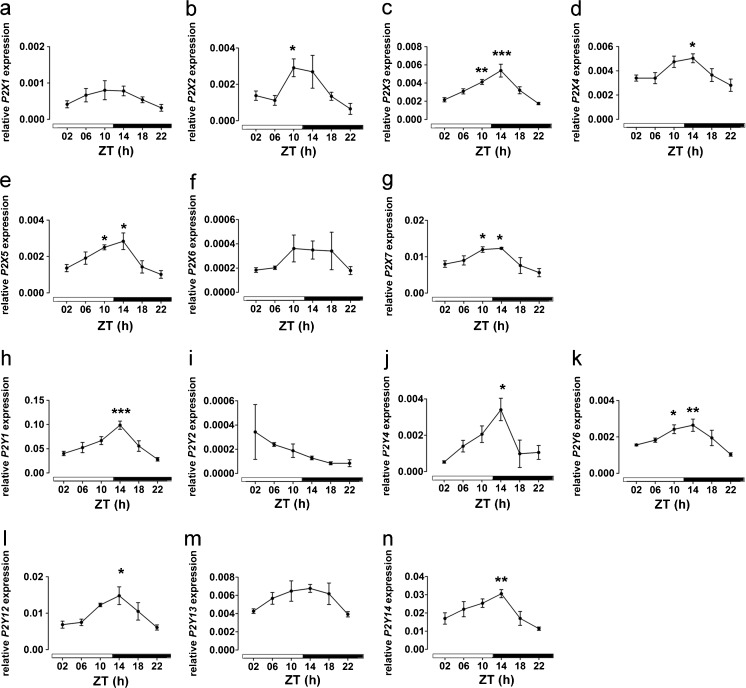
Purinergic P2X and P2Y receptors are involved in mediating intercellular signalling via purines such as adenosine triphosphate (ATP). P2X and P2Y receptors have been implicated in numerous body functions including learning, memory and sleep. All of these body functions show time-of-day-dependent variations controlled by the master circadian oscillator located in the suprachiasmatic nucleus (SCN). Evidence exists for a role of purinergic signalling in intercellular coupling within SCN. However, few studies have been performed on the expression of purinergic receptors in SCN. Therefore, we analyse the expression of seven P2X (P2X1-7) and eight P2Y (P2Y1-2, 4, 6, 11-14) receptors in mouse SCN and address their time-of-day-dependent variation by using immunohistochemistry and real-time polymerase chain reaction. At the early light phase, P2X and P2Y receptors show a low to moderate, homogenously distributed immunoreaction throughout SCN. P2Y13 reveals strong immunoreaction in fibres within the core region of SCN. From the fifteen analysed P2 receptors, seven exhibit a time-of-day-dependent variation in SCN. P2X1 immunoreaction is very low in the early light phase with a minor increase at the end of the dark phase. P2X4 immunoreaction strongly increases during the dark phase in soma cells in the core region and in a dense network of fibres in the shell region of SCN. P2X3 immunoreaction is moderately elevated during the dark phase. Conversely, immunoreaction for P2Y2, P2Y12 and P2Y14 moderately increases at the early light phase and P2Y6 immunoreaction displays a moderate increase at the mid-light phase. Thus, this study demonstrates a time-of-day-dependent variation of P2 receptors in mouse SCN.

Keywords: Circadian rhythm; P2X; P2Y; Purinergic signalling; Suprachiasmatic nucleus.


Conflict of interest statement

The authors have no conflict of interests to declare.

Figures

Fig. 1
Fig. 1
P2X immunoreactivity (Ir) in the medial hypothalamus. Animals were killed 2 h after lights on (zeitgeber time 02 [ZT02]) under a light regime of 12 h light/12 h darkness. Representative photomicrographs (PVN paraventricular nucleus of the hypothalamus, SCN suprachiasmatic nucleus, SON supraoptic nucleus). a P2X1 Ir. b P2X2 Ir. c P2X3 Ir. d P2X4 Ir. e P2X5 Ir. f P2X6 Ir. g P2X7 Ir. Bars 200 μm
Fig. 2
Fig. 2
P2X Ir in the SCN. Animals were killed 6 h after lights on (ZT06) and 6 h after lights off (ZT18) under a light regime of 12 h light/12 h darkness. Representative photomicrographs (black arrows staining in the shell [dorsomedial] region, black arrowheads staining in the core [ventrolateral] region). a, a’ P2X1 Ir. b, b’ P2X2 Ir. c, c’ P2X3 Ir. d, d’ P2X4 Ir. e, e’ P2X5 Ir. f, f’ P2X6 Ir. g, g’ P2X7 Ir. Bars 100 μm
Fig. 3
Fig. 3
Analysis of time-of-day-dependent variations in P2X Ir in the mouse SCN. Animals were killed at 4-h intervals under a light regime of 12 h light/12 h darkness (ZT00 lights on, ZT12 lights off). a Representative photomicrographs of P2X Ir. Bar 200 μm. b Quantitative analysis of P2X Ir. Data are expressed as means percent of SCN area covered by immunoreaction ± SEM for three animals per time point. The different scales should be noted; t-test, *total SCN P < 0.05, **total SCN P < 0.01, ***total SCN P < 0.001; +core region of the SCN P < 0.05, ++core region of the SCN P < 0.01, +++core region of the SCN P < 0.001, #shell region of the SCN P < 0.05, ##shell region of the SCN P < 0.01, ###shell region of the SCN P < 0.001, all compared with ZT02
Fig. 4
Fig. 4
P2Y Ir in the medial hypothalamus. Animals were killed 2 h after lights on (ZT02) under a light regime of 12 h light/12 h darkness. Representative photomicrographs (PVN paraventricular nucleus of the hypothalamus, SCN suprachiasmatic nucleus, SON supraoptic nucleus). a P2Y1 Ir. b P2Y2 Ir. c P2Y4 Ir. d P2Y6 Ir. e P2Y11 Ir. f P2Y12 Ir. g P2Y13 Ir. h P2Y14 Ir. Bars 200 μm
Fig. 5
Fig. 5
P2Y Ir in the SCN. Animals were killed 6 h after lights on (ZT06) and 6 h after lights off (ZT18) under a light regime of 12 h light/12 h darkness. Representative photomicrographs (black arrows staining in the shell [dorsomedial] region, black arrowheads staining in the core [ventrolateral] region). a, a’ P2Y1 Ir. b, b’ P2Y2 Ir. c, c’ P2Y4 Ir. d, d’ P2Y6 Ir. e, e’ P2Y11 Ir. f, f’ P2Y12 Ir. g, g’ P2Y13 Ir. h, h’ P2Y14 Ir. Bars 100 μm
Fig. 6
Fig. 6
Analysis of time-of-day-dependent variations in P2Y Ir in the mouse SCN. Animals were killed at 4-h intervals under a light regime of 12 h light/12 h darkness (ZT00 = lights on; ZT12 = lights off). a Representative photomicrographs of P2Y Ir. Bar 200 μm. b Quantitative analysis of P2Y Ir. Data are expressed as means percent of SCN area covered by immunoreaction ± SEM for three animals per time point. The different scales should be noted; t-test, *total SCN P < 0.05, **total SCN P < 0.01, ***total SCN P < 0.001; +core region of the SCN P < 0.05, ++core region of the SCN P < 0.01, +++core region of the SCN P < 0.001, #shell region of the SCN P < 0.05, ##shell region of the SCN P < 0.01, ###shell region of the SCN P < 0.001, all compared with ZT18
Fig. 7
Fig. 7
Analysis of time-of-day-dependent variations in P2X and P2Y gene expression in the mouse SCN. Animals were killed at 4-h intervals under a light regime of 12 h light/12 h darkness (ZT00 = lights on; ZT12 = lights off). a Relative P2X1 mRNA expression profile. b Relative P2X2 mRNA expression profile. c Relative P2X3 mRNA expression profile. d Relative P2X4 mRNA expression profile. e Relative P2X5 mRNA expression profile. f Relative P2X6 mRNA expression profile. g Relative P2X7 mRNA expression profile. h Relative P2Y1 mRNA expression profile. i Relative P2Y2 mRNA expression profile. j Relative P2Y4 mRNA expression profile. k Relative P2Y6 mRNA expression profile. l Relative P2Y12 mRNA expression profile. m Relative P2Y13 mRNA expression profile. n Relative P2Y14 mRNA expression profile. Data are expressed as means ± SEM of three animals per time point. One-way analysis of variance, *P < 0.05, **P < 0.01, ***P < 0.001, all compared with ZT22

References

    1. Abbracchio MP, Burnstock G. Purinoceptors: are there families of P2X and P2Y purinoceptors? Pharmacol Ther. 1994;64:445–475. doi: 10.1016/0163-7258(94)00048-4. - DOI - PubMed
    1. Albus H, Vansteensel MJ, Michel S, Block GD, Meijer JH. A GABAergic mechanism is necessary for coupling dissociable ventral and dorsal regional oscillators within the circadian clock. Curr Biol. 2005;15:886–893. doi: 10.1016/j.cub.2005.03.051. - DOI - PubMed
    1. Bhattacharya A, Vavra V, Svobodova I, Bendova Z, Vereb G, Zemkova H. Potentiation of inhibitory synaptic transmission by extracellular ATP in rat suprachiasmatic nuclei. J Neurosci. 2013;33:8035. doi: 10.1523/JNEUROSCI.4682-12.2013. - DOI - PMC - PubMed
    1. Burnstock G. Purine and pyrimidine receptors. Cell Mol Life Sci. 2007;64:1471–1483. doi: 10.1007/s00018-007-6497-0. - DOI - PMC - PubMed
    1. Burnstock G. Introduction to purinergic signalling in the brain. Adv Exp Med Biol. 2013;986:1–12. doi: 10.1007/978-94-007-4719-7_1. - DOI - PubMed

Publication types

LinkOut - more resources