

PAQR3 Inhibits the Proliferation and Tumorigenesis in Esophageal Cancer Cells
- PMID: 28548040
- PMCID: PMC7841230
- DOI: 10.3727/096504016X14761384026719
PAQR3 Inhibits the Proliferation and Tumorigenesis in Esophageal Cancer Cells
Abstract
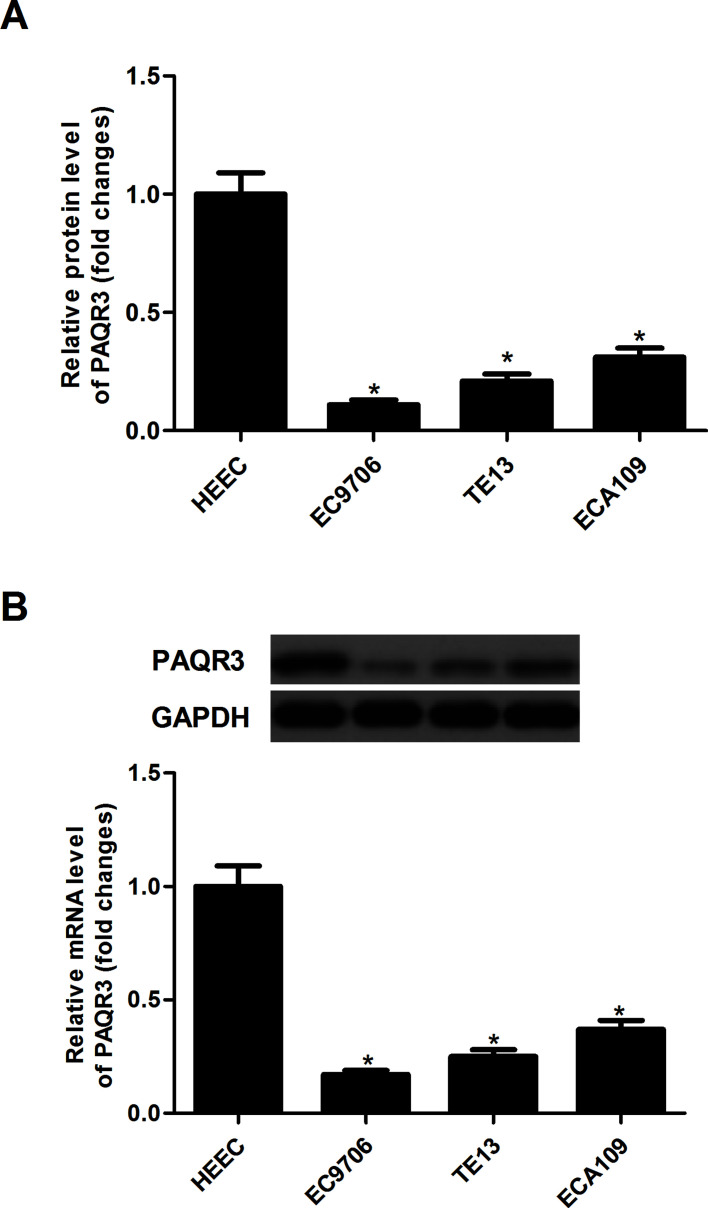
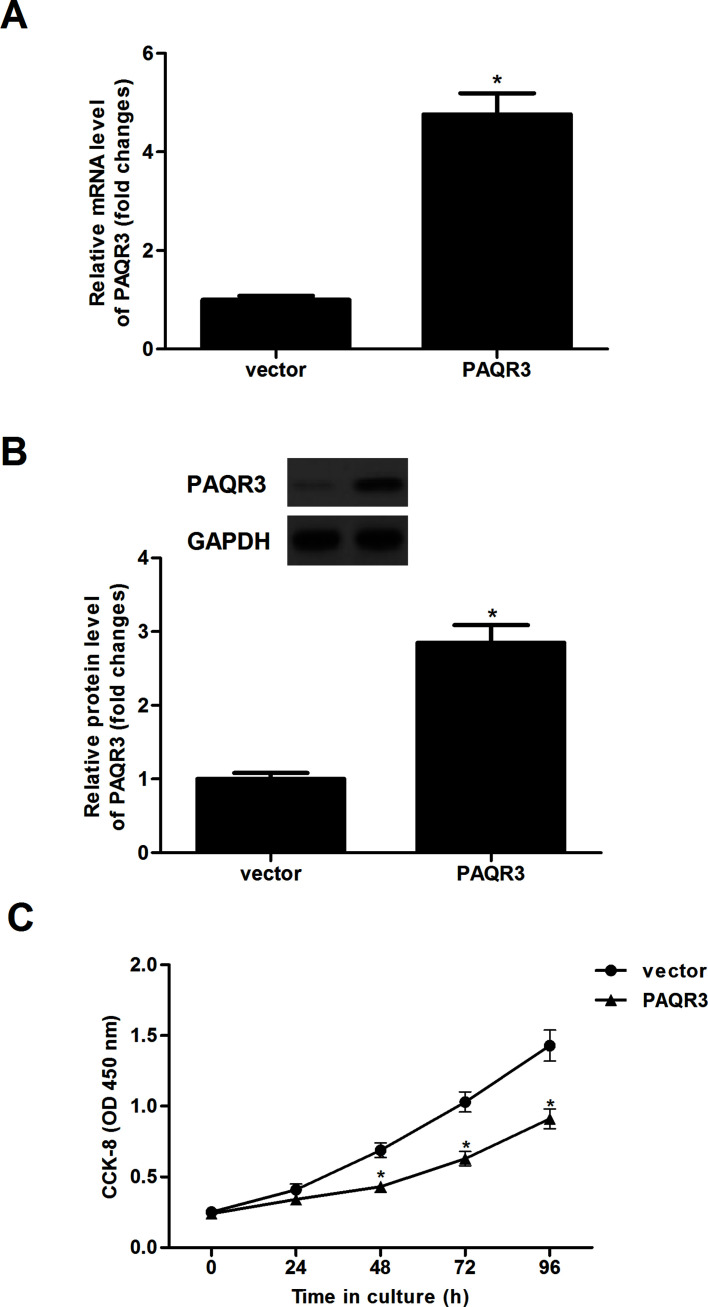
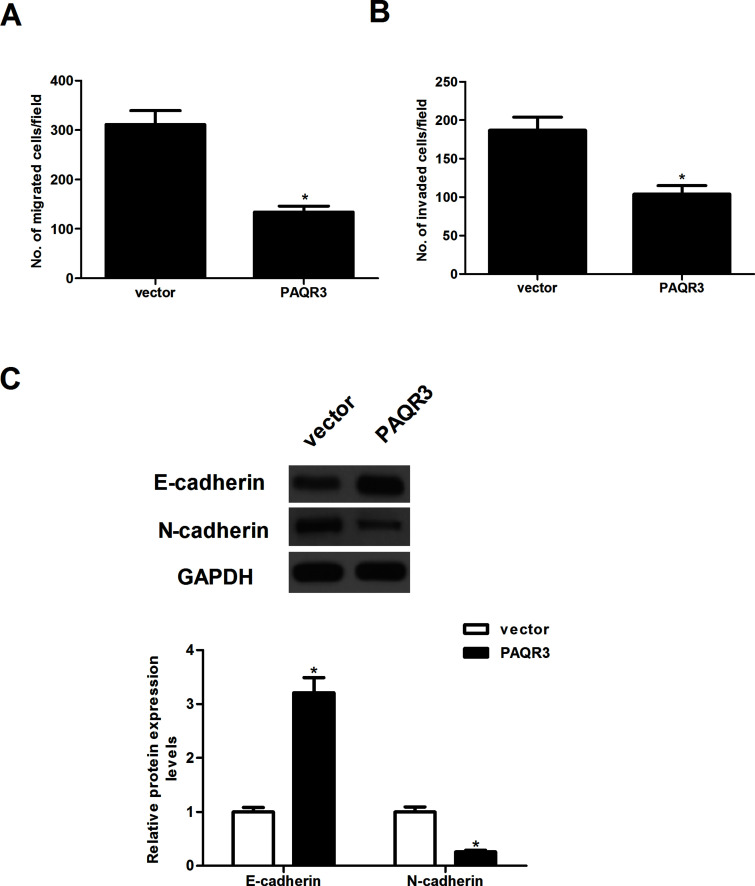
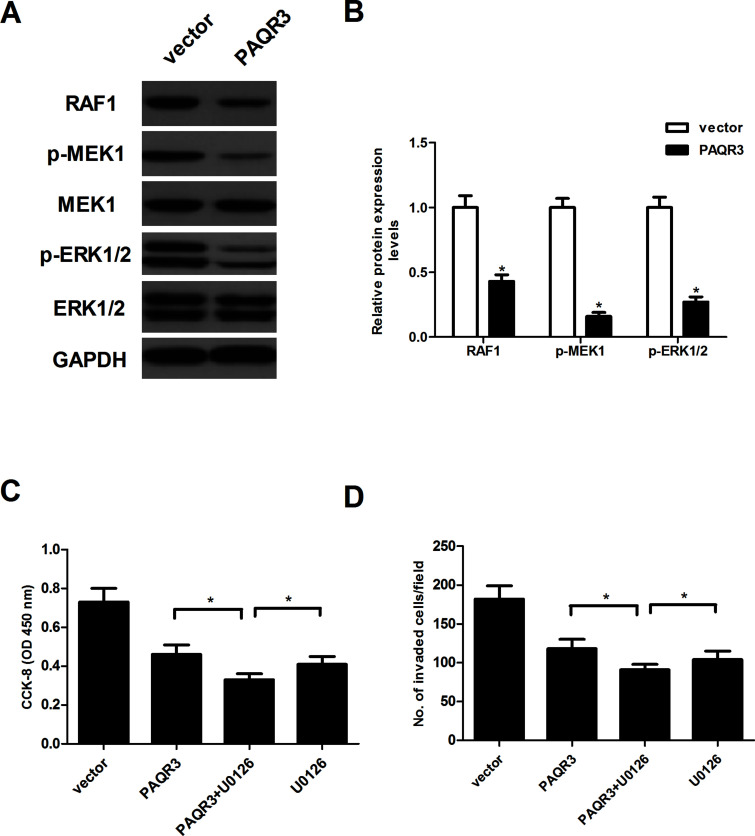
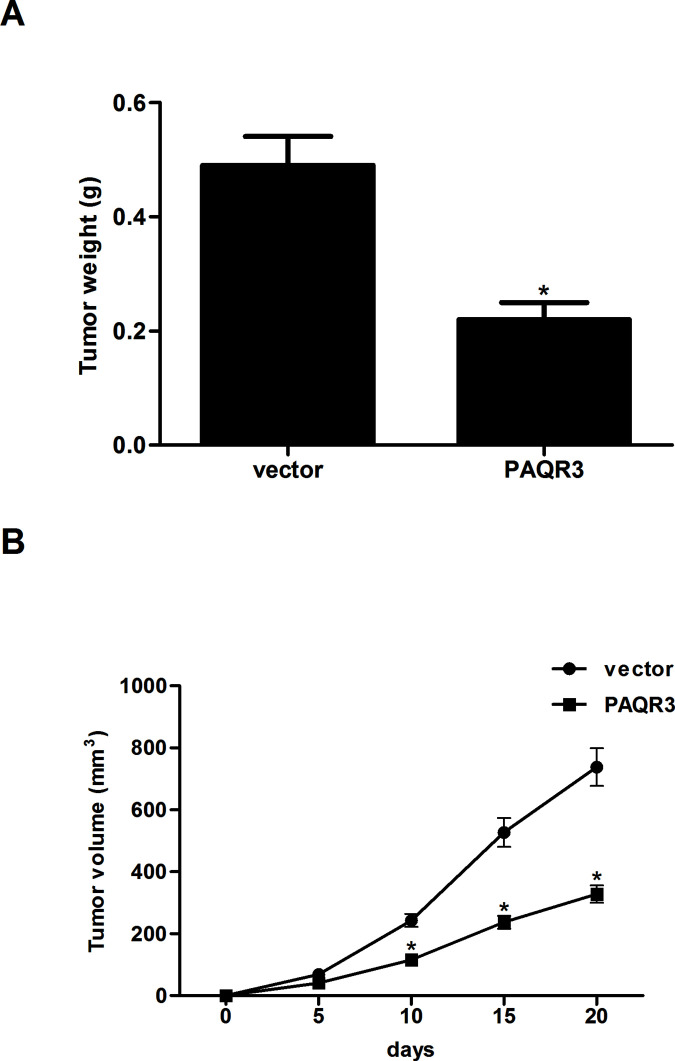
Progestin and adipoQ receptor family member III (PAQR3), a member of the PAQR family, is frequently downregulated in different types of human cancer. However, its expression and functions in esophageal cancer are still unknown. This study aimed to explore the expression of PAQR3 in esophageal cancer cell lines and to investigate the role of PAQR3 in the development of esophageal cancer. Our data showed that PAQR3 is expressed in low amounts in human esophageal cancer cell lines. Overexpression of PAQR3 significantly suppressed the proliferation, migration, and invasion of esophageal cancer cells. In addition, overexpression of PAQR3 downregulated the protein expression levels of RAF1, p-MEK1, and p-ERK1/2 in esophageal cancer cells. Furthermore, overexpression of PAQR3 attenuated the tumor growth in a tumor xenograft model. In conclusion, we demonstrated that overexpression of PAQR3 suppresses cell proliferation, migration, and invasion in esophageal cancer in vitro and in vivo. Therefore, PAQR3 may act as a therapeutic target for human esophageal cancer.
Conflict of interest statement
The authors declare no conflicts of interest.
Figures
Similar articles
-
PAQR3 overexpression suppresses the aggressive phenotype of esophageal squamous cell carcinoma cells via inhibition of ERK signaling.Biomed Pharmacother. 2017 Oct;94:813-819. doi: 10.1016/j.biopha.2017.07.154. Epub 2017 Aug 10. Biomed Pharmacother. 2017. PMID: 28802234
-
PAQR3 inhibits the proliferation, migration and invasion in human glioma cells.Biomed Pharmacother. 2017 Aug;92:24-32. doi: 10.1016/j.biopha.2017.05.046. Epub 2017 May 18. Biomed Pharmacother. 2017. PMID: 28528182
-
PAQR3 plays a suppressive role in laryngeal squamous cell carcinoma.Tumour Biol. 2016 Jan;37(1):561-5. doi: 10.1007/s13277-015-3770-y. Epub 2015 Aug 1. Tumour Biol. 2016. PMID: 26232324
-
PAQR3: a novel tumor suppressor gene.Am J Cancer Res. 2015 Aug 15;5(9):2562-8. eCollection 2015. Am J Cancer Res. 2015. PMID: 26609468 Free PMC article. Review.
-
Characterization of the Golgi scaffold protein PAQR3, and its role in tumor suppression and metabolic pathway compartmentalization.Cancer Manag Res. 2020 Jan 16;12:353-362. doi: 10.2147/CMAR.S210919. eCollection 2020. Cancer Manag Res. 2020. PMID: 32021448 Free PMC article. Review.
Cited by
-
PAQR3 Inhibits Non-small Cell Lung Cancer Growth by Regulating the NF-κB/p53/Bax Axis.Front Cell Dev Biol. 2020 Oct 6;8:581919. doi: 10.3389/fcell.2020.581919. eCollection 2020. Front Cell Dev Biol. 2020. PMID: 33123538 Free PMC article.
-
Golgi Complex: A Signaling Hub in Cancer.Cells. 2022 Jun 21;11(13):1990. doi: 10.3390/cells11131990. Cells. 2022. PMID: 35805075 Free PMC article. Review.
-
HOXA10 enhances cell proliferation and suppresses apoptosis in esophageal cancer via activating p38/ERK signaling pathway.Open Med (Wars). 2022 Nov 3;17(1):1750-1759. doi: 10.1515/med-2022-0558. eCollection 2022. Open Med (Wars). 2022. PMID: 36407869 Free PMC article.
-
Circular RNA hsa_circ_0043280 inhibits cervical cancer tumor growth and metastasis via miR-203a-3p/PAQR3 axis.Cell Death Dis. 2021 Sep 29;12(10):888. doi: 10.1038/s41419-021-04193-7. Cell Death Dis. 2021. PMID: 34588429 Free PMC article.
-
Development of a Novel Highly Spontaneous Metastatic Model of Esophageal Squamous Cell Carcinoma Using Renal Capsule Technology.Onco Targets Ther. 2021 Feb 4;14:785-793. doi: 10.2147/OTT.S290564. eCollection 2021. Onco Targets Ther. 2021. PMID: 33574674 Free PMC article.
References
-
- Holmes RS, Vaughan TL. Epidemiology and pathogenesis of esophageal cancer. Semin Radiat Oncol. 2007;17:2–9. - PubMed
-
- Jemal A, Bray F, Center MM, Ferlay J, Ward E, Forman D. Global cancer statistics. CA Cancer J Clin. 2011;61:134. - PubMed
-
- van Nistelrooij AM, van Steenbergen LN, Spaander MC, Tilanus HW, van Lanschot JJ, Lemmens VE, Wijnhoven BP. Treatment and outcome of young patients with esophageal cancer in the Netherlands. J Surg Oncol. 2014;109:561–6. - PubMed
MeSH terms
Substances
LinkOut - more resources
Full Text Sources
Other Literature Sources
Medical
Research Materials
Miscellaneous