Epithelial-Mesenchymal Transition in Metastatic Cancer Cell Populations Affects Tumor Dormancy in a Simple Mathematical Model
- PMID: 28548077
- PMCID: PMC5344274
- DOI: 10.3390/biomedicines2040384
Epithelial-Mesenchymal Transition in Metastatic Cancer Cell Populations Affects Tumor Dormancy in a Simple Mathematical Model
Abstract
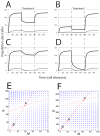
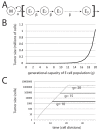
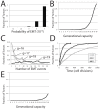
Signaling from the c-Met receptor tyrosine kinase is associated with progression and metastasis of epithelial tumors. c-Met, the receptor for hepatocyte growth factor, triggers epithelial-mesenchymal transition (EMT) of cultured cells, which is thought to drive migration of tumor cells and confer on them critical stem cell properties. Here, we employ mathematical modeling to better understand how EMT affects population dynamics in metastatic tumors. We find that without intervention, micrometastatic tumors reach a steady-state population. While the rates of proliferation, senescence and death only have subtle effects on the steady state, changes in the frequency of EMT dramatically alter population dynamics towards exponential growth. We also find that therapies targeting cell proliferation or cell death are markedly more successful when combined with one that prevents EMT, though such therapies do little when used alone. Stochastic modeling reveals the probability of tumor recurrence from small numbers of residual differentiated tumor cells. EMT events in metastatic tumors provide a plausible mechanism by which clinically detectable tumors can arise from dormant micrometastatic tumors. Modeling the dynamics of this process demonstrates the benefit of a treatment that eradicates tumor cells and reduces the rate of EMT simultaneously.
Keywords: cancer growth; chemotherapy; mathematical modeling; metastasis.
Conflict of interest statement
The authors declare no conflict of interest.
Figures


Similar articles
-
Esophageal Adenocarcinoma Cells and Xenograft Tumors Exposed to Erb-b2 Receptor Tyrosine Kinase 2 and 3 Inhibitors Activate Transforming Growth Factor Beta Signaling, Which Induces Epithelial to Mesenchymal Transition.Gastroenterology. 2017 Jul;153(1):63-76.e14. doi: 10.1053/j.gastro.2017.03.004. Epub 2017 Mar 9. Gastroenterology. 2017. PMID: 28286209
-
Activation of anaphase-promoting complex by p53 induces a state of dormancy in cancer cells against chemotherapeutic stress.Oncotarget. 2016 May 3;7(18):25478-92. doi: 10.18632/oncotarget.8172. Oncotarget. 2016. PMID: 27009858 Free PMC article.
-
Molecular Pathways Mediating Metastases to the Brain via Epithelial-to-Mesenchymal Transition: Genes, Proteins, and Functional Analysis.Anticancer Res. 2016 Feb;36(2):523-32. Anticancer Res. 2016. PMID: 26851006
-
Epithelial Mesenchymal Transition in Aggressive Lung Cancers.Adv Exp Med Biol. 2016;890:37-56. doi: 10.1007/978-3-319-24932-2_3. Adv Exp Med Biol. 2016. PMID: 26703798 Review.
-
Tumor dormancy: EMT beyond invasion and metastasis.Genesis. 2024 Feb;62(1):e23552. doi: 10.1002/dvg.23552. Epub 2023 Sep 30. Genesis. 2024. PMID: 37776086 Review.
Cited by
-
Cellular Phenotype Plasticity in Cancer Dormancy and Metastasis.Front Oncol. 2018 Nov 5;8:505. doi: 10.3389/fonc.2018.00505. eCollection 2018. Front Oncol. 2018. PMID: 30456206 Free PMC article. Review.
-
Exploring the role of EMT in ovarian cancer progression using a multiscale mathematical model.NPJ Syst Biol Appl. 2025 Apr 17;11(1):36. doi: 10.1038/s41540-025-00508-y. NPJ Syst Biol Appl. 2025. PMID: 40246908 Free PMC article.
References
-
- Fiala S. The cancer cell as a stem cell unable to differentiate. A theory of carcinogenesis. Neoplasma. 1968;15:607–622. - PubMed
LinkOut - more resources
Full Text Sources
Other Literature Sources
Miscellaneous

