. 2017 May 26:8:15606.
doi: 10.1038/ncomms15606.

Whole genome sequencing and imputation in isolated populations identify genetic associations with medically-relevant complex traits

Affiliations

Whole genome sequencing and imputation in isolated populations identify genetic associations with medically-relevant complex traits

Lorraine Southam et al. Nat Commun. .

Abstract

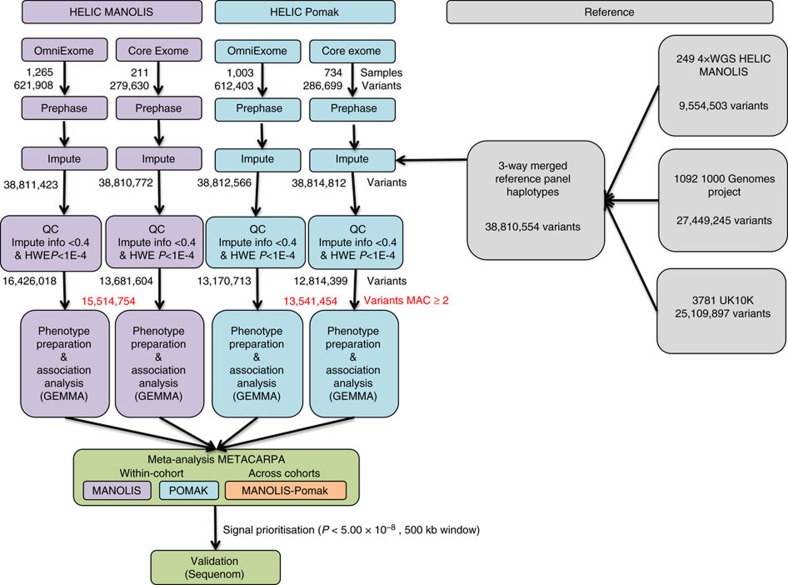
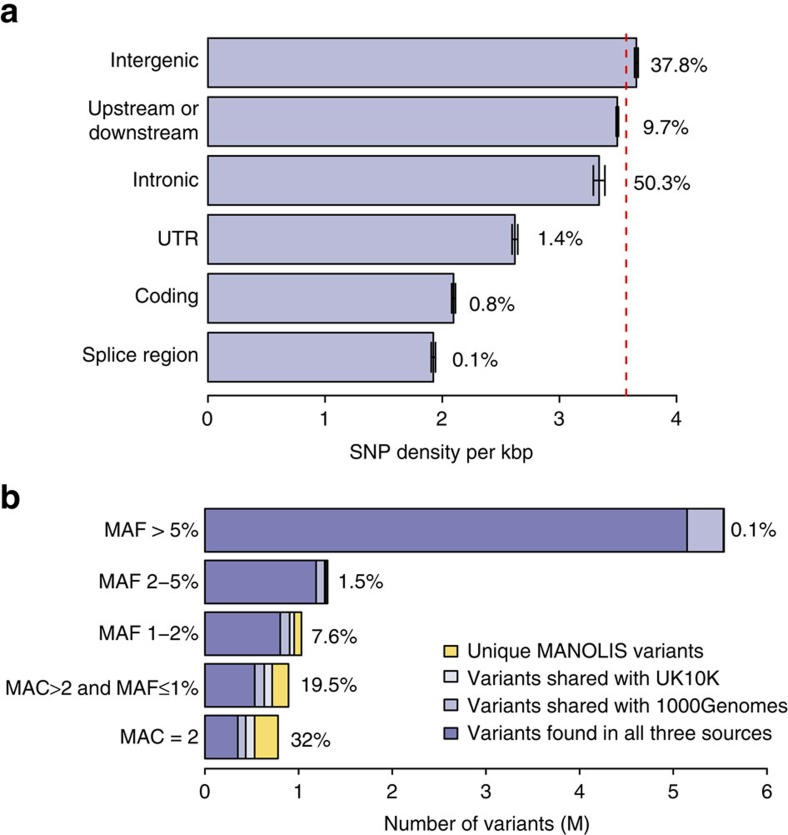
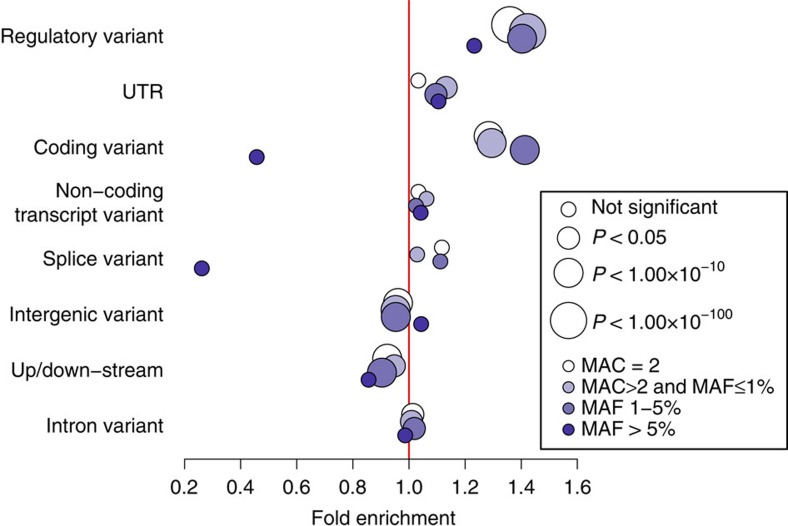
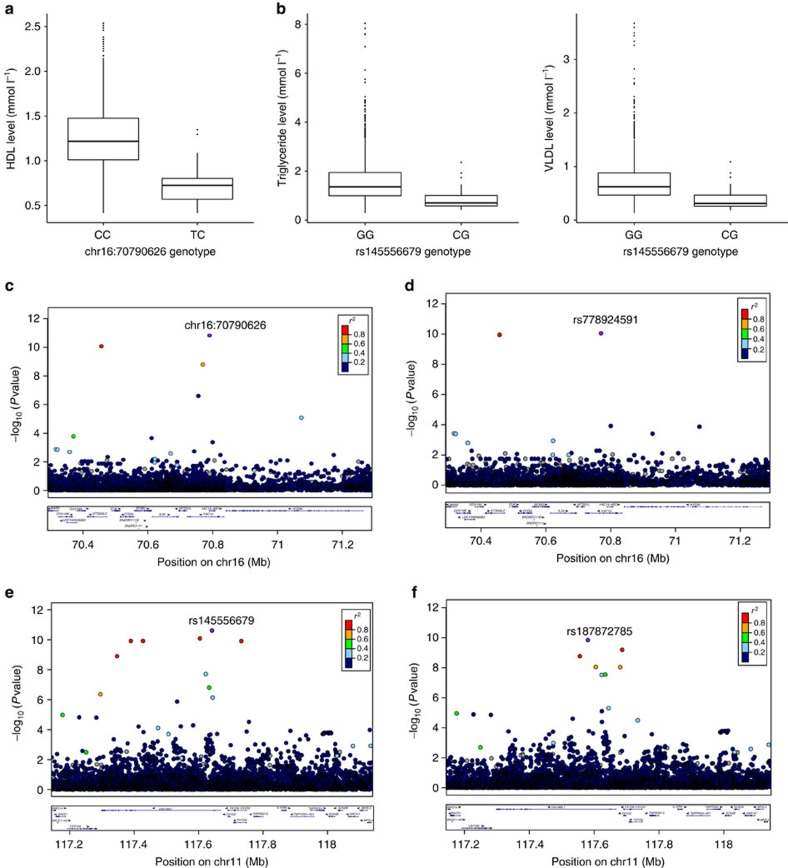
Next-generation association studies can be empowered by sequence-based imputation and by studying founder populations. Here we report ∼9.5 million variants from whole-genome sequencing (WGS) of a Cretan-isolated population, and show enrichment of rare and low-frequency variants with predicted functional consequences. We use a WGS-based imputation approach utilizing 10,422 reference haplotypes to perform genome-wide association analyses and observe 17 genome-wide significant, independent signals, including replicating evidence for association at eight novel low-frequency variant signals. Two novel cardiometabolic associations are at lead variants unique to the founder population sequences: chr16:70790626 (high-density lipoprotein levels beta -1.71 (SE 0.25), P=1.57 × 10⁻¹¹, effect allele frequency (EAF) 0.006); and rs145556679 (triglycerides levels beta -1.13 (SE 0.17), P=2.53 × 10⁻¹¹, EAF 0.013). Our findings add empirical support to the contribution of low-frequency variants in complex traits, demonstrate the advantage of including population-specific sequences in imputation panels and exemplify the power gains afforded by population isolates.


Conflict of interest statement

The authors declare no competing financial interests.

Figures

Figure 1
Figure 1. Flowchart of study design.
The HELIC cohorts were prephased, imputed and analysed separately by cohort and array, and finally meta-analysed. The variant numbers reported here are total regardless of MAF. Imputed variants are for chromosomes 1–22.
Figure 2
Figure 2. Variant sharing and functional annotation.
(a) SNP density per kbp and percentage of total per functional class, based on 9,554,503 variants identified in the HELIC MANOLIS 4 × WGS data of 249 samples (MAC≥2). Error bars indicate standard error of the mean; the dashed red line indicates average density genome-wide. (b) Variant overlap between 498 HELIC MANOLIS, 7,582 UK10K and 2,184 1000 Genomes Project reference panel haplotypes, by MAF category. Numerical values are given in Supplementary Tables 1 and 2.
Figure 3
Figure 3. Functional enrichment of variants private to the MANOLIS sequences when compared to variants shared with UK10K and/or 1000 Genomes.
Enrichment and depletion of functional classes of variants private to the MANOLIS cohort can be observed in the rare and low-frequency (MAF≤5%), while no significant enrichment is detected in common-frequency variants in any functional class. Numerical values are listed in Supplementary Table 4.
Figure 4
Figure 4. False-positive rate and meta-analysis power in the presence of sample overlap using METACARPA.
(a) Empirical false-positive rate as a function of sample overlap in 1,000 repeats of a meta-analysis of two studies including 2,000 samples each, at a significance threshold of 5 × 10⁻⁸. (b) Empirical power of the four tests implemented in METACARPA as a function of sample overlap in the same simulation setting. Power is calculated as the discovery rate of a SNP explaining 1% of a standard normal phenotype under the same simulation scenario (for example, a MAF of 1% and an effect size of 0.705, or a MAF of 20% and an effect size of 0.176). (c) Compared accuracy of Digby's estimate of tetrachoric correlation and Pearson's correlation for a true (dashed line) 25% overlap under a polygenic burden, with 10,000 SNPs affecting a quantitative trait with 20% heritability. Estimates of correlation for both methods are calculated over 300 genome-wide simulations. The black line indicates the median, shaded rectangles represent the interquintile ranges.
Figure 5
Figure 5. Association results for chr16:70790626 and rs145556679 and lipid levels.
(a) Heterozygotes for chr16:70790626 exhibit significantly lower HDL levels than homozygotes (Wald test METACARPA P=1.57 × 10⁻¹¹). (b) Heterozygotes for rs145556679 exhibit significantly lower TG (Wald test METACARPA P=2.53 × 10⁻¹¹) and VLDL (Wald test METACARPA P=2.90 × 10⁻¹¹) levels than homozygotes. (c) Regional association plot for chr16:70790626. (d) To determine if the signals are detected without MANOLIS sequences in the reference panel, we conducted imputation using a combined UK10K+1000 Genomes reference panel; the regional plot shows that the chr16:70790626 signal is captured with a different lead variant and a decrease in significance. (e) Regional association plot for rs145556679. (f) Regional association plot for rs145556679 using a combined UK10K+1000 Genomes reference panel; the same signal is captured with a different lead variant and a decrease in association strength. LocusZoom was used to create the regional plots (http://csg.sph.umich.edu/locuszoom/).

Similar articles

Cited by

  • Genetic Epidemiology of Complex Phenotypes.
    O'Rielly DD, Rahman P. O'Rielly DD, et al. Methods Mol Biol. 2021;2249:335-367. doi: 10.1007/978-1-0716-1138-8_19. Methods Mol Biol. 2021. PMID: 33871853 Review.
  • AMPK activation negatively regulates GDAP1, which influences metabolic processes and circadian gene expression in skeletal muscle.
    Lassiter DG, Sjögren RJO, Gabriel BM, Krook A, Zierath JR. Lassiter DG, et al. Mol Metab. 2018 Oct;16:12-23. doi: 10.1016/j.molmet.2018.07.004. Epub 2018 Jul 25. Mol Metab. 2018. PMID: 30093355 Free PMC article.
  • Whole-genome sequencing analysis of the cardiometabolic proteome.
    Gilly A, Park YC, Png G, Barysenka A, Fischer I, Bjørnland T, Southam L, Suveges D, Neumeyer S, Rayner NW, Tsafantakis E, Karaleftheri M, Dedoussis G, Zeggini E. Gilly A, et al. Nat Commun. 2020 Dec 10;11(1):6336. doi: 10.1038/s41467-020-20079-2. Nat Commun. 2020. PMID: 33303764 Free PMC article.
  • Carotid Intima-Media Thickness: Novel Loci, Sex-Specific Effects, and Genetic Correlations With Obesity and Glucometabolic Traits in UK Biobank.
    Strawbridge RJ, Ward J, Bailey MES, Cullen B, Ferguson A, Graham N, Johnston KJA, Lyall LM, Pearsall R, Pell J, Shaw RJ, Tank R, Lyall DM, Smith DJ. Strawbridge RJ, et al. Arterioscler Thromb Vasc Biol. 2020 Feb;40(2):446-461. doi: 10.1161/ATVBAHA.119.313226. Epub 2019 Dec 5. Arterioscler Thromb Vasc Biol. 2020. PMID: 31801372 Free PMC article.
  • Large-scale cross-cancer fine-mapping of the 5p15.33 region reveals multiple independent signals.
    Chen H, Majumdar A, Wang L, Kar S, Brown KM, Feng H, Turman C, Dennis J, Easton D, Michailidou K, Simard J; Breast Cancer Association Consortium (BCAC); Bishop T, Cheng IC, Huyghe JR, Schmit SL; Colorectal Transdisciplinary Study (CORECT); Colon Cancer Family Registry Study (CCFR); Genetics and Epidemiology of Colorectal Cancer Consortium (GECCO); O'Mara TA, Spurdle AB; Endometrial Cancer Association Consortium (ECAC); Gharahkhani P, Schumacher J, Jankowski J, Gockel I; Esophageal Cancer GWAS Consortium; Bondy ML, Houlston RS, Jenkins RB, Melin B; Glioma International Case Control Consortium (GICC); Lesseur C, Ness AR, Diergaarde B, Olshan AF; Head-Neck Cancer GWAS Consortium; Amos CI, Christiani DC, Landi MT, McKay JD; International Lung Cancer Consortium (ILCCO); Brossard M, Iles MM, Law MH, MacGregor S; Melanoma GWAS Consortium; Beesley J, Jones MR, Tyrer J, Winham SJ; Ovarian Cancer Association Consortium (OCAC); Klein AP, Petersen G, Li D, Wolpin BM; Pancreatic Cancer Case-Control Consortium (PANC4); Pancreatic Cancer Cohort Consortium (PanScan); Eeles RA, Haiman CA, Kote-Jarai Z, Schumacher FR; PRACTICAL consortium; CRUK; BPC3; CAPS; PEGASUS; Brennan P, Chanock SJ, Gaborieau… See abstract for full author list ➔ Chen H, et al. HGG Adv. 2021 Jul 8;2(3):100041. doi: 10.1016/j.xhgg.2021.100041. Epub 2021 Jun 12. HGG Adv. 2021. PMID: 34355204 Free PMC article.

References

    1. Walter K. et al. The UK10K project identifies rare variants in health and disease. Nature 526, 82–90 (2015). - PMC - PubMed
    1. Huang J. et al. Improved imputation of low-frequency and rare variants using the UK10K haplotype reference panel. Nat. Commun. 6, 8111 (2015). - PMC - PubMed
    1. Abecasis G. R. et al. A map of human genome variation from population-scale sequencing. Nature 467, 1061–1073 (2010). - PMC - PubMed
    1. Gudbjartsson D. F. et al. Large-scale whole-genome sequencing of the Icelandic population. Nat. Genet. 47, 435–444 (2015). - PubMed
    1. Sidore C. et al. Genome sequencing elucidates Sardinian genetic architecture and augments association analyses for lipid and blood inflammatory markers. Nat. Genet. 47, 1272–1281 (2015). - PMC - PubMed

Publication types

LinkOut - more resources