

Solid-state ensemble of highly entangled photon sources at rubidium atomic transitions
- PMID: 28548092
- PMCID: PMC5458563
- DOI: 10.1038/ncomms15501
Solid-state ensemble of highly entangled photon sources at rubidium atomic transitions
Abstract
Semiconductor InAs/GaAs quantum dots grown by the Stranski-Krastanov method are among the leading candidates for the deterministic generation of polarization-entangled photon pairs. Despite remarkable progress in the past 20 years, many challenges still remain for this material, such as the extremely low yield, the low degree of entanglement and the large wavelength distribution. Here, we show that with an emerging family of GaAs/AlGaAs quantum dots grown by droplet etching and nanohole infilling, it is possible to obtain a large ensemble of polarization-entangled photon emitters on a wafer without any post-growth tuning. Under pulsed resonant two-photon excitation, all measured quantum dots emit single pairs of entangled photons with ultra-high purity, high degree of entanglement and ultra-narrow wavelength distribution at rubidium transitions. Therefore, this material system is an attractive candidate for the realization of a solid-state quantum repeater-among many other key enabling quantum photonic elements.
Conflict of interest statement
The authors declare no competing financial interests.
Figures

 and
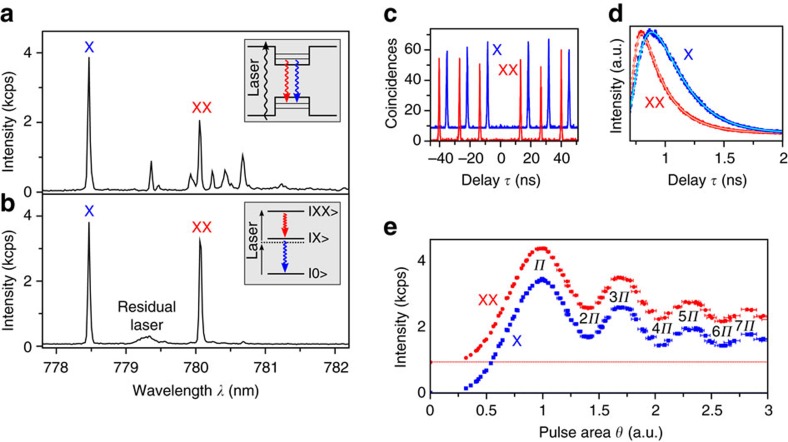
and  . (d) Measurement of the fluorescence lifetime T1 for the XX and X state. The respective fit functions (solid lines) denote the convolution between an exponential decay and the detector response function. Short radiative lifetimes of T1,XX=112 ps and T1,X=134 ps are determined. (e) Fluorescence intensities of the XX and X emissions as a function of the pulse area θ, obtained by excitation laser power-dependent measurements. Rabi oscillations up to 7π are observed for both transitions. An offset is added to the XX values for better visibility, with the dotted lines indicating zero intensity.
 is deduced. (b,c) Real (b) and imaginary (c) part of the two-photon density matrix as reconstructed from 16 correlation measurements of the same QD by employing the maximum likelihood technique. The fidelity and concurrence extracted from this matrix are F=0.91 and C=0.90, respectively.
References
-
- Freedman S. J. & Clauser J. F. Experimental test of local hidden-variable theories. Phys. Rev. Lett. 28, 938 (1972).
-
- Aspect A., Grangier P. & Roger G. Experimental tests of realistic local theories via Bell's theorem. Phys. Rev. Lett. 47, 460 (1981).
-
- Shih Y. & Alley C. O. New type of Einstein-Podolsky-Rosen-Bohm experiment using pairs of light quanta produced by optical parametric down conversion. Phys. Rev. Lett. 61, 2921 (1988). - PubMed
-
- Burnham D. C. & Weinberg D. L. Observation of simultaneity in parametric production of optical photon pairs. Phys. Rev. Lett. 25, 84 (1970).
-
- Benson O., Santori C., Pelton M. & Yamamoto Y. Regulated and entangled photons from a single quantum dot. Phys. Rev. Lett. 84, 2513–2516 (2000). - PubMed
Publication types
LinkOut - more resources
Full Text Sources
Other Literature Sources
Miscellaneous
