. 2017 May 26:8:15290.
doi: 10.1038/ncomms15290.

Genomic analysis of oesophageal squamous-cell carcinoma identifies alcohol drinking-related mutation signature and genomic alterations

Affiliations

Genomic analysis of oesophageal squamous-cell carcinoma identifies alcohol drinking-related mutation signature and genomic alterations

Jiang Chang et al. Nat Commun. .

Abstract

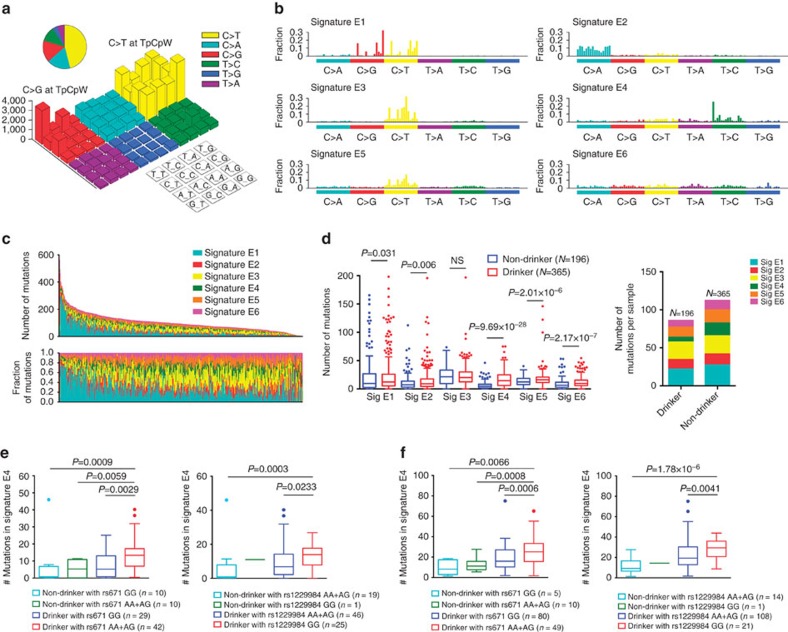
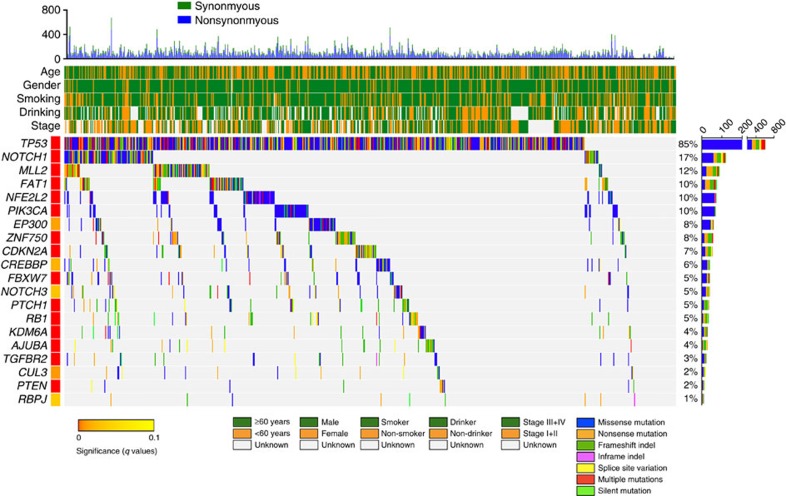
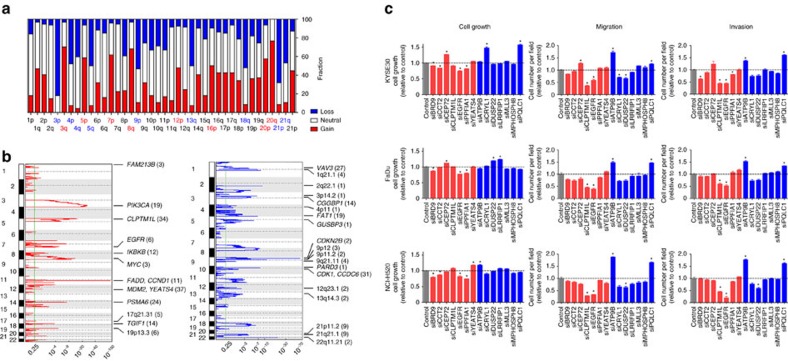
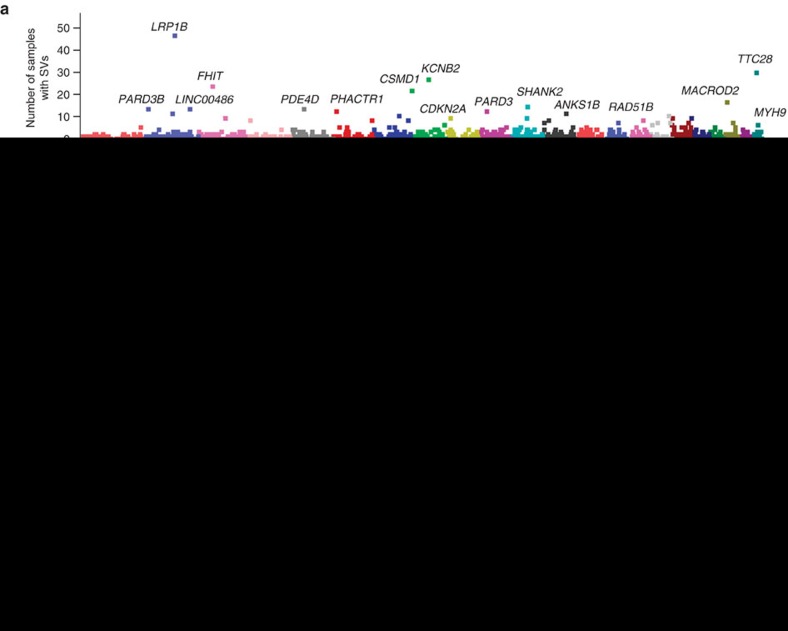
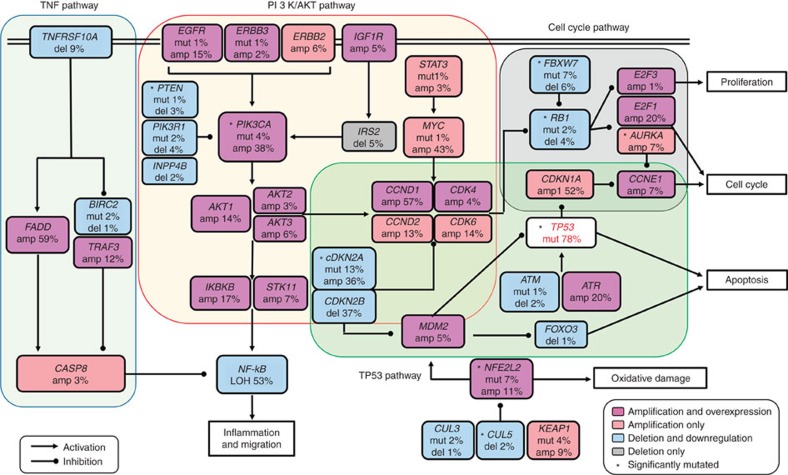
Approximately half of the world's 500,000 new oesophageal squamous-cell carcinoma (ESCC) cases each year occur in China. Here, we show whole-genome sequencing of DNA and RNA in 94 Chinese individuals with ESCC. We identify six mutational signatures (E1-E6), and Signature E4 is unique in ESCC linked to alcohol intake and genetic variants in alcohol-metabolizing enzymes. We discover significantly recurrent mutations in 20 protein-coding genes, 4 long non-coding RNAs and 10 untranslational regions. Functional analyses show six genes that have recurrent copy-number variants in three squamous-cell carcinomas (oesophageal, head and neck and lung) significantly promote cancer cell proliferation, migration and invasion. The most frequently affected genes by structural variation are LRP1B and TTC28. The aberrant cell cycle and PI3K-AKT pathways seem critical in ESCC. These results establish a comprehensive genomic landscape of ESCC and provide potential targets for precision treatment and prevention of the cancer.


Conflict of interest statement

The authors declare no competing financial interests.

Figures

Figure 1
Figure 1. Genome-wide mutational signatures of 704 ESCC samples.
(a) The whole-exome mutation spectra. Colours represent the six SNV types on the upper right. The three base content of each mutation is labelled in the 4 × 4 legend on the lower right. ESCC show an enrichment for APOBEC-mediated C>G and C>T mutations of C>G and C>T in TpCpW trinucleotide sites (where W corresponds to either A or T). (b) Patterns of substitutions for Signatures E1–E6. Each signature is displayed according to the 96 substitution classifications defined by the substitution class and sequence context immediately 5′ and 3′ to the mutated base. The vertical axis represents mutation fractions of each substitution classification. (c) The contributions of mutational signatures to individual ESCC samples. Each bar represents a selected sample from the 704 ESCC samples. The horizontal axis denotes 704 ESCC samples and the vertical axis denotes the number of mutations (upper panel) or mutation fractions (lower panel). (d) Number of mutations in each signature (left panel) and total number of mutation (right panel) as function of drinking status. The data represent median and interquartile range and P values are from unpaired Wilcoxon rank-sum test. NS, not significant. (e,f) Number of mutations in Signature E4 as function of ALDH2 or ADH1B genotypes in Chinese (e) or Japanese (f) ESCC samples. Data are displayed in Tukey's boxplot. The line in the middle of the box is plotted at the median while the upper and lower hinges indicated 25th and 75th percentiles. Whiskers indicate 1.5 times interquartile range (IQR) and values greater than it are plotted as individual points. The minima and maxima are the lowest datum still within 1.5 IQR of the lower quartile and the highest datum still within 1.5 IQR of the upper quartile. Unpaired Wilcoxon rank-sum test were used. NS, not significant.
Figure 2
Figure 2. Mutational landscape of somatic alterations in 704 ESCC samples.
Significantly mutated genes (identified using the MutSigCV algorithm; FDR q<0.1) are ordered by q value. Samples are arranged to emphasize mutual exclusivity among mutations. Each column denotes an individual tumour, and each row represents a gene. Very top, total number of mutations (y axis) for each sample (x axis). Top, key clinical parameters of each examined case. Right, percentage of mutation in 704 ESCC samples while the vertical axis represents total number of mutations for each gene. Clinical characteristics and mutation types are shown by colour as indicated.
Figure 3
Figure 3. CNV in ESCC and functional impact of some genes with CNV.
(a) CNV at arm level. The bar graphs show the frequency of arm-level copy-number alterations and the vertical axis denotes chromosome arms. (b) CNV at focal regions detected by GISTIC 2.0. Regions of recurrent focal amplifications (left) and focal deletions (right) are plotted by false discovery rate (x axis) for each chromosome (y axis). Annotated peaks have residual q<0.25 and ≤40 genes within peak regions. These peak regions are annotated with candidate known cancer genes and the total number of genes within these peaks are given in brackets. A dashed line represents the centromere of each chromosome. (c) The effects of knockdown by siRNA of 14 genes with CNV on proliferation, migration and invasion of SCC cell lines KYSE30, FaDu and NCI-H520. These genes were selected for functional assays because they were affected by CNV identified in all three types of SCC, that is, ESCC, HNSCC and LUSCC. For cell proliferation, the results are presented as mean±s.e.m. from three independent experiments and each had three replications. For cell migration and invasion, the results are presented as mean±s.e.m. from three independent experiments and each had duplication. The dashed line represents mean of siRNA control result. *P<0.01 compared with control by Student's t-test.
Figure 4
Figure 4. SVs and their effects on gene expression.
(a) Number of samples with at least one SV breakpoint in gene region. The vertical axis represents chromosome positions. (b) Correlations of SV with mRNA expression of genes. The y axis denotes log-transformed P values from t-test between gene expression of samples with and without SV. The vertical axis represents chromosome positions. (c) Validation of gene fusion in ESCC. Left, gel analysis of PCR product of DNA from tumour and normal tissues; Right, Sanger sequencing of the amplicon.
Figure 5
Figure 5. Significantly aberrant pathways and networks in ESCC.
The rectangles in different colours represents percentages of amplification, amplification and overexpression, deletion, deletion and low expression and mutations in genes identified in ESCC that belong to four signaling pathways as indicated in the indicators. The amplification and deletion were defined by CNV analysis (all_thresholded.by_genes.txt file from the GISTIC output). The overexpression or low expression were defined by paired t-test between tumour and normal tissues with P<0.05 and sexpression fold change >1.2 or <0.8 being considered to be significant.

References

    1. Torre L. A. et al. Global cancer statistics, 2012. CA Cancer J. Clin. 65, 87–108 (2015). - PubMed
    1. Chen W. et al. Cancer statistics in China, 2015. CA Cancer J. Clin. 66, 115–132 (2016). - PubMed
    1. Morita M. et al. Alcohol drinking, cigarette smoking, and the development of squamous cell carcinoma of the esophagus: epidemiology, clinical findings, and prevention. Int. J. Clin. Oncol. 15, 126–134 (2010). - PubMed
    1. Toh Y. et al. Alcohol drinking, cigarette smoking, and the development of squamous cell carcinoma of the esophagus: molecular mechanisms of carcinogenesis. Int. J. Clin. Oncol. 15, 135–144 (2010). - PubMed
    1. Islami F. et al. Alcohol drinking and esophageal squamous cell carcinoma with focus on light-drinkers and never-smokers: a systematic review and meta-analysis. Int. J. Cancer 129, 2473–2484 (2011). - PubMed

Publication types

MeSH terms