. 2017 Aug;38(8):3771-3790.
doi: 10.1002/hbm.23604. Epub 2017 May 26.

Evolution of deep gray matter volume across the human lifespan

Affiliations

Evolution of deep gray matter volume across the human lifespan

Karl Narvacan et al. Hum Brain Mapp. 2017 Aug.

Abstract

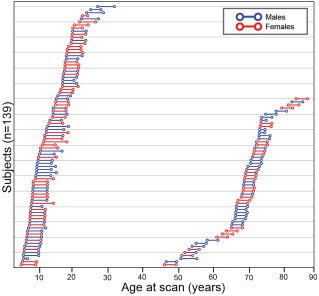
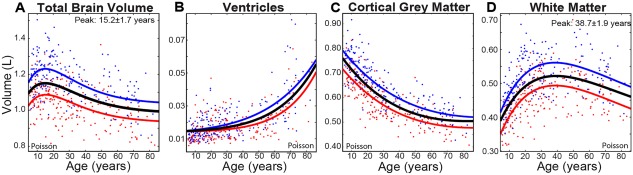
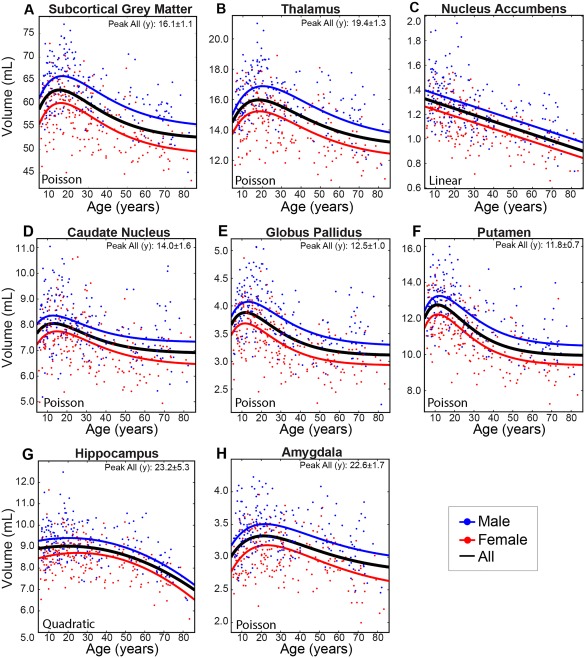
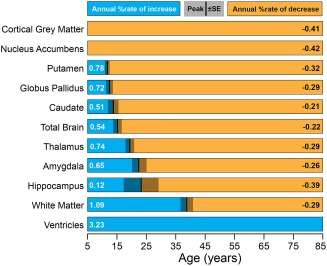
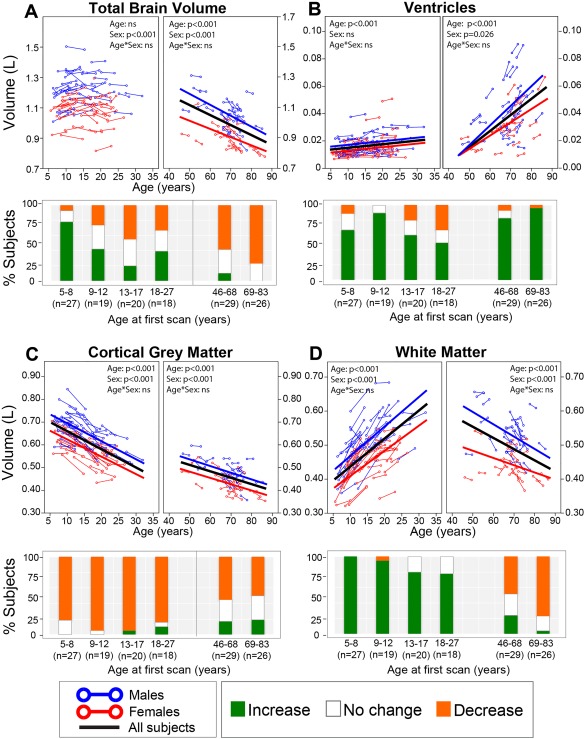
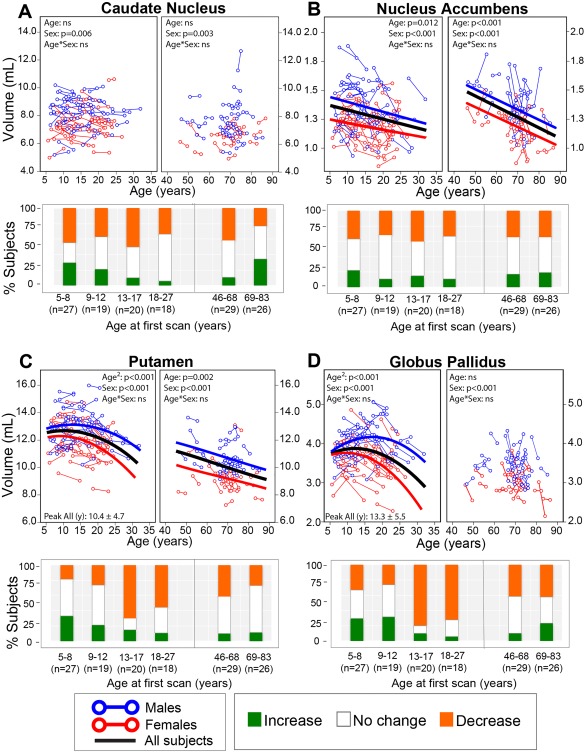
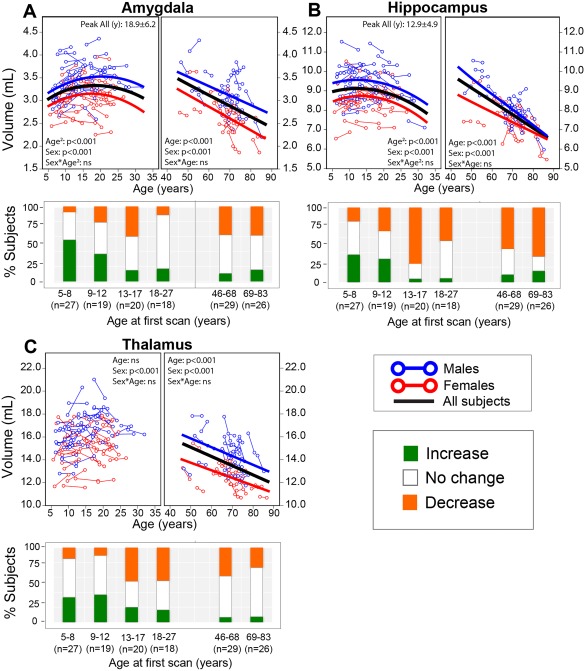
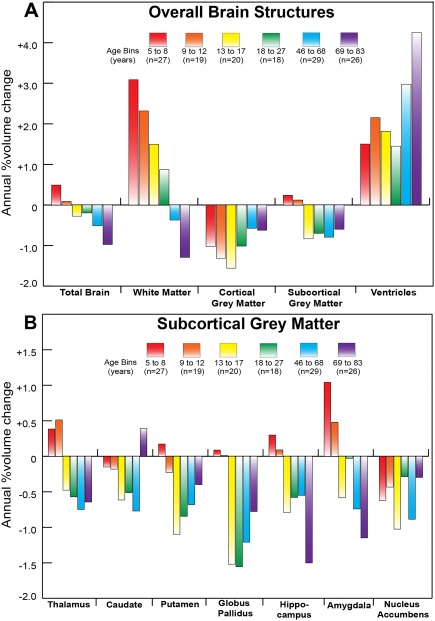
Magnetic resonance imaging of subcortical gray matter structures, which mediate behavior, cognition and the pathophysiology of several diseases, is crucial for establishing typical maturation patterns across the human lifespan. This single site study examines T1-weighted MPRAGE images of 3 healthy cohorts: (i) a cross-sectional cohort of 406 subjects aged 5-83 years; (ii) a longitudinal neurodevelopment cohort of 84 subjects scanned twice approximately 4 years apart, aged 5-27 years at first scan; and (iii) a longitudinal aging cohort of 55 subjects scanned twice approximately 3 years apart, aged 46-83 years at first scan. First scans from longitudinal subjects were included in the cross-sectional analysis. Age-dependent changes in thalamus, caudate, putamen, globus pallidus, nucleus accumbens, hippocampus, and amygdala volumes were tested with Poisson, quadratic, and linear models in the cross-sectional cohort, and quadratic and linear models in the longitudinal cohorts. Most deep gray matter structures best fit to Poisson regressions in the cross-sectional cohort and quadratic curves in the young longitudinal cohort, whereas the volume of all structures except the caudate and globus pallidus decreased linearly in the longitudinal aging cohort. Males had larger volumes than females for all subcortical structures, but sex differences in trajectories of change with age were not significant. Within subject analysis showed that 65%-80% of 13-17 year olds underwent a longitudinal decrease in volume between scans (∼4 years apart) for the putamen, globus pallidus, and hippocampus, suggesting unique developmental processes during adolescence. This lifespan study of healthy participants will form a basis for comparison to neurological and psychiatric disorders. Hum Brain Mapp 38:3771-3790, 2017. © 2017 Wiley Periodicals, Inc.

Keywords: FreeSurfer; Poisson curve; aging; basal ganglia; limbic structures; neurodevelopment; subcortical gray matter; thalamus.


Figures

Figure 1
Figure 1
Schematic diagram representing 139 subject ages at first and last scans for both neurodevelopmental (n = 84) and aging (n = 55) longitudinal cohorts. The younger cohort had ages‐at‐first scan of 5.6–27.1 years, while the older cohort had 46.1–83.3 years. Lines connecting the circles represent the interval (neurodevelopmental cohort: 4.1 ± 0.9 years; aging cohort: 3.1 ± 0.3) between scans for each individual subject. [Color figure can be viewed at http://wileyonlinelibrary.com]
Figure 2
Figure 2
Cross‐sectional cohort trajectories of (A) total brain, (B) ventricles, (C) cortical gray, and (D) white matter volume change with age (n = 406). Males (blue lines) on average show greater volumes over all ages than females (red lines), but both sexes show very similar trajectories, with the exception of the ventricles with an age‐by‐sex interaction indicating earlier increases of volume in males than females. [Color figure can be viewed at http://wileyonlinelibrary.com]
Figure 3
Figure 3
Cross‐sectional cohort trajectories of (A) total subcortical gray matter, (B) thalamus, (C) nucleus accumbens, (D) caudate nucleus, (E) globus pallidus, (F) putamen, (G) hippocampus, and (H) amygdala volumes with age (n = 406). The basal ganglia (caudate, globus pallidus, and putamen) peaked at approximately 12–14 years while the thalamus and limbic system structures (hippocampus and amygdala) peaked later at approximately 19–23 years. The nucleus accumbens (C) shows a persistent linear decrease of volume from 5 years onwards. The hippocampus, which follows a quadratic trajectory, is the only structure found to undergo accelerated declines in volume with increasing age in the latter portion of the lifespan. Note that males and females showed very similar age trajectories with no significant age‐by‐sex interactions, although males had significantly larger volumes across the age span (all p < 0.001). [Color figure can be viewed at http://wileyonlinelibrary.com]
Figure 4
Figure 4
Relative timing and magnitude of volumetric changes within the cross‐sectional dataset. The magnitude of the annual increase or decrease in percentage volume is shown for each structure. Blue bars denote increases of volume before peak age, while orange bars indicate decreases. The age at peak volume and its standard error, if applicable, are represented by the vertical bar and gray panel. Structures are arranged by increasing age at peak volume. With the exception of the gray matter and nucleus accumbens volumes which decrease consistently across the lifespan, subcortical gray matter structures reach peak volume at different ages, with the striatum (putamen, globus pallidus, and caudate) peaking earlier than the limbic system (hippocampus and amygdala). Generally, white matter volume does not stop increasing until mid‐adulthood. The ventricle volume increases continuously throughout this age range. [Color figure can be viewed at http://wileyonlinelibrary.com]
Figure 5
Figure 5
Longitudinal trajectories of (A) total brain, (B) ventricular, (C) cortical gray, and (D) white matter volumes with age with associated subject histograms denoting significant (greater than ±1SD) volume changes between the two scans approximately 3–4 years apart on average. The histograms reflect most of these same observations in both neurodevelopment and aging: the majority of the subjects experienced a decrease in total brain volume during adulthood—although the youngest age bin in childhood shows mostly increases, increase in volume of the ventricles at all ages, increases of white matter till young adulthood and then decreases in older subjects, and a decrease in volume of the cortical gray matter throughout all ages. [Color figure can be viewed at http://wileyonlinelibrary.com]
Figure 6
Figure 6
Longitudinal trajectories of (A) caudate nucleus, (B) nucleus accumbens, (C) putamen, and (D) globus pallidus volumes with age with associated subject histograms denoting significant (greater than ±1 SD) volume changes between the two scans approximately 3–4 years apart on average. Panels with no best‐fit curves indicate non‐significant age effects in that cohort. The putamen and globus pallidus follow an inverted U‐shaped trajectory in the younger cohort, whereas putamen volume gradually declined in the aging cohort while globus pallidus volume did not change with age in the aging cohort. Nucleus accumbens volume decreased linearly with age over both groups. The caudate did not change significantly with age in either young or aging cohorts. The histograms show that the two youngest age bins show a mix of volume changes, but by age 13–17 years a large number of subjects are showing a reduction of volume between scans for the putamen and globus pallidus. In addition the two oldest age bins (after 46 years) show a mix with many showing no volume changes. [Color figure can be viewed at http://wileyonlinelibrary.com]
Figure 7
Figure 7
Longitudinal trajectories of (A) amygdala, (B) hippocampus, and (C) thalamus volumes with age and their associated subject histograms denoting significant (greater than ±1 SD) volume changes between the two scans approximately 3–4 years apart on average. The amygdala and hippocampus follow an inverted U‐shaped trajectory peaking in volume in adolescence, and experience the steepest declines in volume among the 7 subcortical structures after 46 years of age. The thalamus did not change significantly with age in the neurodevelopmental cohort, but declined in volume in the aging cohort. The individual subject histograms shows growth of the amygdala in half of the subjects in the 5–8 year old bin, but is variable with increases, decreases, and no change for other structures over all age bins. An exception is the hippocampus that shows about 50%–75% of the subjects decreasing in volume in the four oldest bins, 13 years and up. [Color figure can be viewed at http://wileyonlinelibrary.com]
Figure 8
Figure 8
Average annual percent volume change per age bin of (A) overall brain structures and (B) subcortical gray matter for the longitudinal neurodevelopmental and aging cohorts. This figure reveals the magnitude of annual volume change (in percent) experienced on average at each age bin as a complement to the histograms in Figures 5–7 which show the number of subjects experiencing significant changes in a brain structure between two scans separated by approximately 3–4 years on average. (A) The white matter increases lessen in magnitude with age and then reverse to decreases in older age. The cortical gray matter decreases at all ages and the subcortical gray matter only decreases above 13 years. The ventricle volume shows the greatest proportion of increase at the oldest age bin. (B) Structures that tend to peak later (thalamus and amygdala) experience positive and higher magnitudes of annual change in the two youngest age bins compared with structures of the basal ganglia. The reduction of subcortical gray matter volume is evident for all bins above 13 years. The largest percent annual reductions are in the 13–27 year range for globus pallidus and the 69–83 year range for hippocampus. [Color figure can be viewed at http://wileyonlinelibrary.com]

References

    1. Afroz S, Parato J, Shen H, Smith SS (2016): Synaptic pruning in the female hippocampus is triggered at puberty by extrasynaptic GABA(A) receptors on dendritic spines. Elife 5: - PMC - PubMed
    1. Bouchard TP, Malykhin N, Martin WR, Hanstock CC, Emery DJ, Fisher NJ, Camicioli RM (2008): Age and dementia‐associated atrophy predominates in the hippocampal head and amygdala in Parkinson's disease. Neurobiol Aging 29:1027–1039. - PubMed
    1. Brain Development Cooperative Group (2012): Total and regional brain volumes in a population‐based normative sample from 4 to 18 years: The nih mri study of normal brain development. Cereb Cortex 22:1–12. - PMC - PubMed
    1. Brown TT, Kuperman JM, Chung YH, Erhart M, McCabe C, Hagler DJ, Venkatraman VK, Akshoomoff N, Amaral DG, Bloss CS, Casey BJ, Chang L, Ernst TM, Frazier JA, Gruen JR, Kaufmann WE, Kenet T, Kennedy DN, Murray SS, Sowell ER, Jernigan TL, Dale AM (2012): Neuroanatomical assessment of biological maturity. Curr Biol 22:1693–1698. - PMC - PubMed
    1. Brown CJ, Miller SP, Booth BG, Andrews S, Chau V, Poskitt KJ, Hamarneh G (2014): Structural network analysis of brain development in young preterm neonates. Neuroimage 101:667–680. - PubMed

Publication types

MeSH terms

Grants and funding