. 2017 Aug;44(8):4169-4178.
doi: 10.1002/mp.12375. Epub 2017 Jul 10.

Fast computation of full density matrix of multispin systems for spatially localized in vivo magnetic resonance spectroscopy

Affiliations

Fast computation of full density matrix of multispin systems for spatially localized in vivo magnetic resonance spectroscopy

Yan Zhang et al. Med Phys. 2017 Aug.

Abstract

Purpose: Numerical simulations of three-dimensionally localized MRS spectra have been very time consuming for multispin systems because the current state-of-the-art method requires computation of a large ensemble of spins pixel-by-pixel in three dimensional space. This paper describes a highly accelerated technique for computing spatially localized MRS spectra using the full solution to the Liouville-von Neumann equation.

Methods: The time evolution of spatially localized multispin density matrix as the full solution to the Liouville-von Neumann equation was analyzed. A new technique based on one dimensional spatial projection of the full density matrix was proposed. This method was implemented using a computer program written in Java language.

Results: The MRS spectra calculated using the new method were found to be identical to conventional three-dimensional simulation for the same digitization of the voxel while the new method reduced computation time by orders of magnitude and led to not only improved speed but also accuracy. Applications of the new method to phantom studies of multispin systems and quantification of in vivo MRS spectra of brain were demonstrated.

Conclusion: The dramatically enhanced computational efficiency makes accurate simulation of localized MRS spectra highly accessible for calculating basis sets for spectral quantification and for optimizing pulse sequences.

Keywords: MRS quantification; localized MRS; multispin density operator; numerical simulation; one-dimensional projection; shaped RF pulse.


Conflict of interest statement

The authors report no conflict of interest and have no financial disclosures.

Figures

Figure 1
Figure 1
The simulated point‐resolved spectroscopy (PRESS) pulse sequence. The slice‐selection excitation was applied in z direction. The two refocusing pulses were in x and y directions, respectively. t1, t2, and t3 are the times at which the spin density operators are summed over the selected slices.
Figure 2
Figure 2
The short echo‐time (TE) N‐acetyl‐aspartate (NAA), lactate (Lac) spectra simulated with PRESS at 3 T. The spectra represent the simulations using GAMMA C++ conventional three‐dimensional method (red), GAMMA C++ with one‐dimensional projection (green), and Java‐developed simulation with one‐dimensional projection (purple), respectively. The voxel was represented by the points of 100 × 100 × 100 in digitization. The three simulated spectra are completely identical. The two simulations with the one‐dimensional projection method used 10 s or less for NAA (acetyl moiety and aspartate moiety were combined) and Lac; in contrast, the conventional three‐dimensional simulation took over 16 h. All RF pulses were created using Shinnar‐Le Roux algorithm and were identical to those used by the scanner.
Figure 3
Figure 3
Comparisons of simulated spectra using shaped RF pulses (black) and ideal RF pulses (red) at 3 T (a) and 7 T (b). Residuals are displayed in green. Coupled spins, lactate in particular, showed large differences that were more pronounced at 7 T.
Figure 4
Figure 4
Three different echo time spectra of lactate (Lac) at 35 ms, 83 ms, and 144 ms were simulated using ideal pulses (red) and shaped pulses (black), respectively. The signal amplitudes were normalized by the simulated N‐acetyl‐aspartate (NAA) peaks at 2 ppm. The disparities between ideal pulses and shaped pulses are noticeable and more pronounced with long echo times.
Figure 5
Figure 5
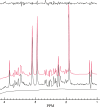
Fit of short TE phantom spectrum at 3 T using simulated basis sets. The experimental and fitted spectra are displayed in black and red, respectively. Fit residuals (black) are displayed in the top panel and the estimated baseline (black) is at the bottom. All RF pulses in the simulation were identical to those used by the scanner.
Figure 6
Figure 6
Comparisons of simulated PRESS (a) and STEAM (b) at 7 T with reduced spatial points. The spectra in black were created by simulations with high spatial definitions, 330 × 180 × 180 for PRESS and 330 × 330 × 330 for STEAM, respectively. The differences caused by using reduced points are represented by the residual lines in red, green, and purple, respectively. In PRESS (a), the three reduced spatial definitions are 82 × 46 × 46, 42 × 22 × 22, and 28 × 16 × 16. In STEAM (b), they are 34 × 34 × 34, 16 × 16 × 16, and 8 × 8 × 8, respectively.
Figure 7
Figure 7
An example of fitting in vivo short echo‐time (TE) spectrum acquired at 3 T using simulated basis set. The fitted spectrum and the baseline (under the spectra) were displayed in red and purple, respectively. The baseline included the contributions from the resonance signals of macromolecules and lipids. The experimental spectrum and the fit residuals (on top) are in black.

References

    1. Provencher SW. Estimation of metabolite concentrations from localized in vivo proton NMR spectra. Magn Reson Med. 1993;30:672–679. - PubMed
    1. Smith SA, Levante TO, Meier BH, Ernst RR. Computer simulations in magnetic resonance. An object‐oriented programming approach. J Magn Reson A. 1994;106:75–105.
    1. Gu M, Zahr NM, Spielman DM, Sullivan EV, Pfefferbaum A, Mayer D. Quantification of glutamate and glutamine using constant‐time point‐resolved spectroscopy at 3 T. NMR Biomed. 2013;26:164–172. - PMC - PubMed
    1. Hancu I, Port J. The case of the missing glutamine. NMR Biomed. 2011;24:529–535. - PubMed
    1. Hur R, Sailasuta N, Srinivasan R, Vigneron DB, Pelletier D, Nelson SJ. Measurement of brain glutamate using TE‐averaged PRESS at 3 T. Magn Reson Med. 2004;51:435–440. - PubMed

LinkOut - more resources