. 2017 Sep;30(9):10.1002/nbm.3747.
doi: 10.1002/nbm.3747. Epub 2017 May 26.

Measurement of glycine in healthy and tumorous brain by triple-refocusing MRS at 3 T in vivo

Affiliations

Measurement of glycine in healthy and tumorous brain by triple-refocusing MRS at 3 T in vivo

Vivek Tiwari et al. NMR Biomed. 2017 Sep.

Abstract

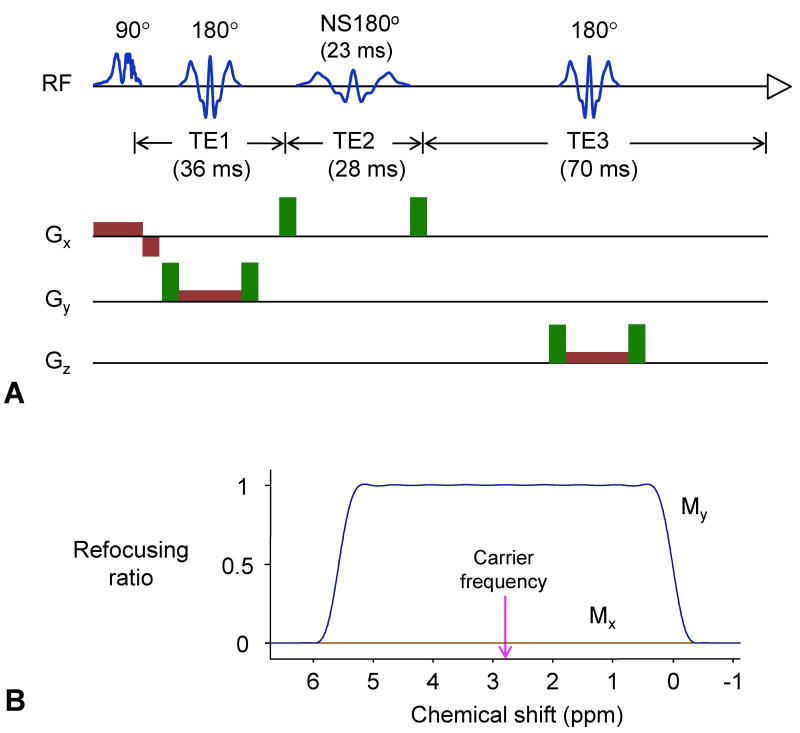
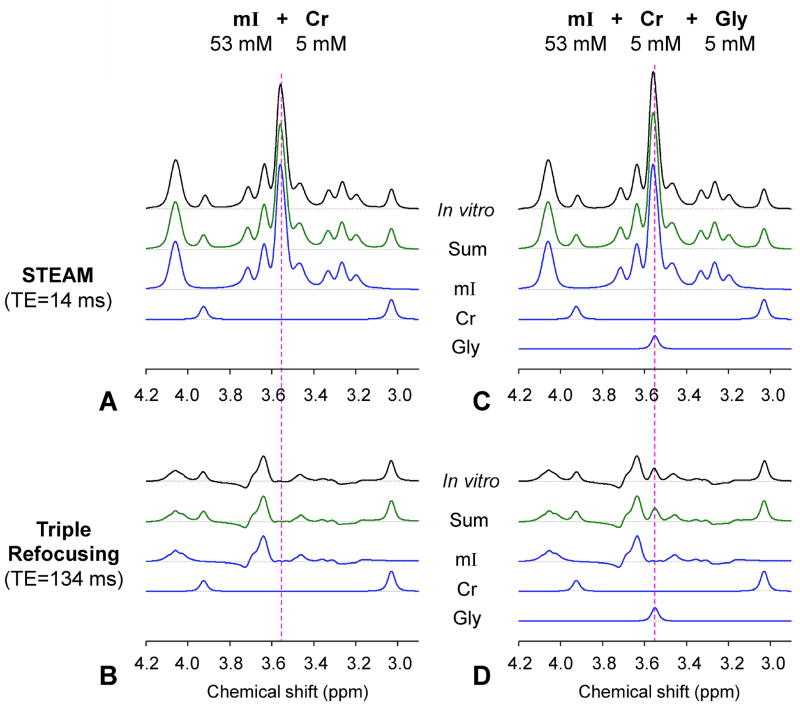
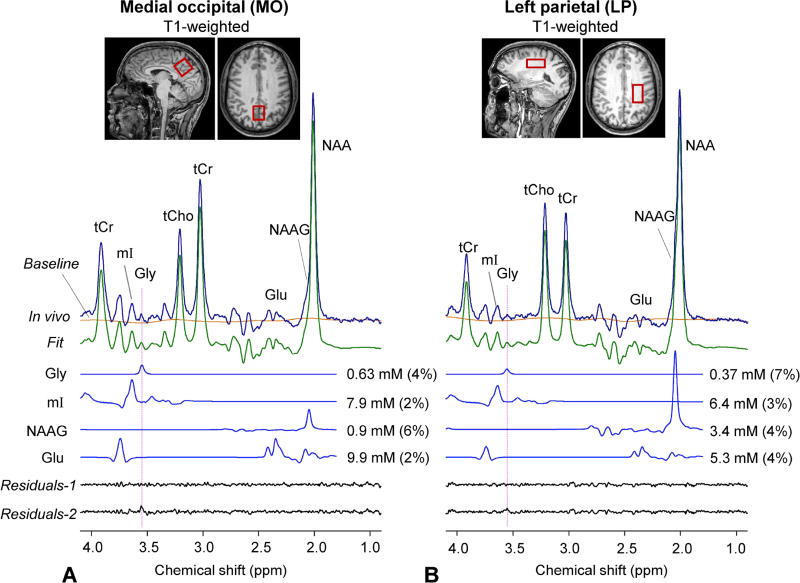
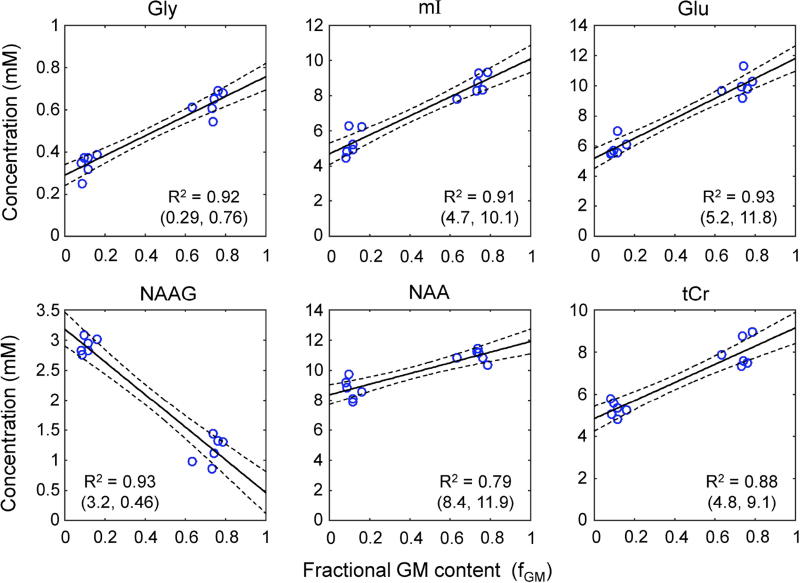
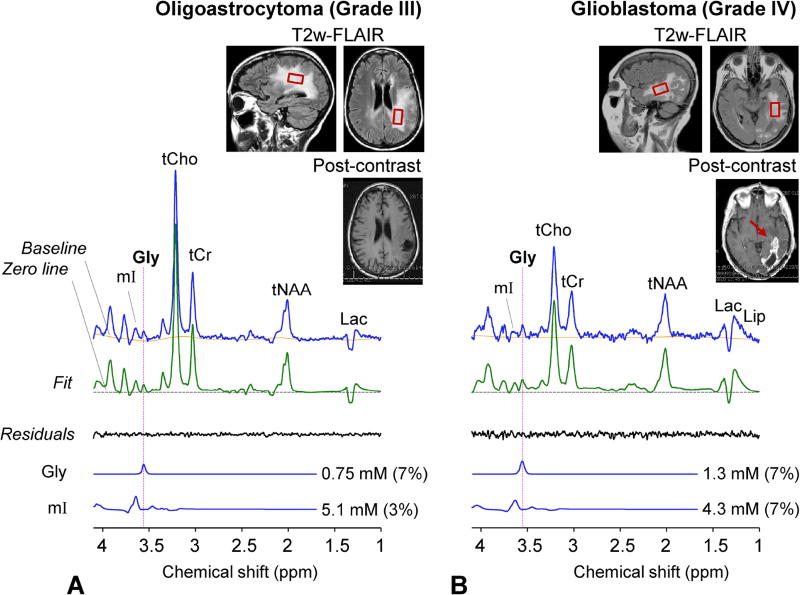
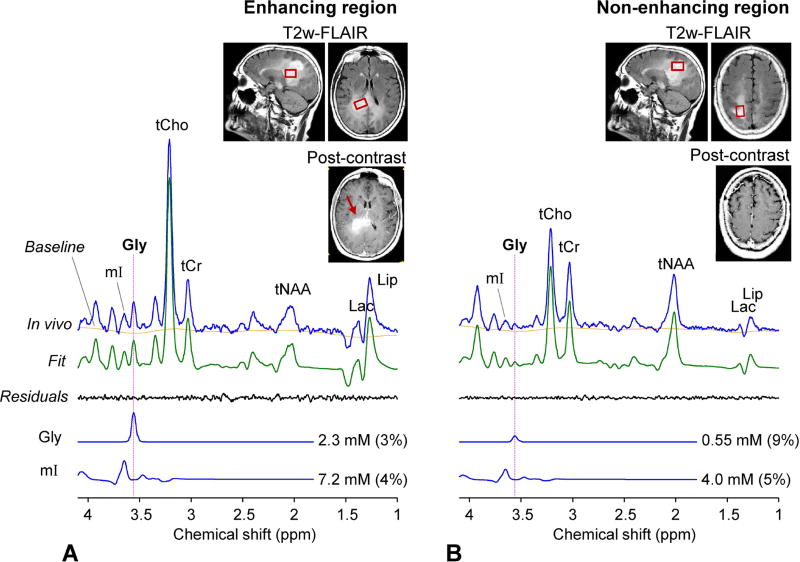
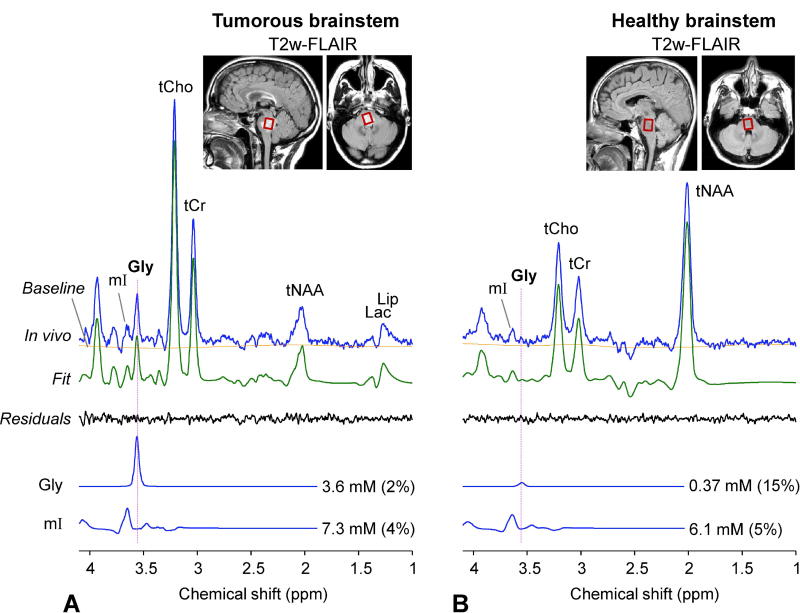
Glycine (Gly) has been implicated in several neurological disorders, including malignant brain tumors. The precise measurement of Gly is challenging largely as a result of the spectral overlap with myo-inositol (mI). We report a new triple-refocusing sequence for the reliable co-detection of Gly and mI at 3 T and for the evaluation of Gly in healthy and tumorous brain. The sequence parameters were optimized with density-matrix simulations and phantom validation. With a total TE of 134 ms, the sequence gave complete suppression of the mI signal between 3.5 and 3.6 ppm and, consequently, well-defined Gly (3.55 ppm) and mI (3.64 ppm) peaks. In vivo 1 H magnetic resonance spectroscopy (MRS) data were acquired from the gray matter (GM)-dominant medial occipital and white matter (WM)-dominant left parietal regions in six healthy subjects, and analyzed with LCModel using in-house-calculated basis spectra. Tissue segmentation was performed to obtain the GM and WM contents within the MRS voxels. Metabolites were quantified with reference to GM-rich medial occipital total creatine at 8 mM. The Gly and mI concentrations were estimated to be 0.63 ± 0.05 and 8.6 ± 0.6 mM for the medial occipital and 0.34 ± 0.05 and 5.3 ± 0.8 mM for the left parietal regions, respectively. From linear regression of the metabolite estimates versus fractional GM content, the concentration ratios between pure GM and pure WM were estimated to be 2.6 and 2.1 for Gly and mI, respectively. Clinical application of the optimized sequence was performed in four subjects with brain tumor. The Gly levels in tumors were higher than those of healthy brain. Gly elevation was more extensive in a post-contrast enhancing region than in a non-enhancing region. The data indicate that the optimized triple-refocusing sequence may provide reliable co-detection of Gly and mI, and alterations of Gly in brain tumors can be precisely evaluated.

Keywords: 1H MRS; 3 T; glioma; glycine (Gly); gray matter; human brain; triple refocusing; white matter.


Figures

Figure 1
Figure 1
(a) Schematic diagram of the Gly-optimized triple-refocusing sequence. The 90° pulse (9.8 ms; BW = 4.2 kHz) and the first and third 180° pulses (13.2 ms; BW = 1.3 kHz) were slice selective while the second 180° was non-slice selective (NS180; 23 ms long). The three subecho time set used for Gly detection was (TE1, TE2, TE3) = (36, 28, 70) ms, the total TE being 134 ms. Slice selective gradients are shown in brown and spoiling gradients in green (strength 32 mT/m, duration 2 ms, total slope duration 0.8 ms) (b) The refocusing profile of the 23 ms long NS180 pulse (BW = 722 Hz). The NS180 (and all localizing pulses) was tuned to 2.8 ppm, as indicated by a vertical line.
Figure 2
Figure 2
In-vitro triple-refocused spectra from phantoms with mI and Cr and with mI, Cr and Gly, obtained with short-TE STEAM (TE = 14 ms and TM = 19 ms) and the Gly-optimized long-TE triple refocusing (TE = 134 ms), are shown together with calculated spectra. Note that the STEAM and triple-refocused spectra were each normalized to the Cr 3.03 ppm signal for direct comparison between triple refocusing and fully-refocused short-TE MRS. The spectra were broadened to an in-vivo linewidth at 3T (singlet FWHM = 5 Hz). For each spectrum a dashed horizontal line indicates the zero level.
Figure 3
Figure 3
Spectral analyses of a pair of in-vivo triple refocused spectra from a healthy subject are presented together with voxel positioning in T1-weighted images (voxel size 23×23×23 and 35×23×15 mm3 for medial occipital and left parietal brain respectively; NSA = 128 and TR = 2 s for both regions). Spectra, normalized to GM+WM water, are shown with LCModel fits, residuals and baseline between 1.4 and 4.1 ppm. Residuals-1 and -2 were obtained from spectral fittings using basis sets with and without Gly, respectively. Dotted lines are drawn at the Gly resonance (3.55 ppm). The FWHM of the tCr 3.03 ppm peak, returned by LCModel, was 6.1 and 5.8 Hz for medial occipital and left parietal, respectively.
Figure 4
Figure 4
Linear regression of the concentration estimates with respect to fractional GM contents (fGM) is shown for six metabolites. For each metabolite, the Y-axis intercepts at fGM = 0 and 1 are shown in a bracket, below the coefficient of determination (R2). Dashed lines indicate 95% confidence intervals of the linear fits.
Figure 5
Figure 5
In-vivo triple-refocused spectra from (A) a grade-III oligoastrocytoma patient and (B) a grade-IV glioblastoma patients are shown together with voxel positioning in T2-FLAIR images, post-gadolinium T1-weighted images, and spectral analysis results. Dashed horizontal lines (black) indicate the zero levels in the fits. The spectra were normalized to TE 13 ms STEAM water. The data were acquired from (A) a 23×16×14 mm3 voxel (5.2 mL), with TR = 2 s and NSA = 256, and (B) a 25×15×15 mm3 (5.6 mL), with TR = 2 s and NSA = 128. A vertical dotted line is drawn at 3.55 ppm.
Figure 6
Figure 6
Two in-vivo triple-refocused spectra from a radiographically-suggested glioma patient are shown together with T2-FLAIR and post-gadolinium T1-weighted images. (A) Post-contrast enhancing region (indicated by an arrow in red). Voxel size = 13×25×15 mm3 voxel (4.8 mL), NSA = 192, and TR = 2 s. (B) Post-contrast non-enhancing region. Voxel size = 23×15×20 mm3 voxel (6.9 mL), NSA = 128, and TR = 2 s. For each voxel, the spectrum was normalized to the TE 13 ms STEAM water signal. A vertical dotted line is drawn at 3.55 ppm.
Figure 7
Figure 7
In-vivo triple-refocused spectra from brainstem regions in (A) a radiographically-suggested glioma patient and (B) a healthy volunteer. The scan parameters were identical between the scans (Voxel size = 14×12×14 mm3, NSA = 512, and TR = 2 s). For each voxel, the spectrum was normalized to the TE 13 ms STEAM water signal. A vertical dotted line is drawn at 3.55 ppm.

Similar articles

Cited by

References

    1. Legendre P. The glycinergic inhibitory synapse. Cell Mol Life Sci. 2001;58:760–793. - PMC - PubMed
    1. Eulenburg V, Armsen W, Betz H, Gomeza J. Glycine transporters: essential regulators of neurotransmission. Trends Biochem Sci. 2005;30:325–333. - PubMed
    1. Javitt DC. Glutamate and Schizophrenia: Phencyclidine, N-Methyl-d-Aspartate Receptors, and Dopamine-Glutamate Interactions. Int Rev Neurobiol. 2007;78:69–108. - PubMed
    1. Bobek-Billewicz B, Hebda A, Stasik-Pres G, Majchrzak K, Zmuda E, Trojanowska A. Measurement of glycine in a brain and brain tumors by means of 1H MRS. Folia Neuropathol. 2010;48:190–199. - PubMed
    1. Perry TL, Urquhart N, Hansen S. Studies of the glycine cleavage enzyme system in brain from infants with glycine encephalopathy. Pediatr Res. 1977;11:1192–1197. - PubMed

LinkOut - more resources