. 2017 May 26;15(5):e1002605.
doi: 10.1371/journal.pbio.1002605. eCollection 2017 May.

Oligodendroglial myelination requires astrocyte-derived lipids

Affiliations

Oligodendroglial myelination requires astrocyte-derived lipids

Nutabi Camargo et al. PLoS Biol. .

Abstract

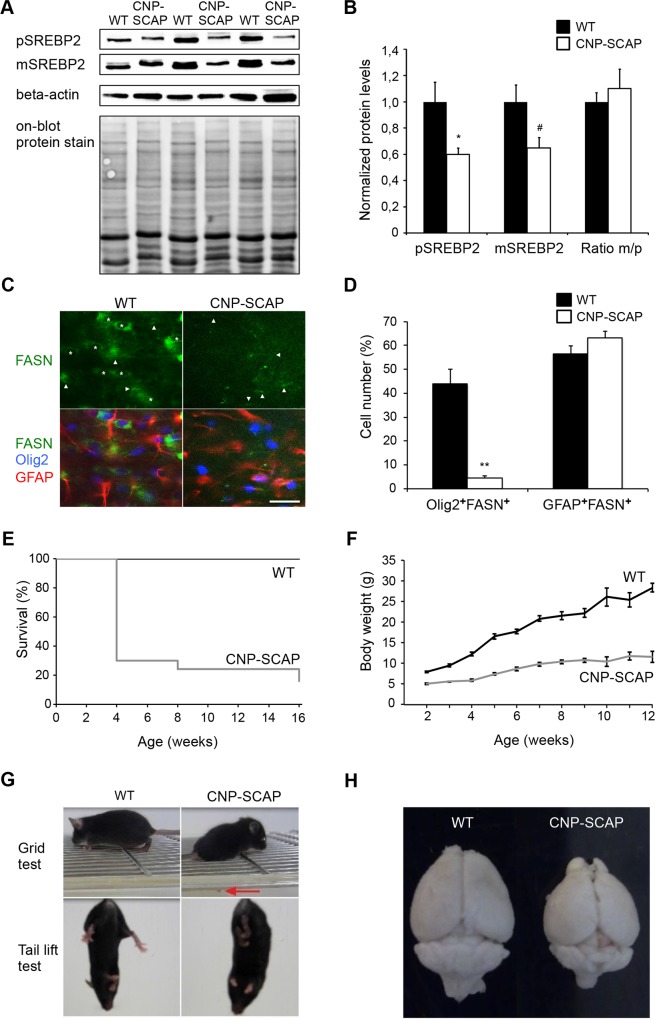
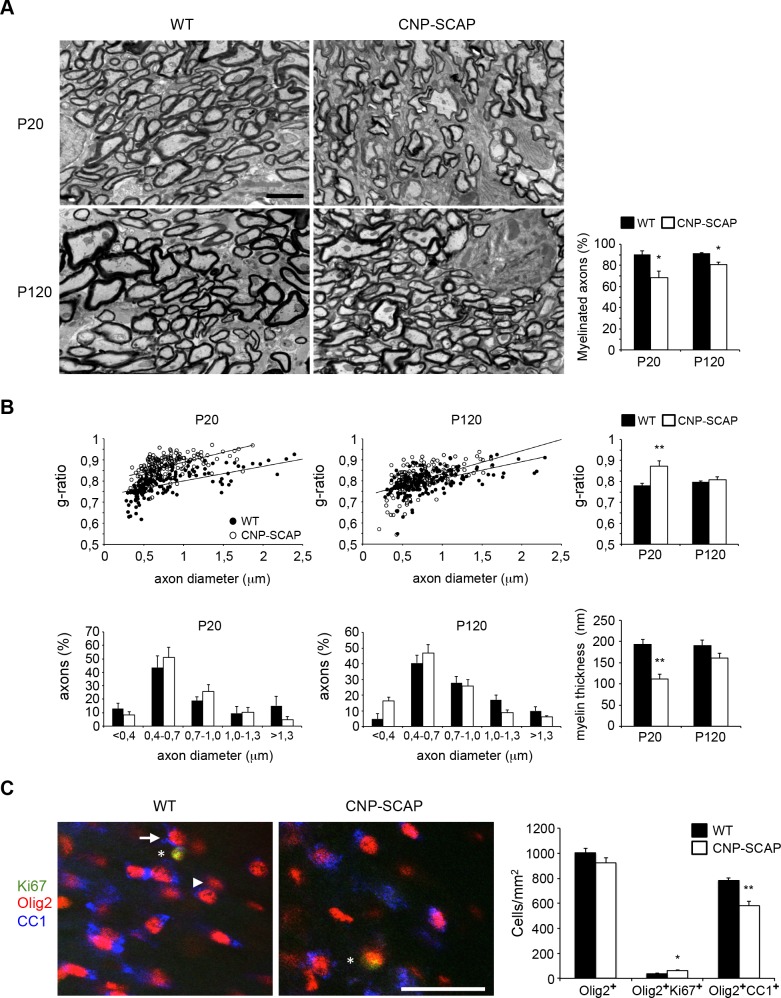
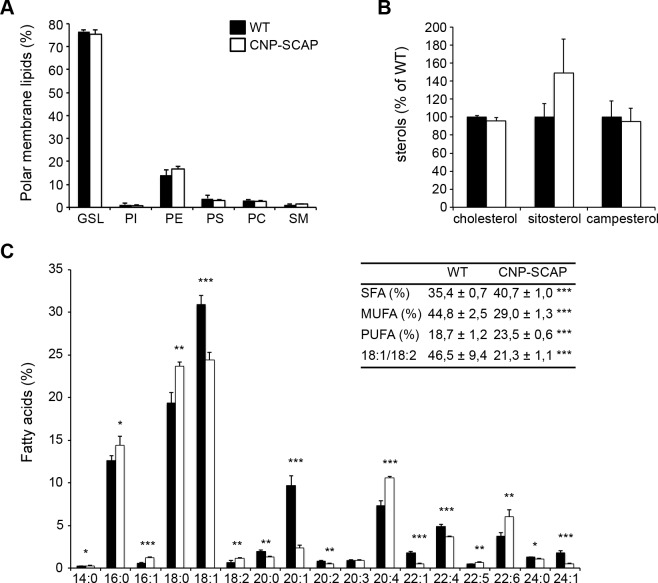
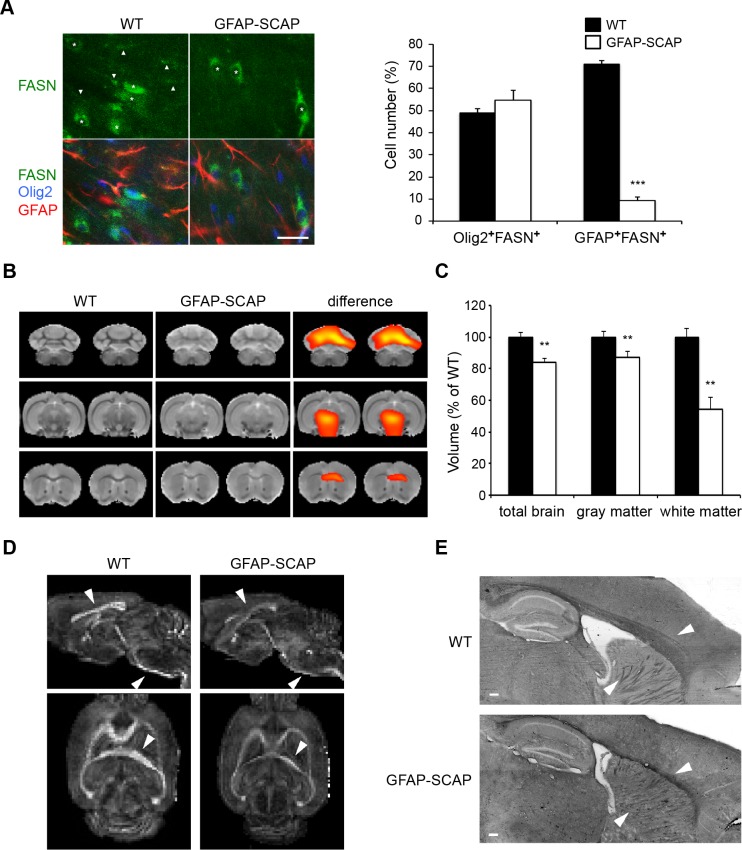
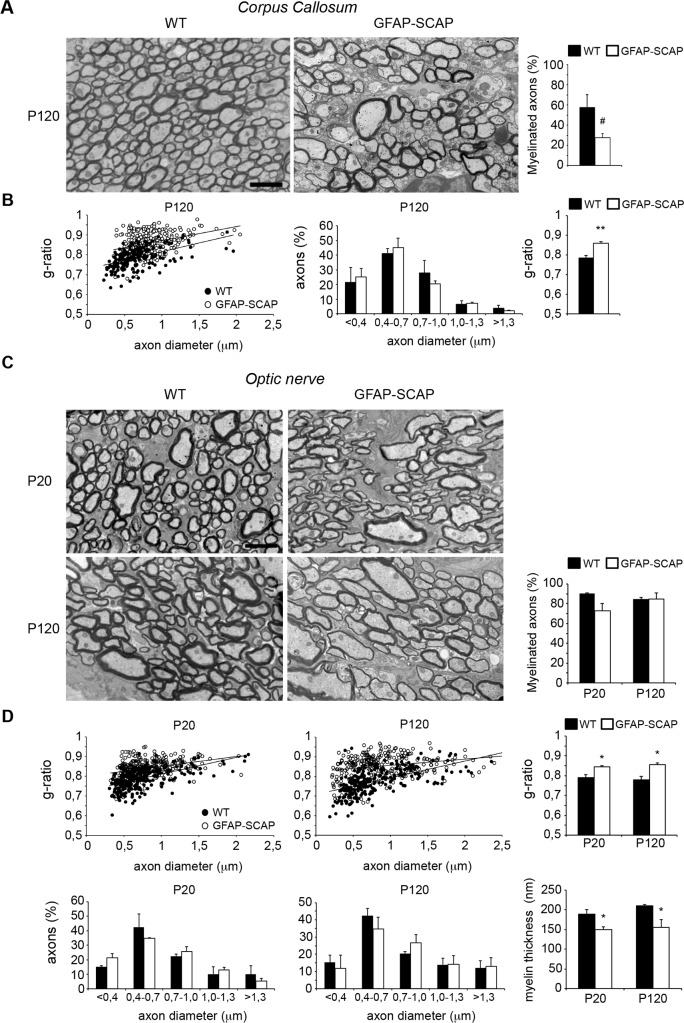
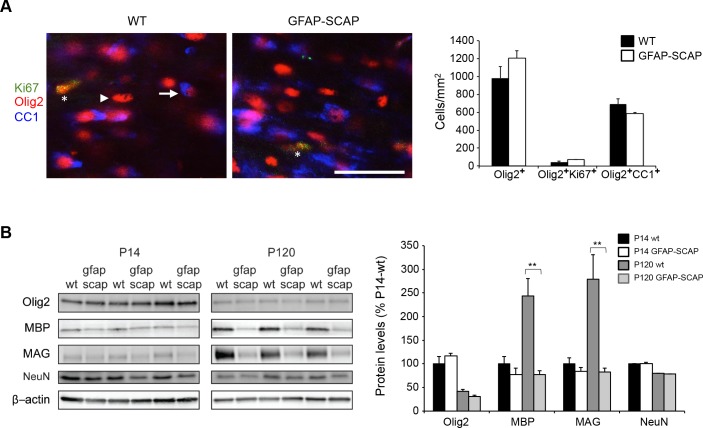
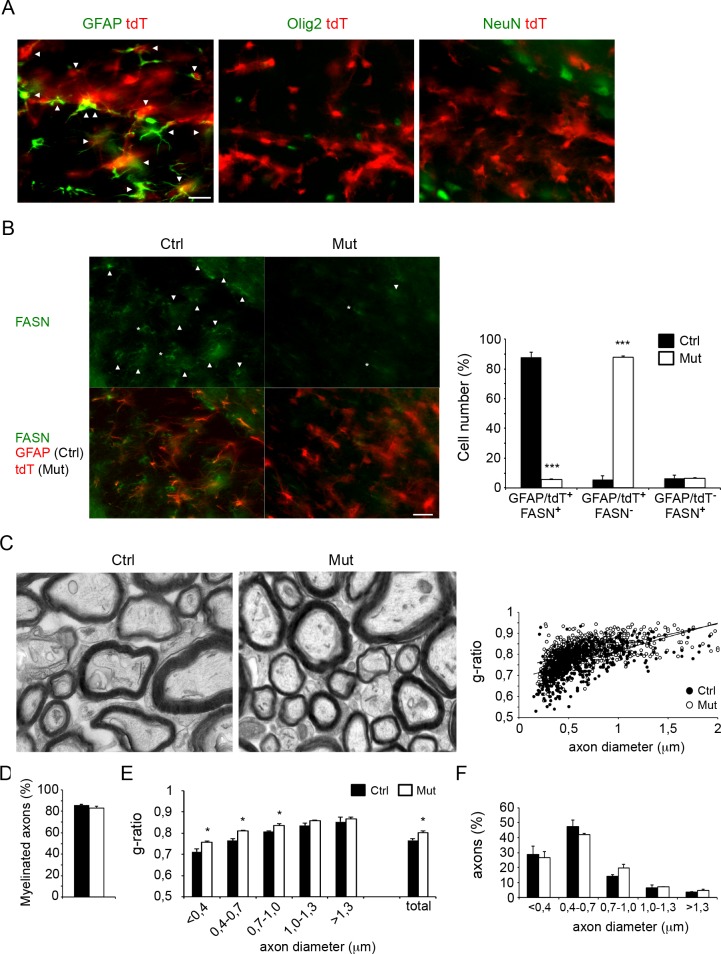
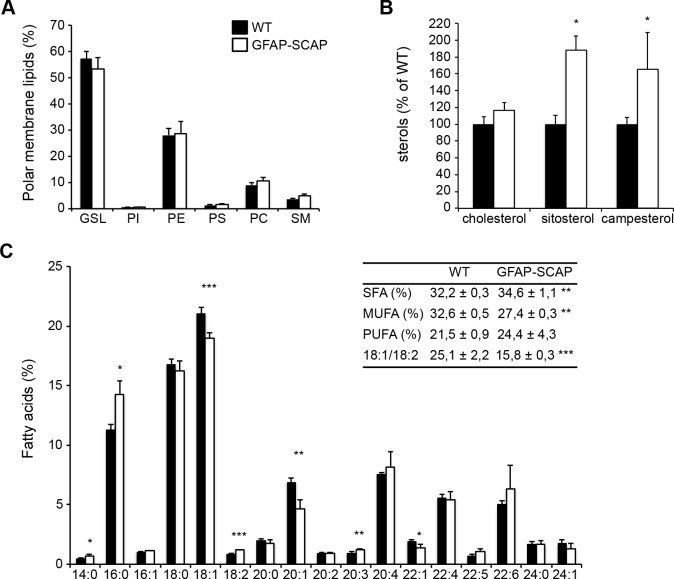
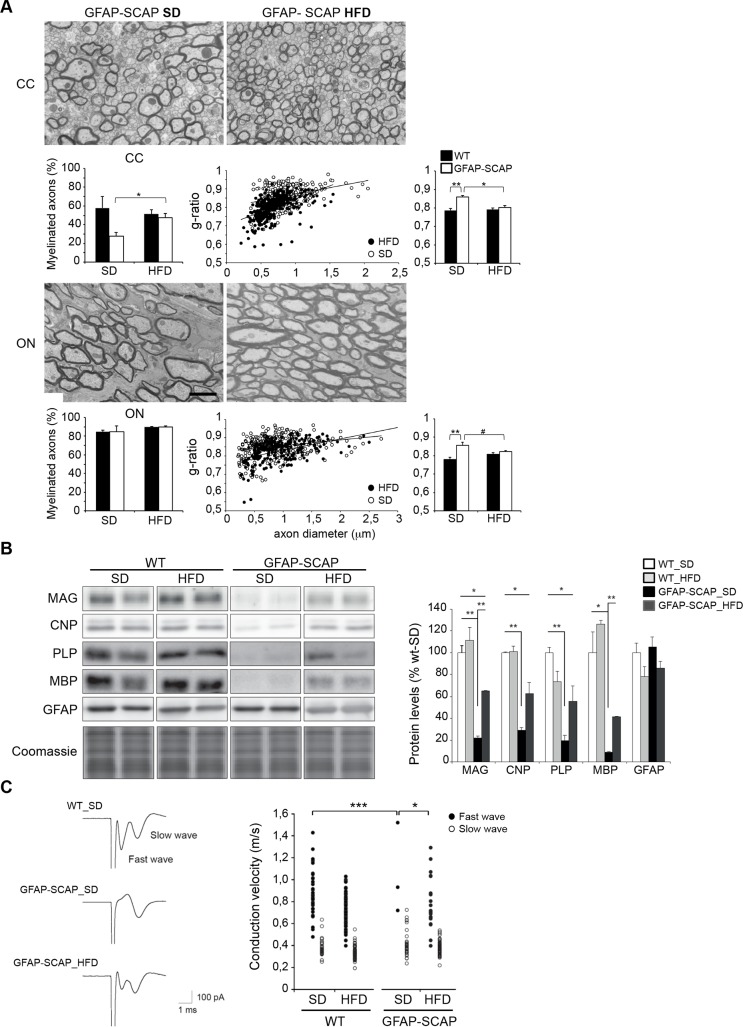
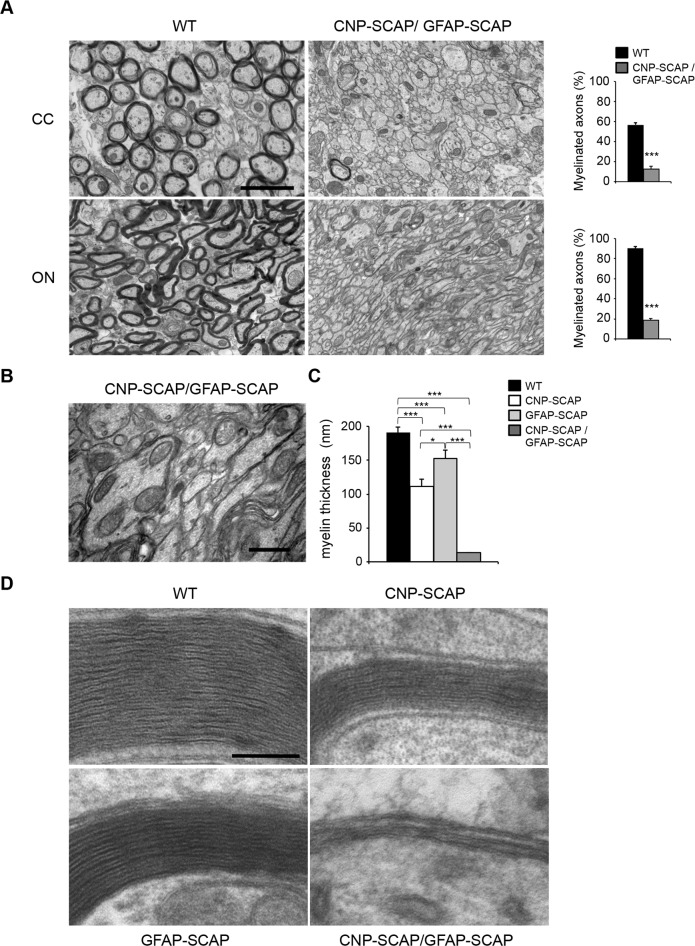
In the vertebrate nervous system, myelination of axons for rapid impulse propagation requires the synthesis of large amounts of lipids and proteins by oligodendrocytes and Schwann cells. Myelin membranes are thought to be cell-autonomously assembled by these axon-associated glial cells. Here, we report the surprising finding that in normal brain development, a substantial fraction of the lipids incorporated into central nervous system (CNS) myelin are contributed by astrocytes. The oligodendrocyte-specific inactivation of sterol regulatory element-binding protein (SREBP) cleavage-activating protein (SCAP), an essential coactivator of the transcription factor SREBP and thus of lipid biosynthesis, resulted in significantly retarded CNS myelination; however, myelin appeared normal at 3 months of age. Importantly, embryonic deletion of the same gene in astrocytes, or in astrocytes and oligodendrocytes, caused a persistent hypomyelination, as did deletion from astrocytes during postnatal development. Moreover, when astroglial lipid synthesis was inhibited, oligodendrocytes began incorporating circulating lipids into myelin membranes. Indeed, a lipid-enriched diet was sufficient to rescue hypomyelination in these conditional mouse mutants. We conclude that lipid synthesis by oligodendrocytes is heavily supplemented by astrocytes in vivo and that horizontal lipid flux is a major feature of normal brain development and myelination.


Conflict of interest statement

The authors have declared that no competing interests exist

Figures

Fig 1
Fig 1. Conditional inactivation of SREBP cleavage-activating protein (SCAP) in oligodendrocytes reduces lipogenic gene expression and causes motor control defects and reduced survival.
A) Protein levels of precursor sterol regulatory element-binding protein 2 (SREBP2) and mature (processed) SREBP2 were determined by immunoblotting of total extracts of the spinal cord of wild-type (WT) and CNP-SCAP animals at P20 (n = 3). Detection of mature and precursor SREBP2 was performed using different exposure times, and representative pictures are shown. Detection of beta-actin and on-blot protein stain was used to control for equal loading. B) Histogram shows quantification of precursor and mature SREBP2 protein levels after correction for equal loading (using on-blot stain) and subsequent normalization to WT levels in which the WT levels were set to 1, and the ratio between mature/precursor SREBP in which the ratio for WT was set to 1. All data are presented as mean levels ± SEM (t test: *p < 0.05, #p = 0.059). C) Expression of fatty acid synthase (FASN, green) in oligodendrocytes (Olig2, blue) and astrocytes (glial fibrillary acidic protein [GFAP], red) of WT or CNP-SCAP mutant mice at P20. Asterisks denote oligodendrocytes with FASN expression; arrowheads denote astrocytes with FASN expression (scale bar, 25 μm). D) Number of FASN-positive oligodendrocytes (Olig2+FASN+) and FASN-positive astrocytes (GFAP+FASN+) in WT and CNP-SCAP mice (n = 3). The values are provided as the percentage of the total number of oligodendrocytes (Olig2+ cells) or astrocytes (GFAP+ cells). Data are presented as mean ± SEM. **p < 0.01 using t test. E) Kaplan-Meier survival plot showing a strongly reduced life span of CNP-SCAP mice compared to age-matched WT mice. F) Body weight development of WT and CNP-SCAP mice over a 3-month period. Shown are the mean and SEM. G) At a grid test, CNP-SCAP mice showed limb ataxia, causing frequent slips of the hind limbs (red arrow) or front limbs. Mutant mice showed an abnormal reaction when tail lifted; they attempted to clasp their hind limbs and clench the toes of their rear feet. H) CNP-SCAP brains compared to control littermates at P28. The numeric data underlying Fig 1B, D, E and F can be found in S1 Data.
Fig 2
Fig 2. Reduced myelination in the central nervous system (CNS) of CNP-SREBP cleavage-activating protein (SCAP) mutant mice.
A) Electron microscopic analysis of optic nerve myelin in cross-sections of either wild-type (WT) or CNP-SCAP mice at depicted time points (scale bar, 2 μm). Bar graph shows the percentage of axons that is myelinated. B) Morphometric analysis of axons in optic nerves of WT and CNP-SCAP mice, showing g-ratio (axon diameter/myelinated fiber diameter), axonal size distribution (both myelinated and nonmyelinated axons), and myelin membrane thickness at P20 and P120. At P20, the relation axon diameter (x) and g-ratio (y) was y = 7E − 05x + 0.7312 for WT and y = 9E − 05x + 0.796 for CNP-SCAP, with coefficients of determination R2 = 0.45013 (WT) and 0.28818 (CNP-SCAP). At P120: y = 8E − 05x + 0.731 (WT); y = 0.0001x + 0.7253 (CNP-SCAP), R2 = 0.2957 (WT) and 0.27524 (CNP-SCAP). C) Expression of postmitotic marker CC1 (blue) or proliferation marker Ki67 (green) in oligodendrocytes (Olig2, red) of WT or CNP-SCAP mutant mice in the corpus callosum at P20. The arrow and arrowhead denote examples of oligodendrocytes, respectively, with or without CC1 expression. The asterisks denote an oligodendrocyte with Ki67 expression (scale bar, 40 μm). The bar graph shows the density of the total number of oligodendrocytes (Olig2+ cells), immature oligodendrocytes (Olig2+Ki67+ cells), and postmitotic mature oligodendrocytes (Olig2+CC1+ cells) in WT and CNP-SCAP mice. Data are presented as mean ± SEM. * = p < 0.05 ** = p < 0.01 using t test, n = 3–4. The numeric data can be found in S1 Data.
Fig 3
Fig 3. Myelin from CNP-SREBP cleavage-activating protein (SCAP) brains shows changes in fatty acid composition.
Lipid extracts of purified myelin of wild-type (WT) and CNP-SCAP brains at P56 were analyzed using liquid chromatography and mass spectrometry. A) Polar membrane lipid concentration and B) sterol concentration per protein amount in CNP-SCAP compared to WT myelin. GSL, glycosphingolipid; PI, phosphatidyl inositol; PE, phosphatidyl ethanolamine; PS, phosphatidyl serine; PC, phosphatidyl choline; SM, sphingomyelin. C) Fatty acid profile of phospholipids from purified myelin with the amount of different fatty acids species as percentage of the total amount. Fatty acid species are depicted as “y:z,” with “y” giving the length of the fatty acid molecules and “z” the number of double bonds. Insert: depicted are proportions of saturated fatty acids (SFA), monounsaturated fatty acids (MUFA), polyunsaturated fatty acids (PUFA), and the ratio of 18:1/18:2. Data are presented as mean percentage of WT ± SD. t tests: * = p < 0.05; ** = p < 0.01; *** = p < 0.001, n = 5. The numeric data can be found in S1 Data.
Fig 4
Fig 4. Conditional inactivation of SREBP cleavage-activating protein (SCAP) in astrocytes reduces lipogenic gene expression and white matter volume.
A) Expression of fatty acid synthase (FASN, green) in oligodendrocytes (Olig2, blue) and astrocytes (glial fibrillary acidic protein [GFAP], red) of wild-type (WT) or GFAP-SCAP mutant mice at P14. Asterisks denote oligodendrocytes with FASN expression; arrowheads denote astrocytes with FASN expression (scale bar, 25 μm). Bar graph shows the number of FASN-positive oligodendrocytes (Olig2+FASN+) and FASN-positive astrocytes (GFAP+FASN+) in WT and GFAP-SCAP mice. The values are provided as the percentage of the total number of oligodendrocytes (Olig2+ cells) or astrocytes (GFAP+ cells). Data are presented as mean ± SEM. ** = p < 0.01 using t test, n = 3. B) The average T2-weighted magnetic resonance image (MRI), in coronal slices, shows clear diminished white matter in the GFAP-SCAP mice (B, middle) as compared to the average WT image (B, left). Deformation-based morphometry analysis revealed regional differences in tissue volumes in the brains of GFAP-SCAP, mostly in the white matter areas (significant higher volumes in WT shown from red to yellow p < 0.05 to 0.0001, n = 4–5), overlaid on the average WT image (B, right). See S2 Fig for complete scans. C) Volumes of the whole brain and the white and grey matter of GFAP-SCAP and WT mice, as determined with MRI. Volumes are normalized to WT levels that were set to 100%. Data are shown as mean ± SEM (t test ** = p < 0.01, n = 4–5. D) Diffusion tensor imaging (DTI) of the same brains as in A, showing reduced fractional anisotropy in GFAP-SCAP mutant brains. Arrowheads show examples of the most affected white matter regions, e.g., corpus callosum, internal capsule, and corticospinal tract. E) Sudan Black staining shows less white matter in GFAP-SCAP compared to WT animals (8 months). Arrowheads show the most affected regions, i.e., corpus callosum and internal capsule (scale bar, 200 μm). The numeric data underlying Fig 4A and C can be found in S1 Data.
Fig 5
Fig 5. Persistent hypomyelination in glial fibrillary acidic protein (GFAP)- SREBP cleavage-activating protein (SCAP) mutant brains.
A) Electron microscopy (EM) analysis of corpus callosum myelination in cross-sections of either wild-type (WT) or GFAP-SCAP mice at P120. Bar graph shows the percentage of axons that is myelinated. B) Morphometric analysis of axons on corpus callosum of WT and GFAP-SCAP mice, showing g-ratio (myelinated axons) and axonal size distribution (both myelinated and non-myelinated axons) at P120. The relation between axon diameter (x) and g-ratio (y) was y = 9E − 05x + 0.7287 for WT and y = 7E − 05x + 0.8008 for GFAP-SCAP, with coefficients of determination R2 = 0.25384 (WT) and 0.11285 (GFAP-SCAP). C) EM analysis of optic nerve myelination in cross-sections of either WT or GFAP-SCAP mice at depicted time points. Bar graph shows the percentage of axons that is myelinated. D) Morphometric analysis of axons on optic nerves of WT and GFAP-SCAP mice, showing g-ratio (myelinated axons), axonal size distribution (both myelinated and nonmyelinated axons), and myelin membrane thickness at P20 and P120. At P20, the relation between axon diameter (x) and g-ratio (y) was y = 8E − 05x + 0.7262 for WT and y = 5E − 05x + 0.8003 for GFAP-SCAP, with coefficients of determination R2 = 0.31108 (WT) and 0.11441 (GFAP-SCAP). At P120: y = 9E − 05x + 0.7079 (WT); y = 3E − 05x + 0.825 (GFAP-SCAP), R2 = 0.3288 (WT) and R2 = 0.06062 (GFAP-SCAP). Scale bars, 2 μm. t test # p = 0.079, * p < 0.05, ** p < 0.01, n = 3. The numeric data can be found in S1 Data.
Fig 6
Fig 6. Reduced myelin proteins levels in glial fibrillary acidic protein (GFAP)- SREBP cleavage-activating protein (SCAP) mice.
A) Expression of postmitotic marker CC1 (blue) or proliferation marker Ki67 (green) in oligodendrocytes (Olig2, red) of wild type (WT) or GFAP-SCAP mutant mice in the corpus callosum at P14. The arrow and arrowhead denotes examples of oligodendrocytes with or without CC1 expression, respectively. The asterisks denote an oligodendrocyte with Ki67 expression (scale bar, 40 μm). The bar graph shows the density of the total number of oligodendrocytes (Olig2+ cells), immature oligodendrocytes (Olig2+Ki67+ cells) and postmitotic mature oligodendrocytes (Olig2+CC1+ cells) in WT and GFAP-SCAP mice. B) Protein levels of Olig2 (oligodendrocyte marker), myelin basic protein (MBP) and myelin-associated glycoprotein (MAG), NeuN (neuronal marker), and β-actin (loading control) were determined by immunoblotting of total brain extracts of WT and GFAP-SCAP mutant animals at P14 and P120. The bar graph shows quantification of protein levels that were first corrected for equal loading using coomassie staining, subsequently normalized to WT levels at P14 and then set to 100%. Data are presented as mean ± SEM. * = p < 0.05 ** = p < 0.01 using t test, n = 3. The numeric data can be found in S1 Data.
Fig 7
Fig 7. Postnatal tamoxifen-induced inactivation of SREBP cleavage-activating protein (SCAP) in astrocytes interferes with full myelin membrane synthesis.
A) Expression analysis of recombination-reporter protein td-Tomato (tdT, red) in astrocytes (glial fibrillary acidic protein [GFAP], green), oligodendrocytes (Olig2, green), or neurons (NeuN, green) in the corpus callosum of Glast-CreERT2-tdT-SCAP animals (P56) treated with tamoxifen at P15–P17. Arrowheads denote cells that show coexpression of tdT with cell-type specific markers (scale bar, 25 μm). B) Expression of fatty acid synthase (FASN, in green) in astrocytes in tamoxifen-treated control (ctrl, with GFAP in red) or SCAP mutant mice (Mut). Astrocytes are visible by GFAP staining (red, for ctrl mice) or tdT expression (red, Mut). Arrowheads denote FASN+ astrocytes, asterisks denote FASN+ cells that are negative for GFAP or tdT (scale bar, 25 μm). Bar graph shows the number of FASN-positive astrocytes in WT (GFAP+FASN+ cells) and GFAP-SCAP mice (tdT+FASN+ cells) or FASN-positive non-astrocyte cells (GFAP-FASN+ or tdT-FASN+ cells). The values are provided as a percentage of the total number of cells expressing GFAP, tdT, or FASN. Data are presented as mean ± SEM. *** = p < 0.001 using t test, n = 3. C) Electron microscopy (EM) analysis of corpus callosum myelination in cross-sections of either tamoxifen-treated control (ctrl) or SCAP mutant mice (Mut) at P56. The relation between axon diameter (x) and g-ratio (y) was y = 0.1308x + 0.6872 for Ctrl and y = 0.1022x + 0.7408 for Mut, with coefficients of determination R2 = 0.32986 (Ctrl) and R2 = 0.29418 (Mut). D) Bar graph shows the percentage of axons that are myelinated. E) Morphometric analysis of axons on optic nerves of Ctrl and SCAP mutant mice showing g-ratio per class of axonal diameter for myelinated axons, and F) axonal size distribution for both myelinated and nonmyelinated axons. t test * = p < 0.05. ** = p < 0.01, n = 3. The numeric data underlying Fig 7B and C can be found in S1 Data.
Fig 8
Fig 8. Myelin from glial fibrillary acidic protein (GFAP)-SREBP cleavage-activating protein (SCAP) brains shows increased accumulation of dietary lipids.
Lipid extracts of purified myelin of GFAP-SCAP brains (P42) were analyzed using liquid chromatography and mass spectrometry. A) Polar membrane lipid concentration and (B) sterol concentration per protein amount in GFAP-SCAP compared to wild-type (WT) myelin. GSL, glycosphingolipid; PI, phosphatidyl inositol; PE, phosphatidyl ethanolamine; PS, phosphatidyl serine; PC, phosphatidyl choline; SM, sphingomyelin. C) Fatty acid profile of phospholipids from purified myelin with the amount of different fatty acids species as the percentage of the total amount. Fatty acid species are depicted as “y:z,” with “y” representing the length of the fatty acid molecules and “z” representing the number of double bonds. Insert: depicted are proportions of saturated fatty acids (SFA), monounsaturated fatty acids (MUFA), polyunsaturated fatty acids (PUFA), and the ratio of 18:1/18:2. Data are presented as the mean percentage of WT ± SD. t tests: * = p < 0.05; ** = p < 0.01; *** = p < 0.001, n = 4. The numeric data can be found in S1 Data.
Fig 9
Fig 9. Effects of a high-fat diet (HFD) on myelination, myelin protein levels, and white matter conduction velocity.
A) Electron microscopy (EM) analysis of optic nerve (ON) and corpus callosum (CC) myelination in cross-sections of glial fibrillary acidic protein (GFAP)-SREBP cleavage-activating protein (SCAP) mice (P120) on either a standard diet (SD) or HFD. See Fig 5A and 5C for representative EM images of wild-type (WT) animals (P120) on SD or HFD. Scale bar, 2 μm. Bar graphs, percentage of axons that are myelinated (left). Morphometric analysis of myelinated axons showing g-ratio (middle and right). For ON of GFAP-SCAP mice, the relation between axon diameter (x) and g-ratio (y) was y = 3E − 05x + 0.825 for SD and y = 6E − 05x + 0.7687 for HFD, with coefficients of determination R2 = 0.06062 (SD) and R2 = 0.23735 (HFD). For CC of GFAP-SCAP mice, the relation between axon diameter (x) and g-ratio (y) was y = 7E − 05x + 0.8008 for SD and y = 0.0001x + 0.701 for HFD, with coefficients of determination R2 = 0.11285 (SD) and R2 = 0.26559 (HFD). t test, ** p < 0.01, * p < 0.05, # p = 0.07, n = 3–4. B) Immunoblot against depicted myelin proteins and coomassie staining of protein levels of total brain extracts of GFAP-SCAP mutant and WT mice (P120) fed with SD or HFD. Right panel: quantification of immunoblot for depicted myelin proteins for GFAP-SCAP and WT mice fed with SD or HFD (n = 3). Coomassie staining was used for normalization. Data are presented as mean ± SEM, in which WT-SD levels were set to 100%. t test * p < 0.05; ** p < 0.01). C) Example of compound action potential waveforms in the CC for a WT mouse on a standard diet (WT-SD), and a GFAP-SCAP mutant mouse on a standard diet (GFAP-SCAP-SD) or high fat diet (GFAP-SCAP-HFD). Right panel: individual plots of conduction velocity measurements in the CC of GFAP-SCAP mutant and WT fed with SD or HFD. Chi-square test, n = 12–17, * p < 0.05, *** < 0.001. The numeric data can be found in S1 Data.
Fig 10
Fig 10. Virtually no myelin membrane synthesis in CNP-SREBP cleavage-activating protein (SCAP)/glial fibrillary acidic protein (GFAP)-SCAP brains.
A) Electron microscopy (EM) analysis of the corpus callosum (CC) and optic nerve (ON) in P20-old wild-type (WT) mice or mice carrying a deletion in both astrocytes and oligodendrocytes (CNP-SCAP/GFAP-SCAP). Bar graphs show the percentage of axons that are myelinated. B) Enlarged view on part of the electron micrograph of CNP-SCAP/GFAP-SCAP ON in A. C) morphometric analysis of myelinated axons in the ON of WT, CNP-SCAP, GFAP-SCAP, and CNP-SCAP/GFAP-SCAP mice at p20, showing myelin membrane thickness. n = at least 3 animals. Membrane thickness for each CNP-SCAP/GFAP-SCAP animal was determined for at least 22 axons that were wrapped by oligodendrocyte membrane, as depicted in 10B and D. D) Electron microscopic analysis of myelin membranes in the ON of WT, CNP-SCAP, GFAP-SCAP, and CNP-SCAP/GFAP-SCAP mice. Data are presented as mean ± SEM. t test * p < 0.05, *** p < 0.001, n ≥ 3. Scale bar, (A) 2 μm, (B) 0.75 μm, (C) 0.1 μm. The numeric data underlying Fig 10A and C can be found in S1 Data.

Similar articles

Cited by

References

    1. Barres BA (2008) The mystery and magic of glia: a perspective on their roles in health and disease. Neuron 60: 430–440. doi: 10.1016/j.neuron.2008.10.013 - DOI - PubMed
    1. Waxman SG (1980) Determinants of conduction velocity in myelinated nerve fibers. Muscle Nerve 3: 141–150. doi: 10.1002/mus.880030207 - DOI - PubMed
    1. Nave KA, Werner HB (2014) Myelination of the nervous system: mechanisms and functions. Annu Rev Cell Dev Biol 30: 503–533. doi: 10.1146/annurev-cellbio-100913-013101 - DOI - PubMed
    1. Norton WT, Poduslo SE (1973) Myelination in rat brain: changes in myelin composition during brain maturation. J Neurochem 21: 759–773. - PubMed
    1. Chrast R, Saher G, Nave KA, Verheijen MH (2011) Lipid metabolism in myelinating glial cells: lessons from human inherited disorders and mouse models. J Lipid Res 52: 419–434. doi: 10.1194/jlr.R009761 - DOI - PMC - PubMed

Publication types

MeSH terms

Substances

LinkOut - more resources