

Agglomeration Determines Effects of Carbonaceous Nanomaterials on Soybean Nodulation, Dinitrogen Fixation Potential, and Growth in Soil
- PMID: 28549216
- PMCID: PMC5860665
- DOI: 10.1021/acsnano.7b01337
Agglomeration Determines Effects of Carbonaceous Nanomaterials on Soybean Nodulation, Dinitrogen Fixation Potential, and Growth in Soil
Abstract
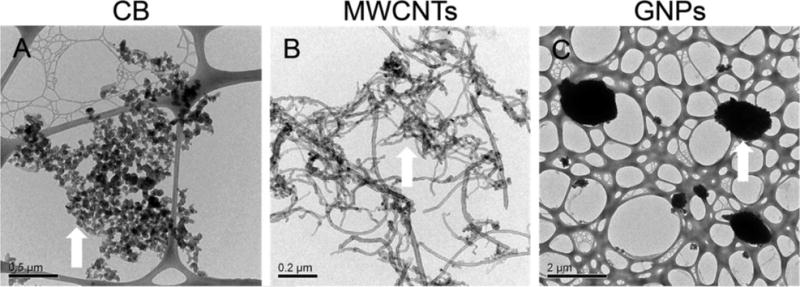
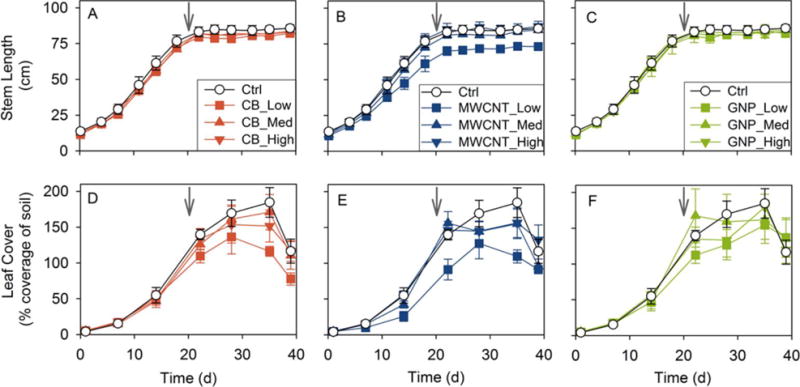
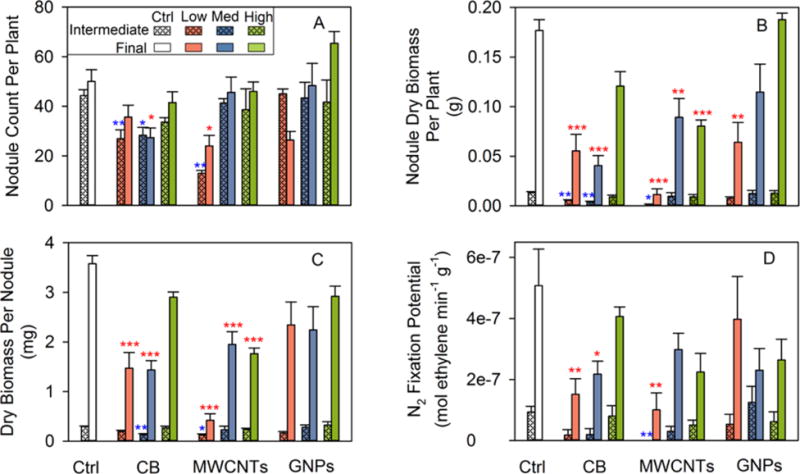
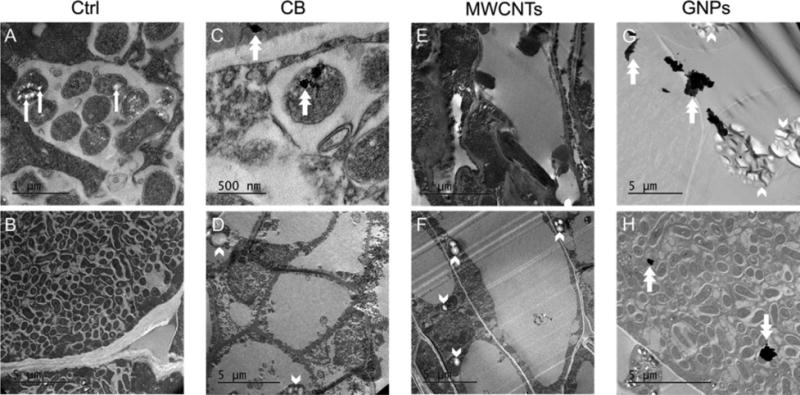
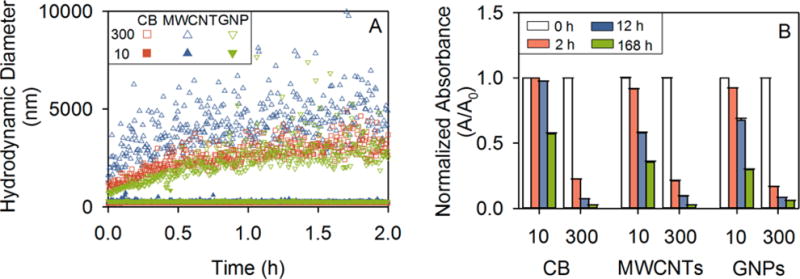
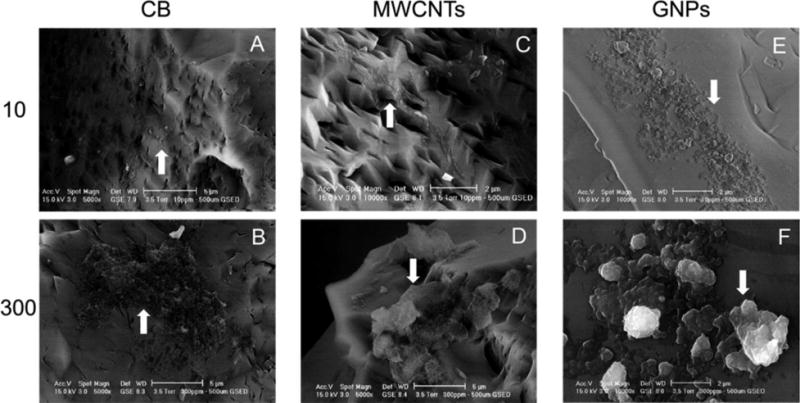
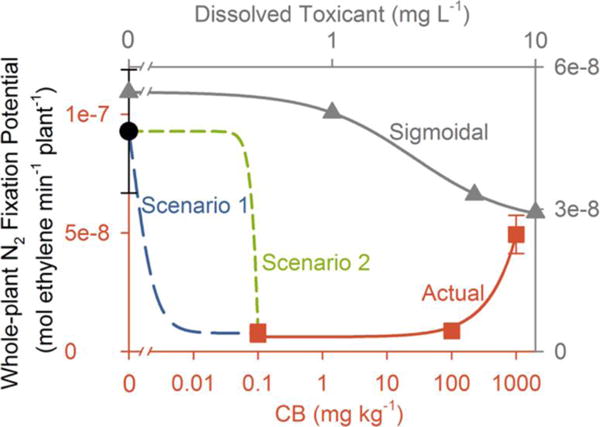
The potential effects of carbonaceous nanomaterials (CNMs) on agricultural plants are of concern. However, little research has been performed using plants cultivated to maturity in soils contaminated with various CNMs at different concentrations. Here, we grew soybean for 39 days to seed production in soil amended with 0.1, 100, or 1000 mg kg-1 of either multiwalled carbon nanotubes (MWCNTs), graphene nanoplatelets (GNPs), or carbon black (CB) and studied plant growth, nodulation, and dinitrogen (N2) fixation potential. Plants in all CNM treatments flowered earlier (producing 60% to 372% more flowers when reproduction started) than the unamended controls. The low MWCNT-treated plants were shorter (by 15%) with slower leaf cover expansion (by 26%) and less final leaf area (by 24%) than the controls. Nodulation and N2 fixation potential appeared negatively impacted by CNMs, with stronger effects at lower CNM concentrations. All CNM treatments reduced the whole-plant N2 fixation potential, with the highest reductions (by over 91%) in the low and medium CB and the low MWCNT treatments. CB and GNPs appeared to accumulate inside nodules as observed by transmission electron microscopy. CNM dispersal in aqueous soil extracts was studied to explain the inverse dose-response relationships, showing that CNMs at higher concentrations were more agglomerated (over 90% CNMs settled as agglomerates >3 μm after 12 h) and therefore proportionally less bioavailable. Overall, our findings suggest that lower concentrations of CNMs in soils could be more impactful to leguminous N2 fixation, owing to greater CNM dispersal and therefore increased bioavailability at lower concentrations.
Keywords: Carbonaceous nanomaterials; agglomeration; bioavailability; carbon nanotubes; dinitrogen fixation; graphene; soybean.
Figures
Similar articles
-
Effects of carbonaceous nanomaterials on soil-grown soybeans under combined heat and insect stresses.Environ Chem. 2019 May 22;16(6):482-493. doi: 10.1071/EN19047. Environ Chem. 2019. PMID: 34316290 Free PMC article.
-
Soybeans Grown with Carbonaceous Nanomaterials Maintain Nitrogen Stoichiometry by Assimilating Soil Nitrogen to Offset Impaired Dinitrogen Fixation.ACS Nano. 2020 Jan 28;14(1):585-594. doi: 10.1021/acsnano.9b06970. Epub 2019 Dec 18. ACS Nano. 2020. PMID: 31825596
-
Carbonaceous Nanomaterials Have Higher Effects on Soybean Rhizosphere Prokaryotic Communities During the Reproductive Growth Phase than During Vegetative Growth.Environ Sci Technol. 2018 Jun 5;52(11):6636-6646. doi: 10.1021/acs.est.8b00937. Epub 2018 May 15. Environ Sci Technol. 2018. PMID: 29719150
-
Potential toxicity of carbonaceous nanomaterials on aquatic organisms and their alleviation strategies: A review.Ecotoxicol Environ Saf. 2024 Oct 15;285:117019. doi: 10.1016/j.ecoenv.2024.117019. Epub 2024 Sep 23. Ecotoxicol Environ Saf. 2024. PMID: 39317077 Review.
-
Applications of carbon nanomaterials in the plant system: A perspective view on the pros and cons.Sci Total Environ. 2019 Jun 1;667:485-499. doi: 10.1016/j.scitotenv.2019.02.409. Epub 2019 Feb 27. Sci Total Environ. 2019. PMID: 30833247 Review.
Cited by
-
Molecular mechanisms of plant productivity enhancement by nano fertilizers for sustainable agriculture.Plant Mol Biol. 2024 Nov 26;114(6):128. doi: 10.1007/s11103-024-01527-9. Plant Mol Biol. 2024. PMID: 39586900 Review.
-
Correlation of Elemental Transfer, Bioactive Compounds and Antioxidant Activity on Lactuca sativa L. Grown in Soil with Functionalized CNT and HMs.Metabolites. 2023 Nov 24;13(12):1171. doi: 10.3390/metabo13121171. Metabolites. 2023. PMID: 38132853 Free PMC article.
-
Effects of carbonaceous nanomaterials on soil-grown soybeans under combined heat and insect stresses.Environ Chem. 2019 May 22;16(6):482-493. doi: 10.1071/EN19047. Environ Chem. 2019. PMID: 34316290 Free PMC article.
-
Nanoparticle-specific transformations dictate nanoparticle effects associated with plants and implications for nanotechnology use in agriculture.Nat Commun. 2024 Aug 27;15(1):7389. doi: 10.1038/s41467-024-51741-8. Nat Commun. 2024. PMID: 39191767 Free PMC article. Review.
-
Fe and Zn Metal Nanocitrates as Plant Nutrients through Soil Application.ACS Omega. 2022 Dec 2;7(49):45481-45492. doi: 10.1021/acsomega.2c06096. eCollection 2022 Dec 13. ACS Omega. 2022. PMID: 36530273 Free PMC article.
References
-
- De Volder MF, Tawfick SH, Baughman RH, Hart AJ. Carbon Nanotubes: Present and Future Commercial Applications. Science. 2013;339:535–539. - PubMed
-
- Zurutuza A, Marinelli C. Challenges and Opportunities in Graphene Commercialization. Nat Nanotechnol. 2014;9:730–734. - PubMed
-
- Nowack B, Ranville JF, Diamond S, Gallego-Urrea JA, Metcalfe C, Rose J, Horne N, Koelmans AA, Klaine SJ. Potential Scenarios for Nanomaterial Release and Subsequent Alteration in the Environment. Environ Toxicol Chem. 2012;31:50–59. - PubMed
-
- Petersen EJ, Zhang L, Mattison NT, O’Carroll DM, Whelton AJ, Uddin N, Nguyen T, Huang Q, Henry TB, Holbrook RD, Chen KL. Potential Release Pathways, Environmental Fate, and Ecological Risks of Carbon Nanotubes. Environ Sci Technol. 2011;45:9837–9856. - PubMed
-
- Keller AA, McFerran S, Lazareva A, Suh S. Global Life Cycle Releases of Engineered Nanomaterials. J Nanopart Res. 2013;15:1692.
Publication types
MeSH terms
Substances
Grants and funding
LinkOut - more resources
Full Text Sources
Other Literature Sources
Molecular Biology Databases
