. 2017 May 26;18(1):281.
doi: 10.1186/s12859-017-1685-x.

Large scale tissue histopathology image classification, segmentation, and visualization via deep convolutional activation features

Affiliations

Large scale tissue histopathology image classification, segmentation, and visualization via deep convolutional activation features

Yan Xu et al. BMC Bioinformatics. .

Abstract

Background: Histopathology image analysis is a gold standard for cancer recognition and diagnosis. Automatic analysis of histopathology images can help pathologists diagnose tumor and cancer subtypes, alleviating the workload of pathologists. There are two basic types of tasks in digital histopathology image analysis: image classification and image segmentation. Typical problems with histopathology images that hamper automatic analysis include complex clinical representations, limited quantities of training images in a dataset, and the extremely large size of singular images (usually up to gigapixels). The property of extremely large size for a single image also makes a histopathology image dataset be considered large-scale, even if the number of images in the dataset is limited.

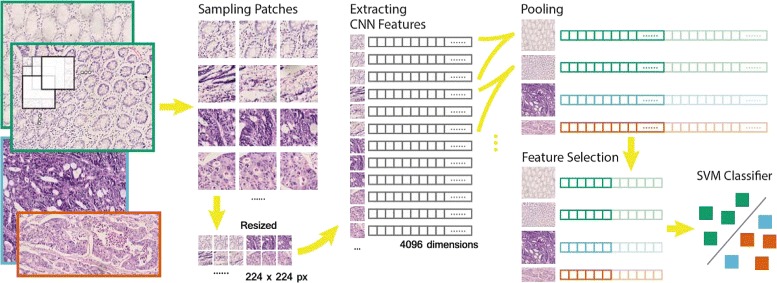
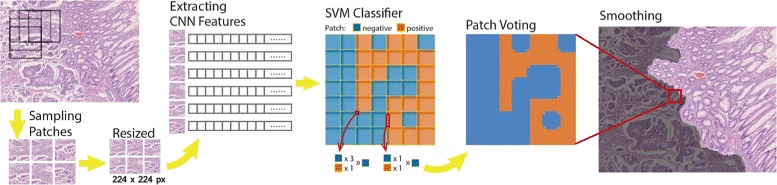
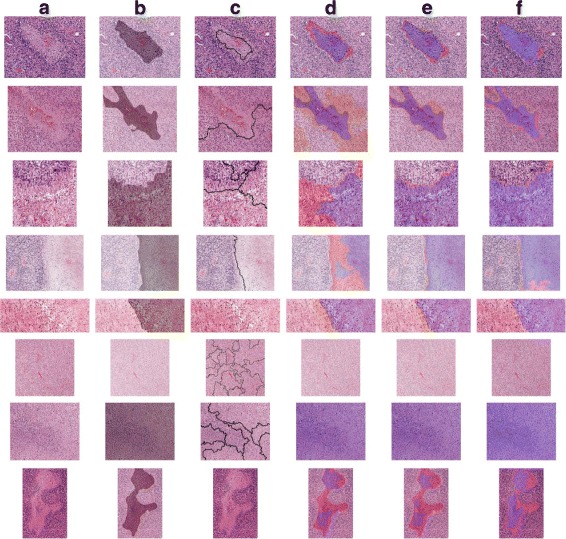
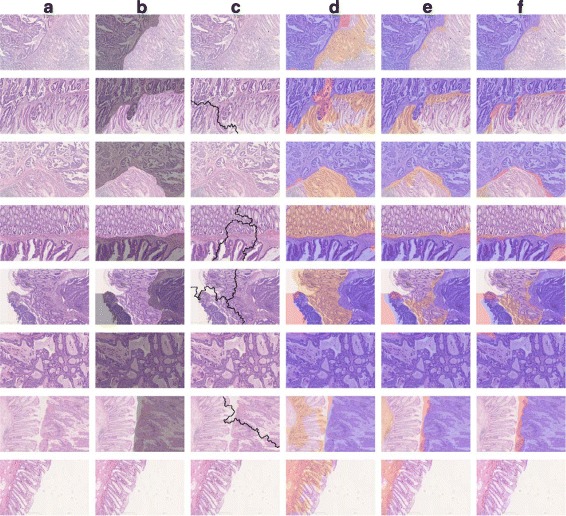
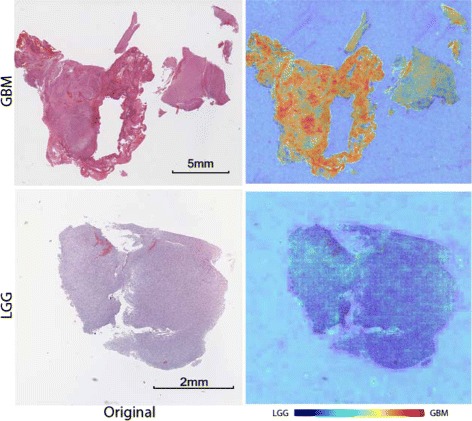
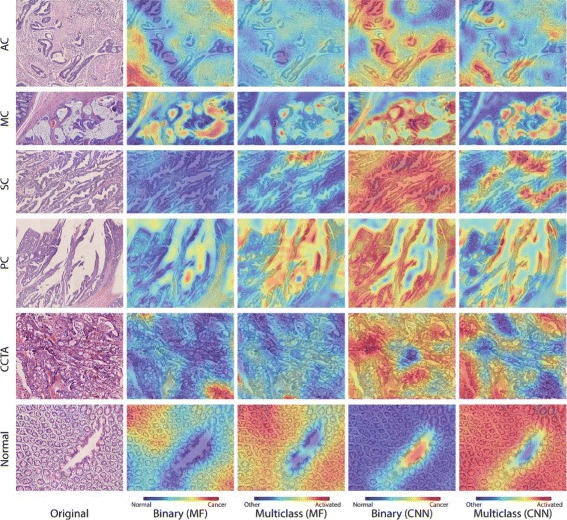
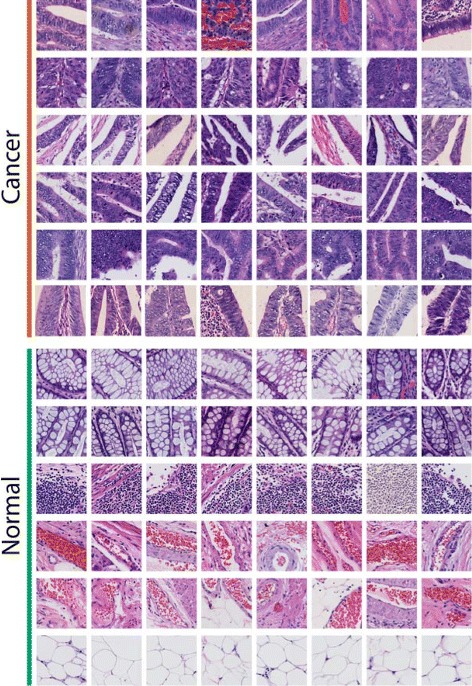
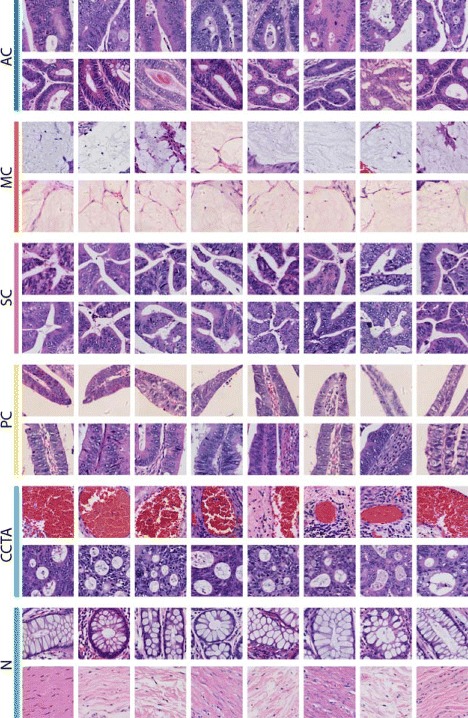
Results: In this paper, we propose leveraging deep convolutional neural network (CNN) activation features to perform classification, segmentation and visualization in large-scale tissue histopathology images. Our framework transfers features extracted from CNNs trained by a large natural image database, ImageNet, to histopathology images. We also explore the characteristics of CNN features by visualizing the response of individual neuron components in the last hidden layer. Some of these characteristics reveal biological insights that have been verified by pathologists. According to our experiments, the framework proposed has shown state-of-the-art performance on a brain tumor dataset from the MICCAI 2014 Brain Tumor Digital Pathology Challenge and a colon cancer histopathology image dataset.

Conclusions: The framework proposed is a simple, efficient and effective system for histopathology image automatic analysis. We successfully transfer ImageNet knowledge as deep convolutional activation features to the classification and segmentation of histopathology images with little training data. CNN features are significantly more powerful than expert-designed features.

Keywords: Classification; Deep convolution activation feature; Deep learning; Feature learning; Segmentation.


Figures

Fig. 1
Fig. 1
The classification workflow. First, square patches of 336 or 672 pixels in size are sampled on a rectangular grid, depending on the magnification scale of the image. Patches are then resized to 224 pixels in size as the input of our CNN model. A 4096-dimensional feature vector is extracted from the CNN model for each patch. A 100-dimensional feature is obtained by feature pooling and feature selection for each image. Finally, a linear SVM classifies the selected features. The figure shows a binary classification, where the positive (blue and orange) and negative (green) are GBM and LGG in brain tumor, cancer and normal in colon cancer respectively. In multiclass classification, a full feature vector of 4096 dimensions is used
Fig. 2
Fig. 2
The segmentation workflow. Similar to classification workflow, square patches of 112 pixels in size are sampled on a rectangular grid with 8-pixel stride. Each patch is assigned a positive (orange) or negative (blue) label, which are necrosis vs. non-necrosis in brain tumor, and cancer vs. normal in colon cancer, respectively. In training phase, a patch is labelled positive if its overlap ratio with annotated segmented region is larger than 0.6. Patches are then resized and a 4096-dimensional feature vector is extracted from our CNN model. A linear SVM classifier is used to distinguish negative from positive patches. Probability mapping images are yielded utilizing all predicted confidence scores. After smoothing, positive segmentations are obtained
Fig. 3
Fig. 3
Segmentation results for the brain tumor dataset. a the original images. b ground truth of necrosis (positive) region masked gray. The rest of the columns show the prediction results by c GraphRLM, d SVM-MF, e SVM-CNN, and f SVM-FT methods where true positive, false positive (missed), and false negative (wrongly predicted) region are masked purple, pale red, and orange, respectively
Fig. 4
Fig. 4
Segmentation method comparison for the colon cancer dataset. a the original images. b ground truth of necrosis (positive) region masked gray. The rest of the columns show the prediction results of c GraphRLM, d SVM-MF, e SVM-CNN, and f SVM-FT methods where true positive, false positive (missed), and false negative (wrongly predicted) region are masked purple, pale red, and orange, respectively
Fig. 5
Fig. 5
Heatmap for brain tumor GBM vs LGG classification. Each patch of the whole slide image is assigned a confidence using the classifier, which forms the heatmap. Regions that are red in color are more likely to be GBM regions. The purpose of these heatmaps is to illustrate which part of the whole slide image is considered important for the classifier and to prove the expressiveness of CNN features. In the GBM example, the endothelial proliferation regions, which are considered an essential morphologic cue for the diagnosis of GBM, show high positive confidence
Fig. 6
Fig. 6
Heatmap for binary and multiclass classification of colon cancer using both manual features and CNN activation features. Similar to Fig. 5, heatmap is drawn based on confidence scores of each patch, and the purpose is also to explore the expressiveness of CNN features. In binary classification (2nd and 4th column), red regions are more likely to be cancer. In multiclass classification (3rd and 5th column), only the classifier that predicts the image’s label is shown, that is, for the AC image, only the prediction of the AC-vs-rest classifier is shown. Areas that are red are more likely to be the image’s label. The transition of the highlighted regions from binary to multiclass classification indicates that our multiclass classifiers can recognize the specific characteristics of each cancer subtype. The comparison between the CNN features and manual features shows the CNN features have greater power of expressiveness than the manual features
Fig. 7
Fig. 7
Sample discriminative patches selected with individual components (neurons) of the CNN activation features. Each row of patches causes a high response in one of the 4096 neurons from all colon training images in binary classification task. 6 top-weight features for each classifier are selected and top patches triggering these 6 neurons are selected to represent the characteristics of the corresponding feature. The purpose of this figure is to show the characteristics of individual components of CNN features which are thought be important by the binary classifier. These visualized characteristics convey some clinical insights
Fig. 8
Fig. 8
Sample discriminative patches selected with individual components (neurons) of the CNN activation features. Each row of patches causes a high response in one of the 4096 neurons from all colon training images in multiclass classification task. Two top-weight features for each classifier are selected and top patches triggering these two neurons are selected to represent the characteristics of the corresponding feature. The purpose of this figure is to show the characteristics of individual components of CNN features which are thought be important by the multiclass classifier. These visualized characteristics convey some clinical insights

References

    1. Gurcan MN, Boucheron LE, Can A, Madabhushi A, Rajpoot NM, Yener B. Histopathological image analysis: a review. TBME. 2009;2:147–71. - PMC - PubMed
    1. Veta M, Pluim JPW, van Diest PJ, Viergever MA. Breast cancer histopathology image analysis: A review. TBME. 2014;61:1400–11. - PubMed
    1. Rastghalam R, Pourghassem H. Breast cancer detection using mrf-based probable texture feature and decision-level fusion-based classification using hmm on thermography images. Pattern Recog. 2014;51:176–86. doi: 10.1016/j.patcog.2015.09.009. - DOI
    1. Theodorakopoulos I, Kastaniotis D, Economou G, Fotopoulos S. Hep-2 cells classification via sparse representation of textural features fused into dissimilarity space. Pattern Recog. 2014;47:2367–78. doi: 10.1016/j.patcog.2013.09.026. - DOI
    1. Xu Y, Mo T, Feng Q, Zhong P, Lai M, Chang EI-C. ICASSP. Florence: IEEE; 2014. Deep learning of feature representation with multiple instance learning for medical image analysis.